

Docs Menu
Projects and Flows
Keep executable workflows, saved revisions, runs, and evidence together in a shared engineering project.
Access and project context
Open Engineering Studies, then Projects & Flows. This workspace requires Professional or Enterprise access. Owners and editors can change flows and launch runs. Commenters and viewers can inspect saved flows and results.
The selected project also appears in Current Project. This context follows you between Project Modelling, Engineering Studies, and Markets. Selecting a project does not itself run a model or calculate a result. See Layers, Networks and Projects for the sidebar controls.
Create or select a project
- Choose an existing project in Project, or enter a name in New project.
- Choose Create project to create a new project. The name cannot be blank.
- Use Flow builder to edit workflows. Use Runs to review executions of the selected flow.
- Choose Share to manage members, map context, comments, activity, and history. See Workspace Collaboration and Sharing.
If you switch project or flow with unsaved changes, a confirmation appears. Choose Cancel to keep editing. Switch project, Switch flow, or Create and switch discards those unsaved workflow changes.
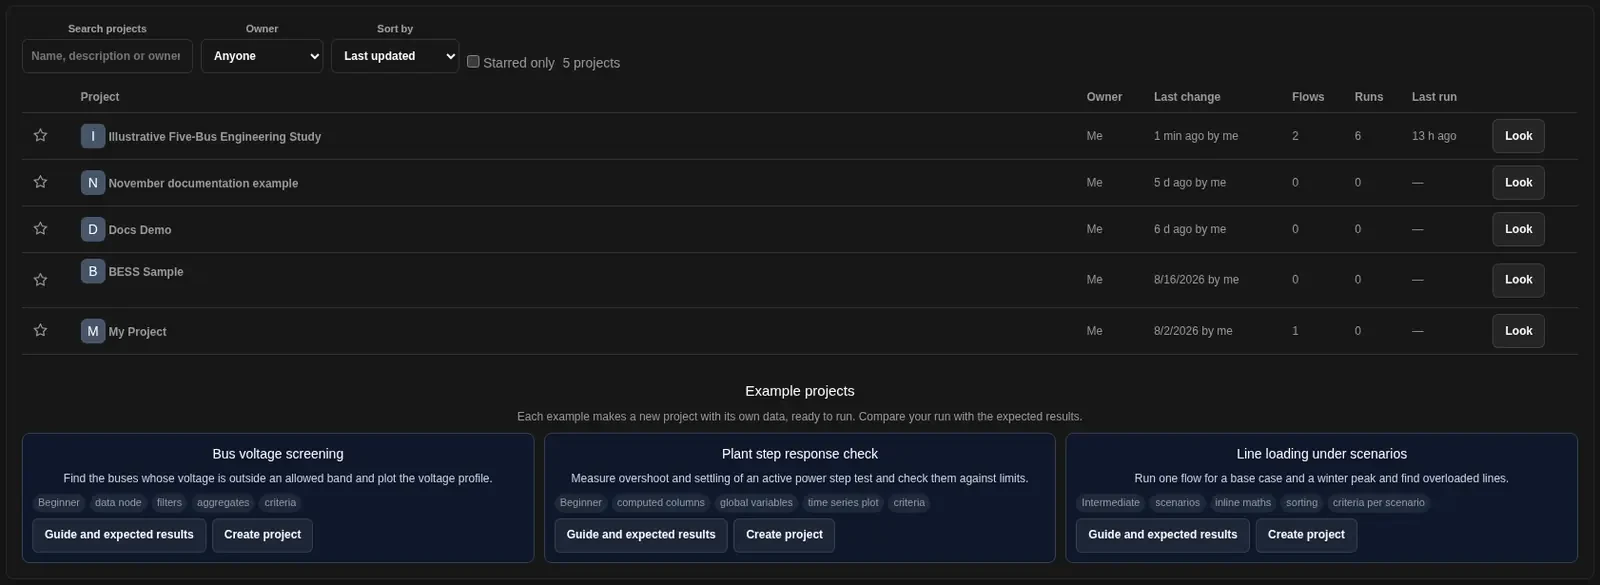
Find a project in the Projects list
- Choose Projects on the toolbar.
- Type in Search projects to filter the list. You can search by name, description or owner.
- Use Owner to filter by owner. The default is Anyone.
- Use Sort by to order the list. The default is Last updated.
- Tick Starred only to show only your starred projects.
The list has the columns Project, Owner, Last change, Flows, Runs and Last run. Under the list, Example projects lets you make a new project from an example, with its own data and a guide with the expected results.
Place the project on the map
- In Project map pin, choose Pin to map.
- Click the location on the 2D map. The saved pin shows latitude and longitude.
- Choose Move pin to select a replacement location.
- To stop placement, press Escape or choose Cancel pin placement.
- To remove the pin, choose Unpin, then Confirm unpin. Choose Keep pin to cancel.
Only owners and editors can change the pin. Removing a pin does not delete the project.
Start from an executable template
- Select the project that will contain the flow.
- Under Flows, choose an Executable template from the available catalog.
- Choose Create from template. This creates a flow in the selected project; it does not launch a run.
- Review the nodes, connections, and configuration before saving changes or launching.
Build an executable flow
Choose an existing flow under Flows, or create a new flow with the steps below.
- Enter a name in New flow and choose Create flow.
- In Executable graph, select a node type and choose Add node.
- Select the node card to open Node inspector.
- Edit its Label and Configuration JSON. The Type field is read-only.
- Choose Apply configuration. Changes to the JSON text are not applied until you choose this button.
- In Edges, select a source node and a different target node. Choose Connect.
- Repeat for each step. An edge sends the source output to the target input.
Use Delete node to remove a node and its connections. Use an edge's delete button to remove only that connection.
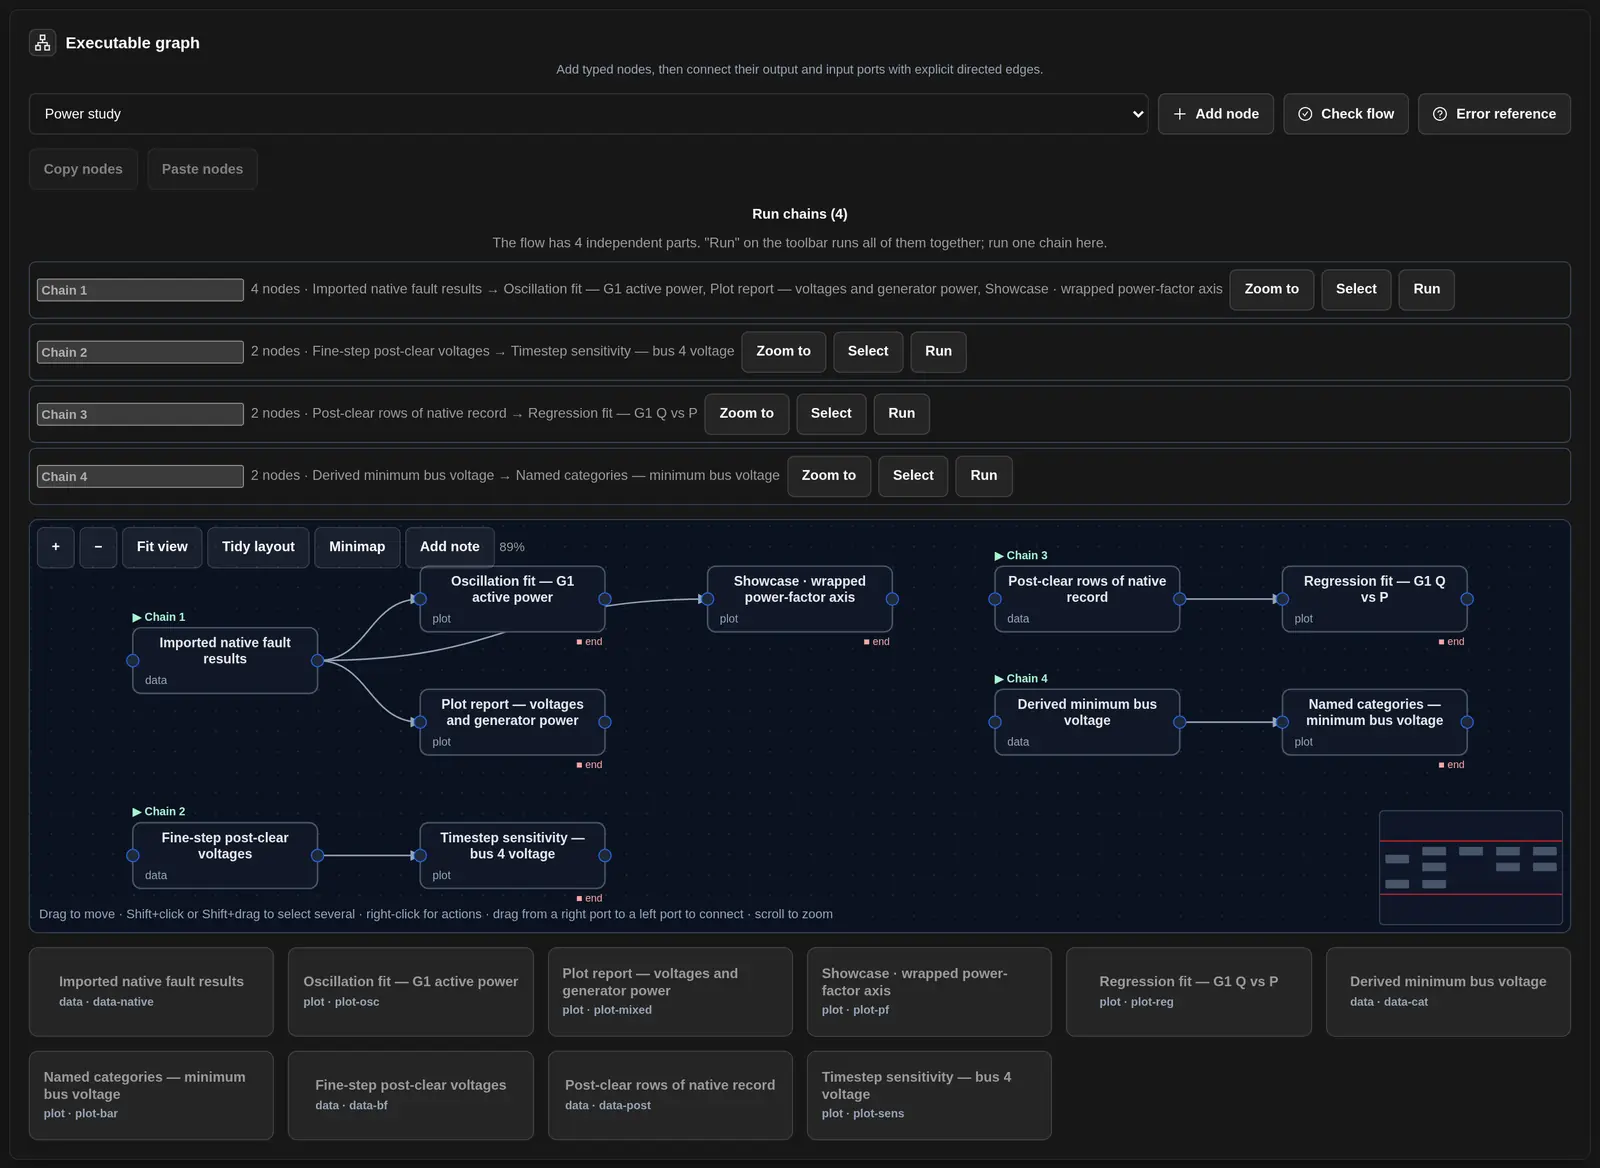
Use the flow canvas
The canvas draws each node with a line for each connection. The hint under the canvas lists the mouse actions:
- Drag a node to move it.
- Shift+click or Shift+drag to select several nodes.
- Right-click for more actions.
- Drag from a right port to a left port to connect two nodes.
- Scroll to zoom.
The canvas toolbar has these controls:
- + and − zoom in and out. The zoom level shows as a percentage.
- Fit view shows the whole flow.
- Tidy layout arranges the nodes in order.
- Minimap shows a small map of the flow.
- Add note puts a note on the canvas.
Undo and Redo are not on the canvas toolbar. They are in the Revision panel on the left, with Save revision and Keyboard shortcuts.
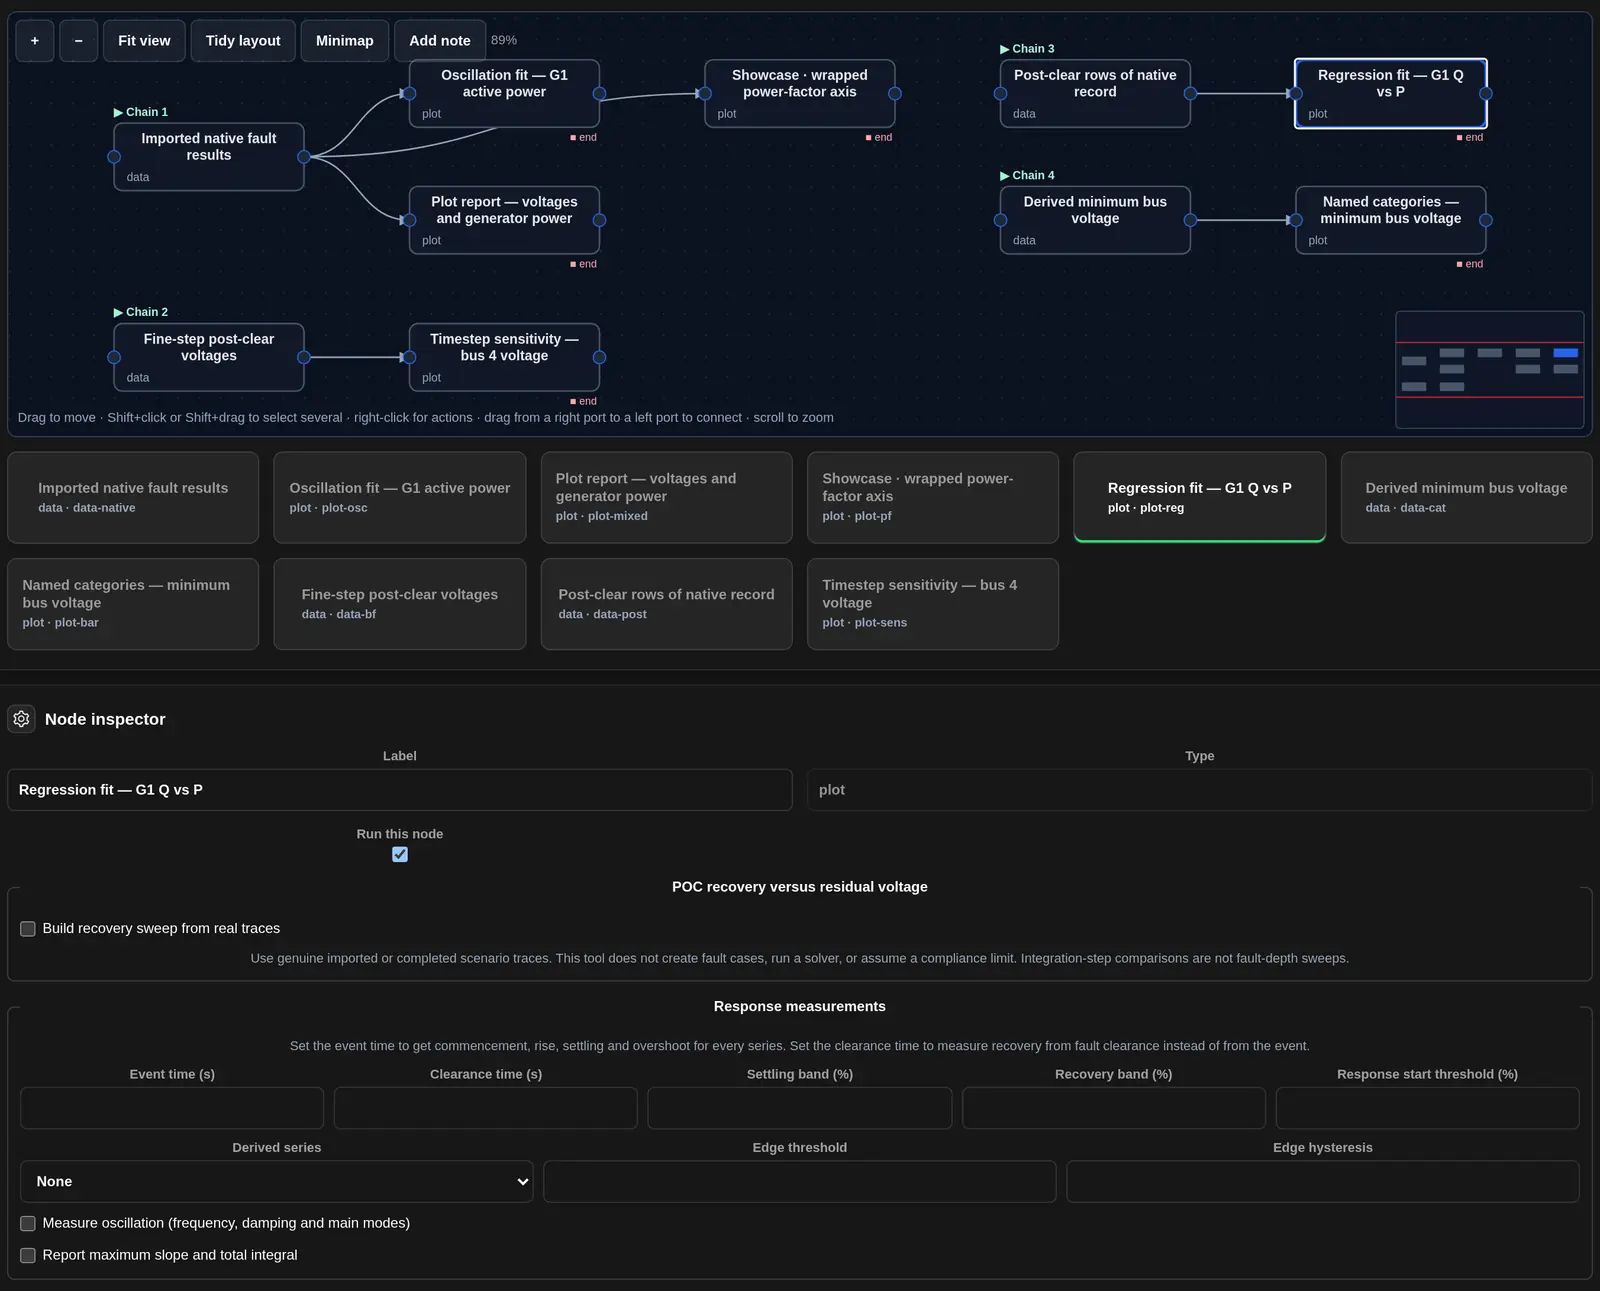
Select a node on the canvas to open it in the Node inspector panel below the canvas. The form shows the fields for that node type. Apply settings stays grey until you change a field. Choose Apply settings to keep a change, or Reset to drop it. Lower down the panel, you can edit the node as JSON and choose Apply configuration, or choose Delete node.
| Node type | Purpose and input |
|---|---|
| Map scope | Passes the captured study scope and run variables to later nodes. |
| Grid Circuit Source | Select a Published Grid Circuit revision from this project. The workflow keeps the exact revision and its content digests, rather than following later circuit edits. |
| Power study | Runs an engineering study using the scope or upstream circuit. A new node starts with engine: "auto" and studyType: "model_quality". |
| Data | Provides an inline table or reads an uploaded dataset. Configuration can rename columns, scale values, filter rows, and resample a time column. |
| Plot | Builds chart specifications and plot artifacts from an upstream table. A new node starts with plot type line. |
| Table | Selects, renames, filters, sorts, and computes columns from upstream tables. It can combine iteration results. |
| Analysis | Evaluates configured acceptance criteria. Review the value, expected result, status, and message for each criterion. |
| Measured overlay | Compares measured and simulated time-series channels using configured mappings. Outputs include comparison tables, charts, and error metrics. |
| Evidence report | Collects workflow evidence into downloadable artifacts. A new node uses bundle name engineering-evidence. |
| Vendor export / upload | Prepares an external simulator handoff and waits for uploaded results. Review the target and input requirements in Configuration JSON. |
| Loop start and Loop end | Mark the boundaries of an iteration. Use these nodes with Loop matrices (zipped), not a circular graph. |
For a circuit input, publish the circuit first in Grid Circuit Builder. The source node must refer to a published revision that you can access.
Configuration example: measured data
To request a file during a run, use a Data node without upstream results. Replace its default configuration with this JSON, then choose Apply configuration:
{
  "name": "Measured data",
  "promptForUpload": true
}
Do not leave the default inline table in this configuration. An existing inline table supplies data instead of requesting a file. The upload control accepts CSV, TSV, and XLSX. Use sheet to select an XLSX worksheet, headerRow for the header row, and timeColumn with resampleSeconds for time resampling. The header row defaults to 1. Resampling intervals are in seconds.
Variables, scenario rows, and loops
These workflow scenario rows are parameter sets for an execution. They are not saved Project Modelling cases.
| Control | How to use it |
|---|---|
| Global variables | Enter a name and value, then choose Add global. Names must be unique and non-empty. This control stores values as text. |
| Scenario rows | Enter a scenario name and a JSON object of values, such as {"loadMultiplier": 1.1}. Choose Add scenario. The field requires an object, not a list or a single value. |
| Loop matrices (zipped) | Enter the loop name, variable name, and comma-separated values. Select different start and end nodes, then choose Add loop. Each value creates a row. At least one value is required. |
| Remove | Removes the selected global variable, scenario row, or loop from the unsaved document. |
Save and restore revisions
- Check the Revision panel for Unsaved changes.
- Enter a Change note to explain the update.
- Choose Save revision.
- To reuse an earlier revision, choose its Restore button.
- Review the restored document. It is loaded as unsaved changes. Choose Save revision to create a new saved revision.
The revision panel shows the most recent eight revisions. Saving validates the graph before it creates a revision. Invalid JSON, duplicate IDs, missing node references, self-connections, cycles, or duplicate global variable names must be corrected. A duplicate edge cannot be added. If another editor changes the saved revision, reload the current flow before saving your changes again.
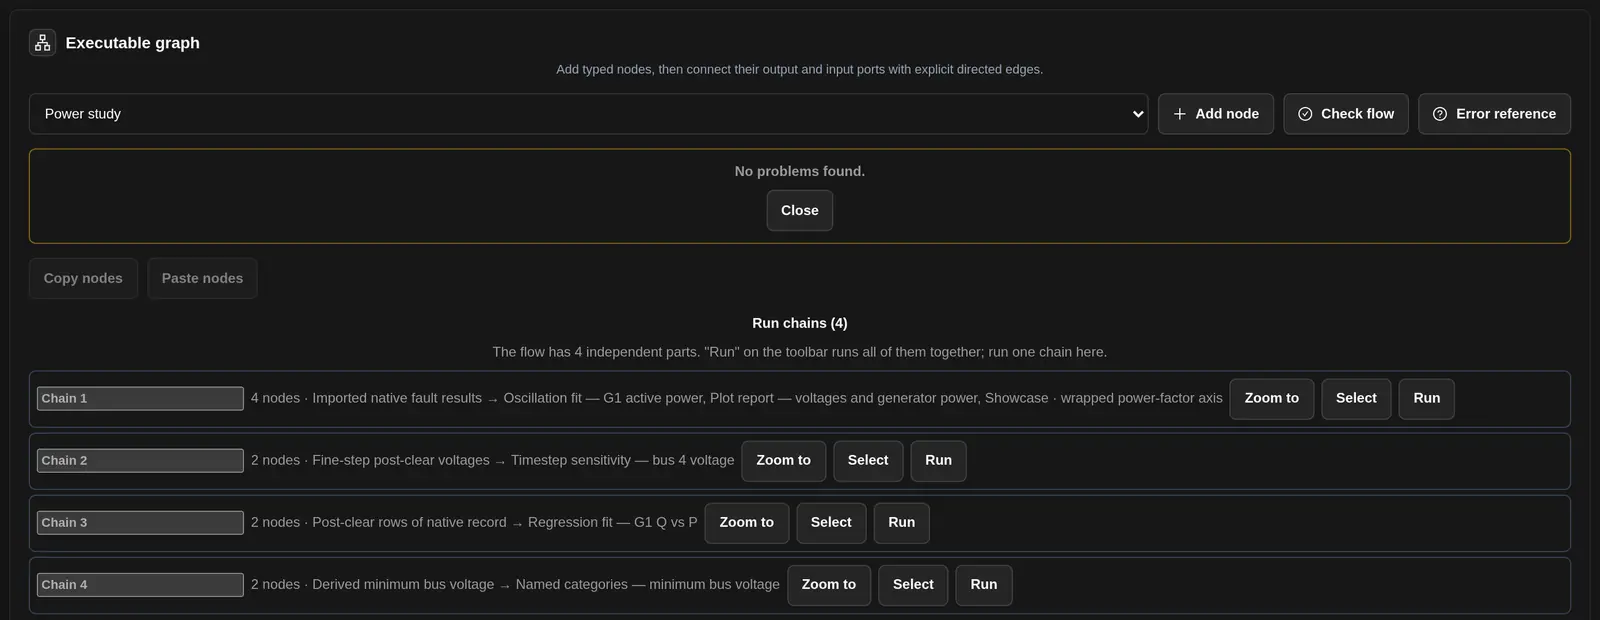
Check the flow
- Choose Check flow above the canvas.
- Read the result box. When the flow has no problems, it says No problems found.
- Choose Close to close the box.
A clean check means the flow is well formed. Run the flow to inspect its engineering results.
Launch and control a run
- Review the study scope and settings that the flow will use.
- In Launch, choose a Priority: Low, Normal, or High. The default is Normal.
- Choose a Cache policy from the table below. The default is Use cache.
- Choose Launch run. A flow needs at least one node.
- If the flow has unsaved changes, launch saves a revision first. The run uses that saved revision.
- Review the run in Runs. Progress refreshes automatically. Choose Refresh to request the latest state.
| Cache policy | Meaning |
|---|---|
| Use cache | Reuse eligible cached node results when the input matches. |
| Refresh | Recompute results and update eligible cache entries. |
| Off | Do not read or write cached node results. |
| Run or node status | Meaning and next action |
|---|---|
| pending / queued | The node or run has not started. Wait for execution or review queue availability. |
| running | Execution is in progress. Review updates or choose Cancel if you no longer need the run. |
| retrying | A node is being attempted again. Check its attempt count and event messages. |
| waiting_for_input | A node needs a measured dataset or external simulator results. Complete the upload described below. |
| completed | Execution finished. Review the engineering outcome separately. |
| failed | Execution could not finish. Read the node message and run events. Correct the cause before retrying. |
| cancelled | Execution was stopped. Choose Retry if you need another attempt. |
| skipped | The node did not execute. Inspect its message and result before using downstream output. |
Cancel is available for queued, running, or waiting runs. Retry is available for failed or cancelled runs. These actions require owner or editor access.
Resume a waiting node
- Open the waiting run.
- For Measured data input, select the requested CSV, TSV, or XLSX file.
- For External simulator hand-off, choose Download vendor package when a package is available.
- Run that package in the external program with the required license.
- Select the result ZIP, XLSX, or CSV file.
- Choose Upload and resume. Accepted input allows dependent nodes to continue.
Use the measured-data steps or the external-simulator steps as appropriate. Read any upload error and correct the data before trying again.
Review results and download evidence
- Choose Runs and select a run. The header shows the run name, the status, the priority, cache use, the outcome and the run time.
- Read the run notes under the header. Choose Edit run details to edit the run details.
- Read Node results. Each row is one task, with its status, attempt and message. A cached task reused a saved result and did not run again.
- Use the All statuses, All node types and All scenarios filters, or the search box, to find a task. Use the sort list to order the rows: Run order, Problems first, Longest first or Node name. Tick Every attempt to show retried attempts.
- Choose View result to open a node result. Choose Log to read the task log. Choose Go to node to open the node in the flow builder.
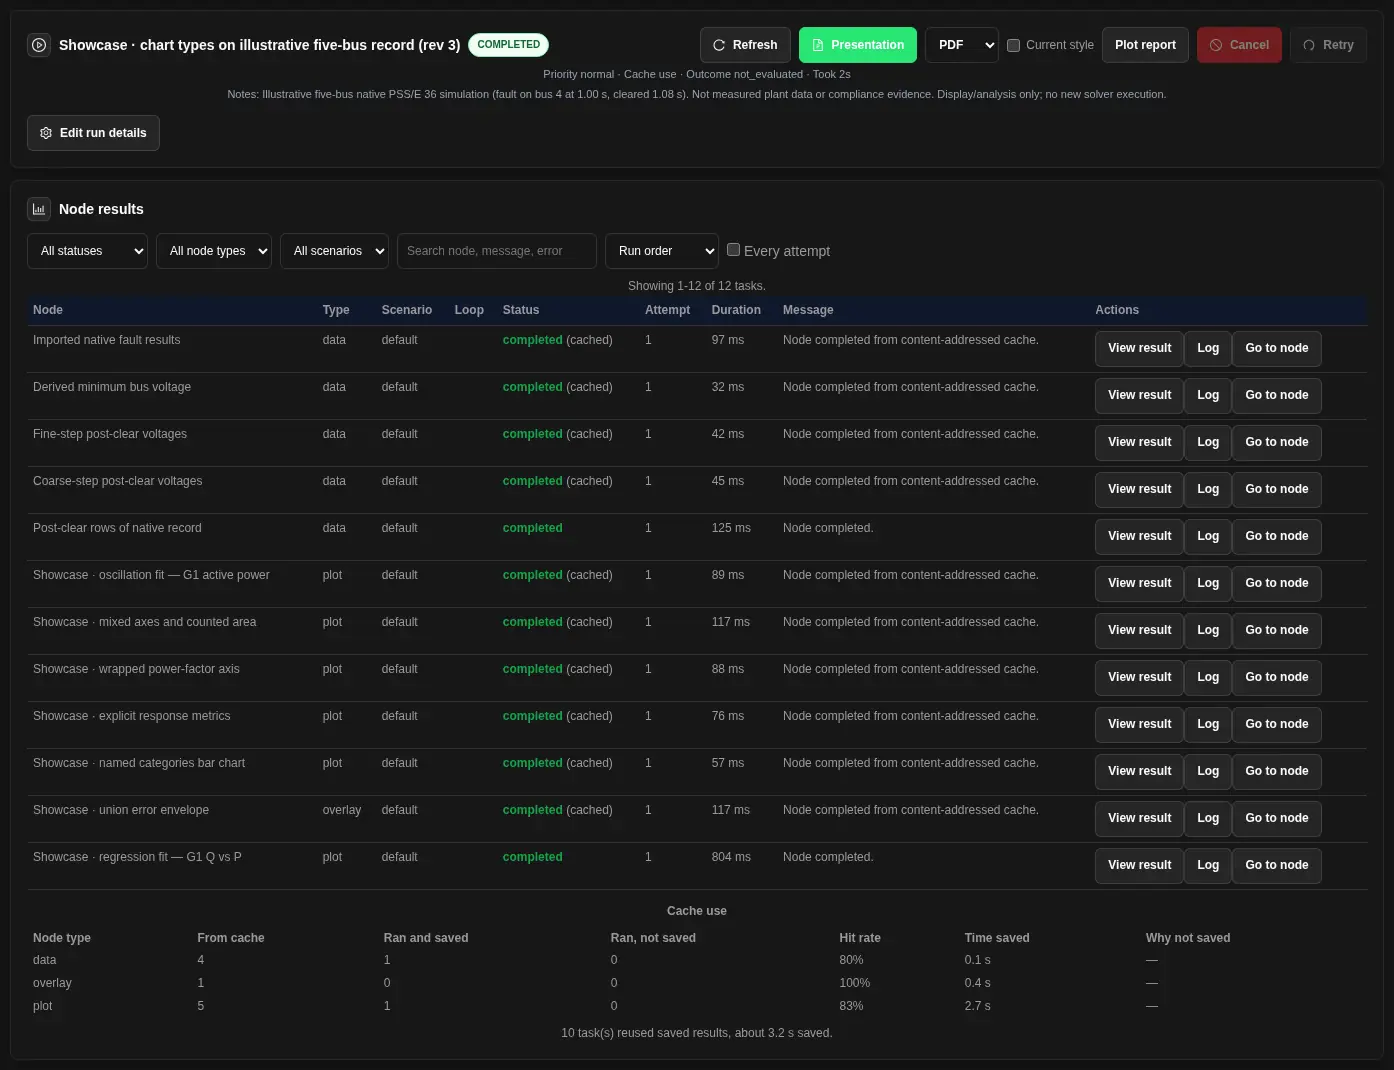
Choose Log in a row to open the task log. It opens under the Node results table. The log header shows the node, the attempt and the count of errors and warnings.
- Use Log level to filter the lines: All lines, Info and above, Warnings and errors or Errors only.
- Type in Search the log to find a line.
- Choose Close log when you are done.

In a node result, choose Refresh result to reload its output. Choose Close to close the result detail.
- Summary shows the normalized result summary.
- Variables and provenance shows the values and source records used by the node.
- Acceptance criteria lists the criterion, status, value, expected value, unit, and message.
- Result tables show up to 250 rows. Download the artifact for a complete table.
- Charts shows the plot node charts. Open Chart specification under a chart to read its definition as JSON. See Charts in workflow runs.
- Node artifacts lists files produced by that node.
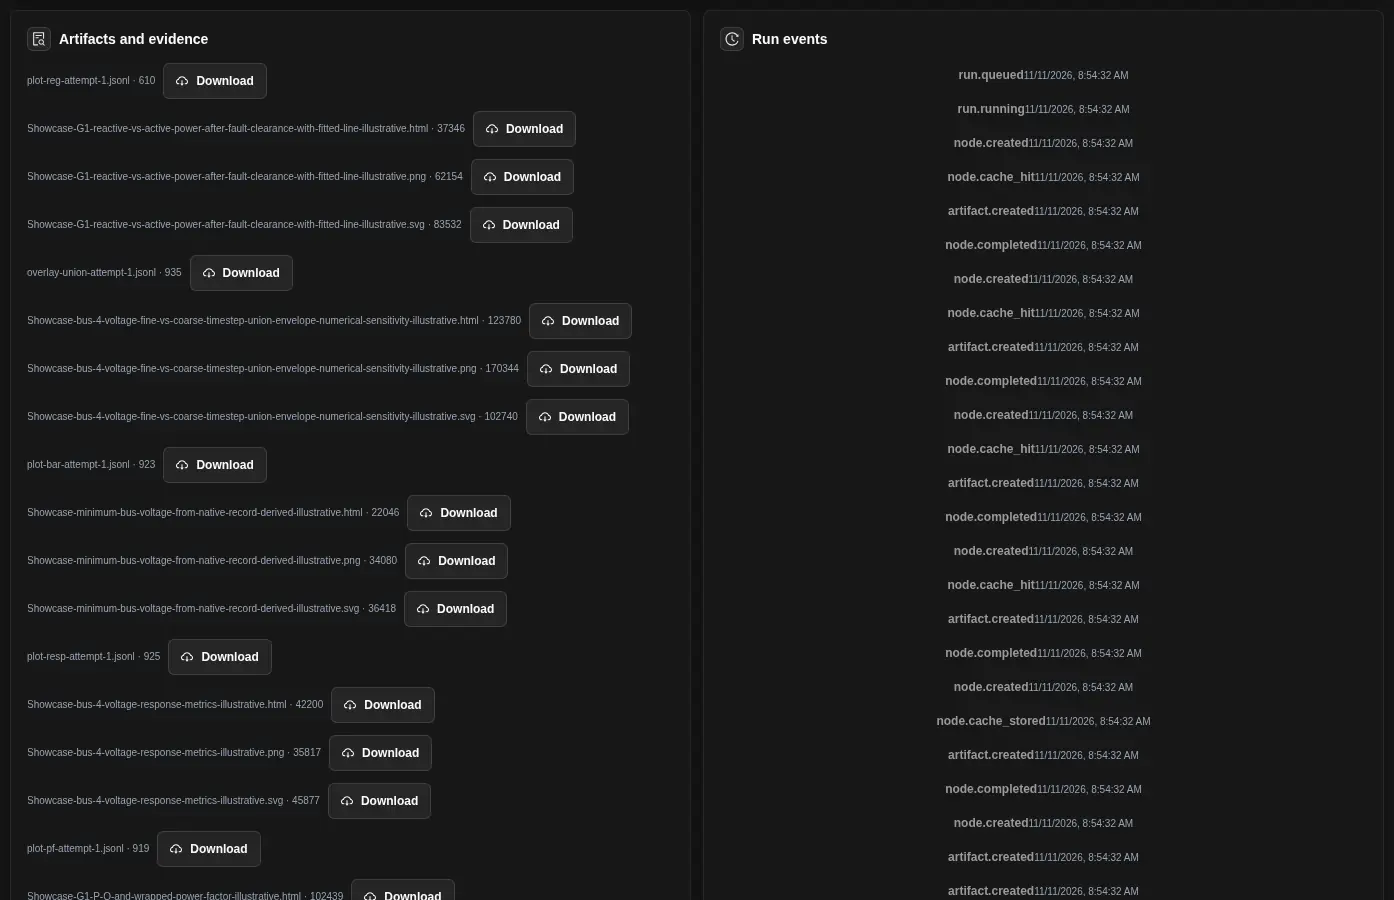
- Artifacts and evidence provides Download buttons for run files.
- Run events provides event types, times, and messages.
| Engineering outcome | Interpretation |
|---|---|
| pass | The evaluated criteria passed. Check their scope and assumptions before relying on the result. |
| fail | At least one evaluated criterion failed. Review the value, limit, and message. |
| review | Manual review or unresolved evaluation remains. Resolve the evidence or configuration issue before accepting the result. |
| not_evaluated / not evaluated | No assessed outcome is available. Add or complete the required criteria and evidence. Do not treat this as a pass. |
For a completed run, choose Presentation to prepare a presentation from its results. See Engineering Exports and Handoffs for presentation controls and handoff guidance.
Make a plot report
- Open a completed run in Runs.
- In the run header, choose the Plot report format: PDF or HTML.
- Choose Plot report. The report collects the charts of the run in one file.
- Your browser downloads the report. A copy is also kept in Artifacts and evidence for the run.
A plot report shows the run results again. It does not run the study again. Read it before you share it.
See runs in all projects
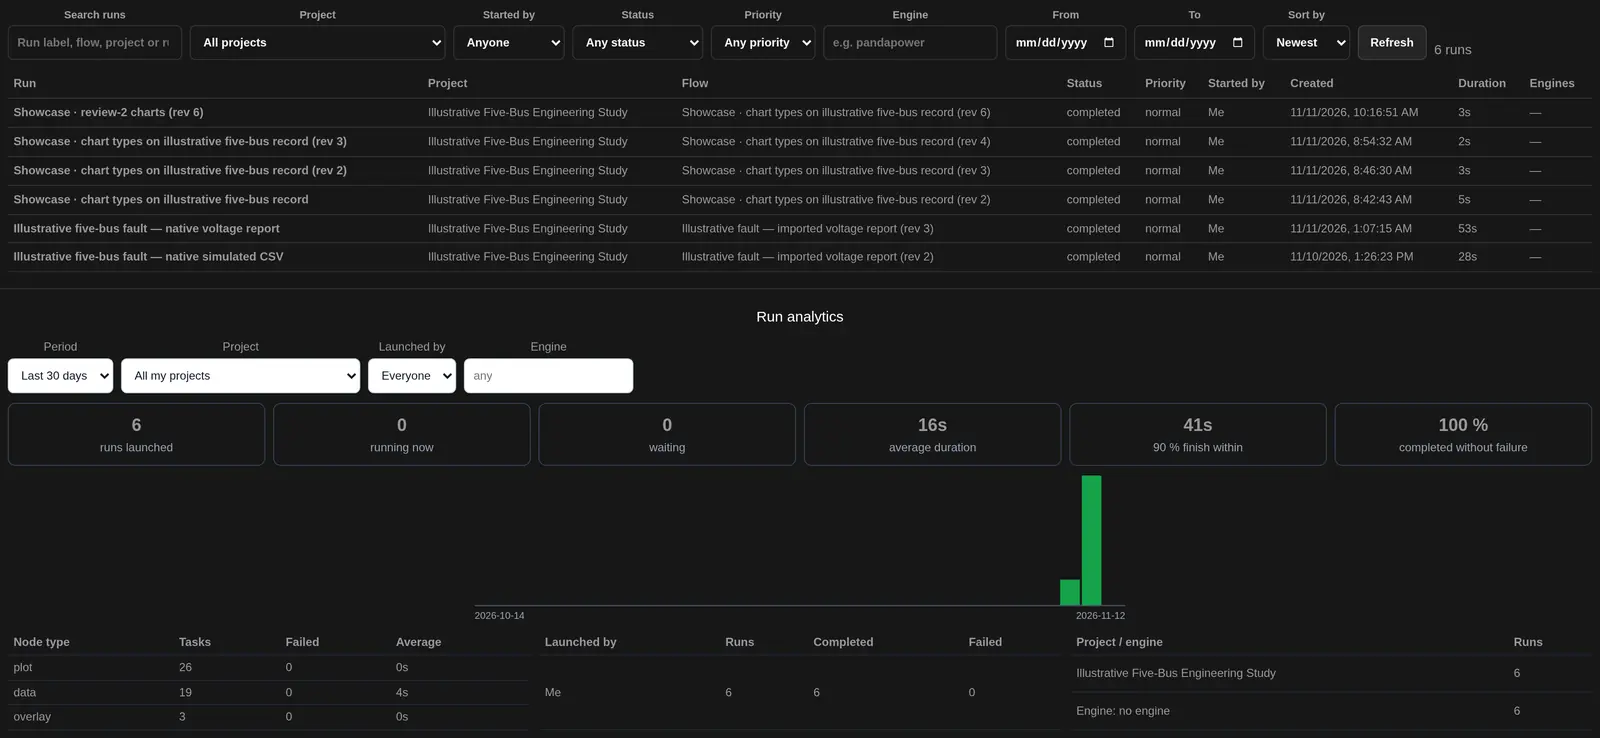
Choose All runs to list runs across your projects.
- Type in Search runs to search by run label, flow or project.
- Filter by Project, Started by, Status, Priority and Engine. Use From and To to set a date range.
- Use Sort by to order the list: Newest, Started, Finished, Longest or Priority.
The list shows the run, project, flow, status, priority, who started it, when it was created, its duration and its engines. Run analytics sums up runs for a period, such as the last 7 days.
How this differs from Study Builder
Study Builder organizes the study process inside Engineering Studies. Projects & Flows stores executable graphs with their own revisions, run records, node outputs, and artifacts. They are separate views, not two names for the same saved document.
The project selector supplies shared project context. Workflow launches capture the current study payload, including its scope and assumptions. A Grid Circuit Source instead identifies an exact published circuit revision for downstream use. Check the intended source before launching. See Engineering Studies for Study Builder controls, and Running Engineering Studies for scope selection and study setup.
Keep External Results with Their Run
A vendor-run step can stop at waiting_for_input after preparing a package. The workflow needs results from the external licensed-tool run; it does not mean that simulation has completed.
Keep the original package and run identity with the returned results. If import checks reject an upload, inspect the findings and correct the files or external run. Resume only when the accepted results belong to the intended case.
See the prepared-case handoff guidance for model-input and licensed-solver limits.
Related Guides
- Workspace Collaboration and Sharing
- Layers, Networks and Projects
- Grid Circuit Builder
- Running Engineering Studies
- Project Modelling
- Engineering Exports and Handoffs


