

Constraint Headroom, Line by Line
Know how the grid treats a site before you commit: see which constraint equations bind on the line you connect to, how close they run, and what they cost in dispatch.
Operator data, never estimated • ISO/IEC 27001 certified • Cancel anytime
Headroom You Can Trace to the Equation
Pick a transmission path on the map. Network Map shows the constraint equation behind it, how close that equation runs to its limit, and its history, 5-minute dispatch interval by interval.
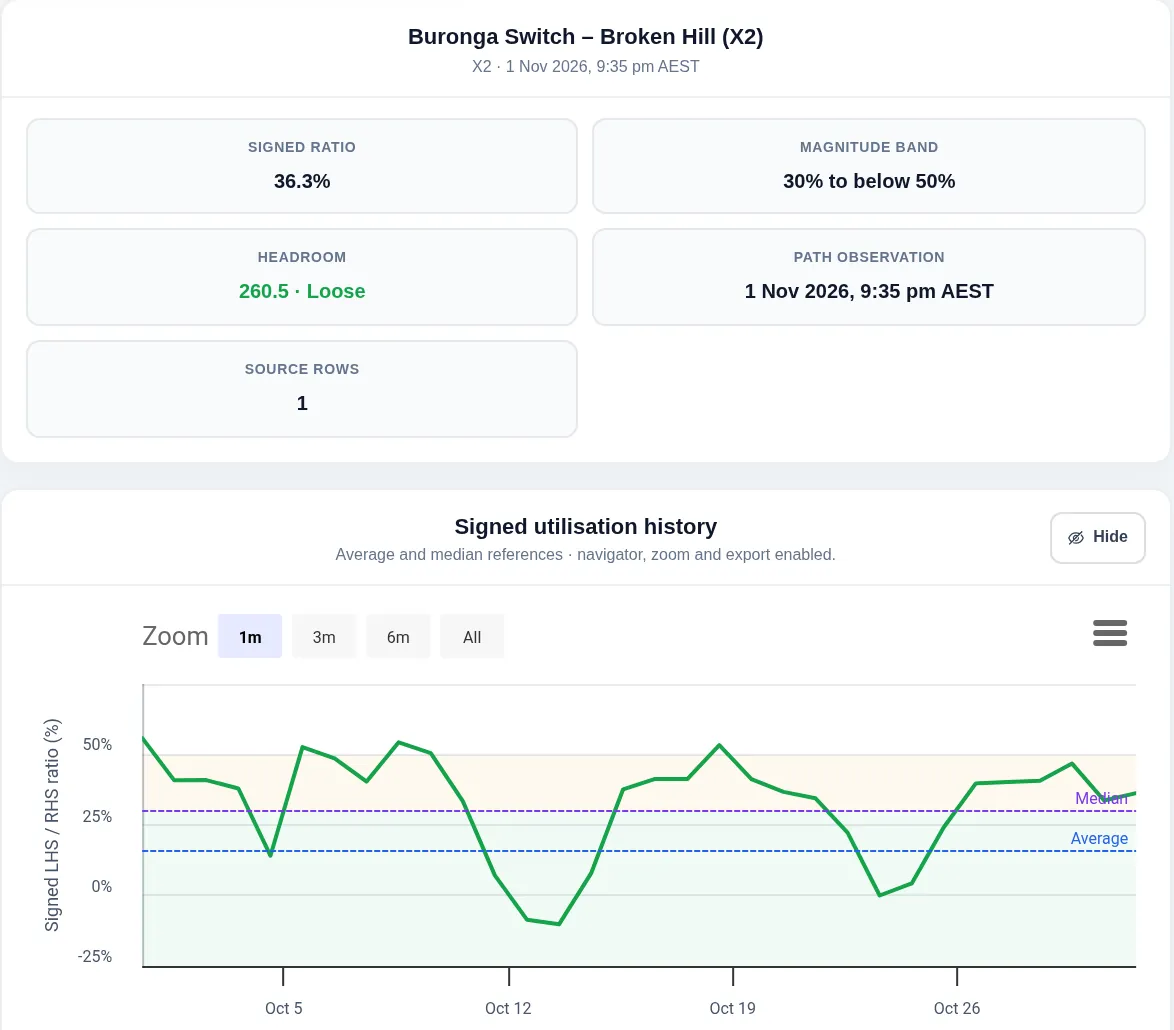
Worked Example: Buronga Switch – Broken Hill (X2), 220 kV
X2 is the 220 kV line that carries Broken Hill's solar and wind output south to Buronga. Its path is mapped to the constraint equation N>NIL_X2. These figures were read from the live Constraints view and the constraint history API on 1 Nov 2026.
Source: the market operator's dispatch constraint solutions via the Network Map constraint archive. UI figures from the Constraints view; statistics from GET /v1/markets/nem/constraints/history?line=X2 at 5-minute and daily resolution, read 1 Nov 2026 10:35–10:38 UTC.
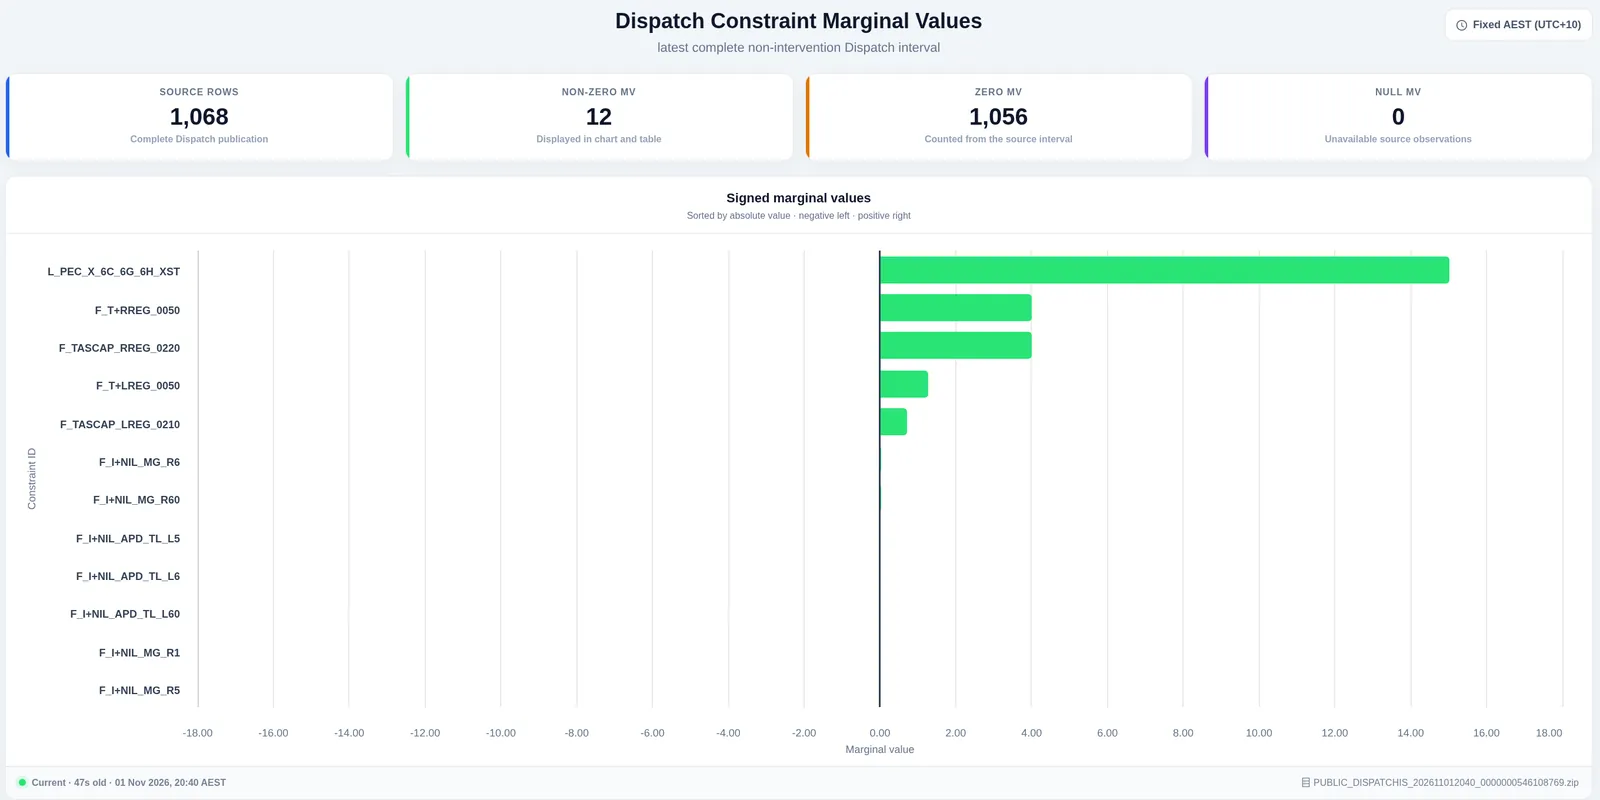
This Interval, Not Last Month
Grid Constraints, marginal values and prices are read at the 5-minute dispatch interval, the same day the market operator publishes them. Every screenshot on this page carries its observation time.
Explained, Not Just Measured: Why Buronga Binds Tonight
A ratio shows how close a line runs. The equation shows why. On the evening of 1 Nov 2026 the equation binding in the Buronga area was L_PEC_X_6C_6G_6H_XST, and its ID carries the outage tag of the constraint set N-X_6C_6G_6H, which covers lines 6C, 6G and 6H at Buronga.
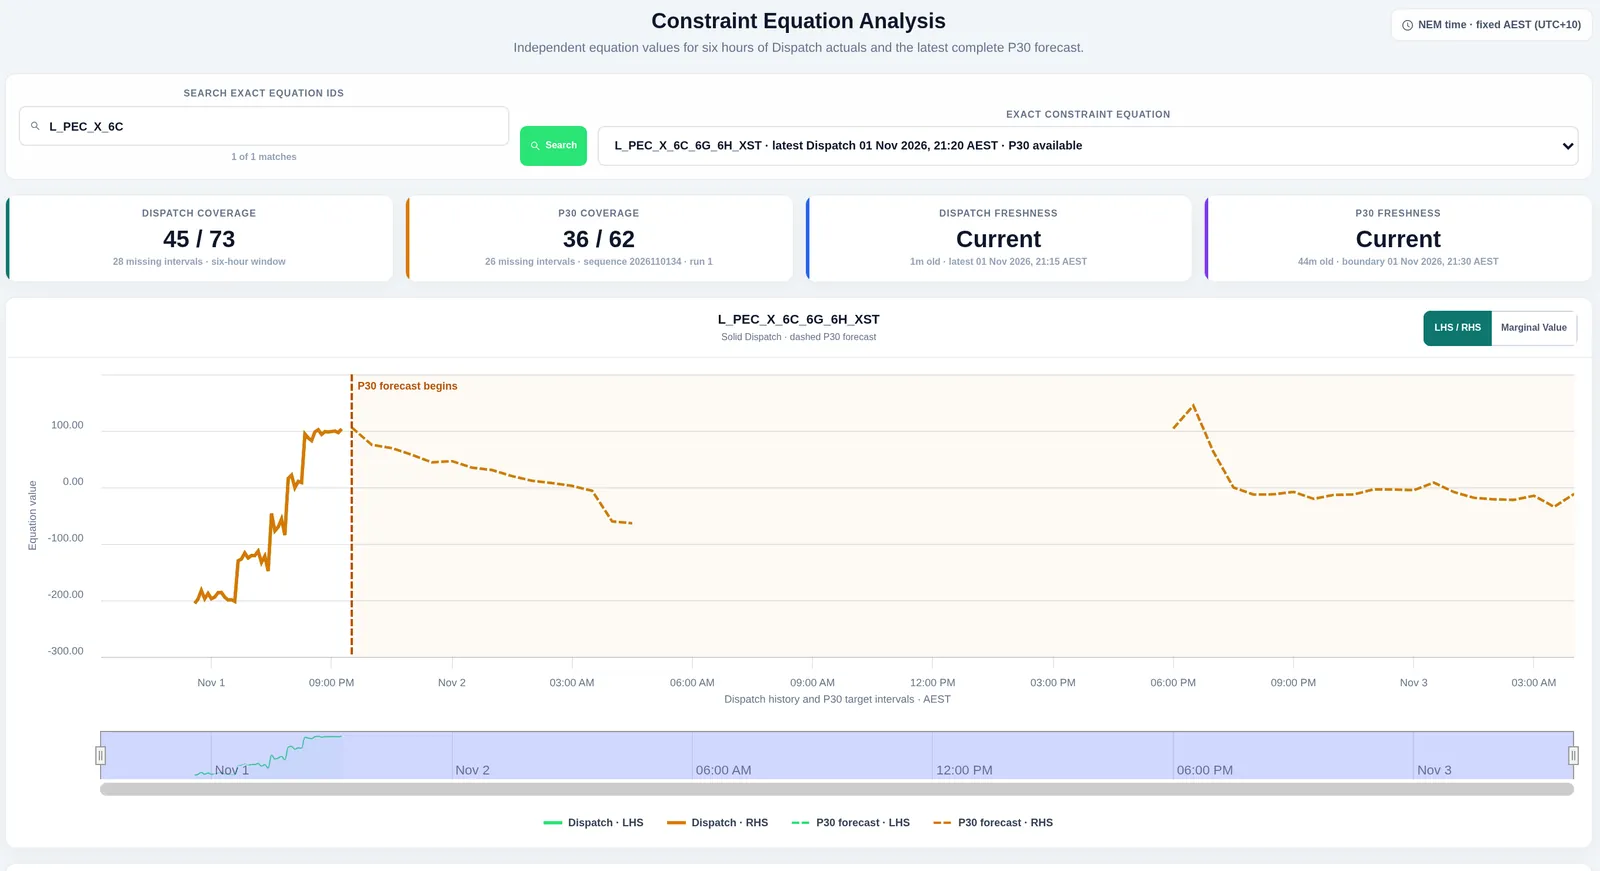
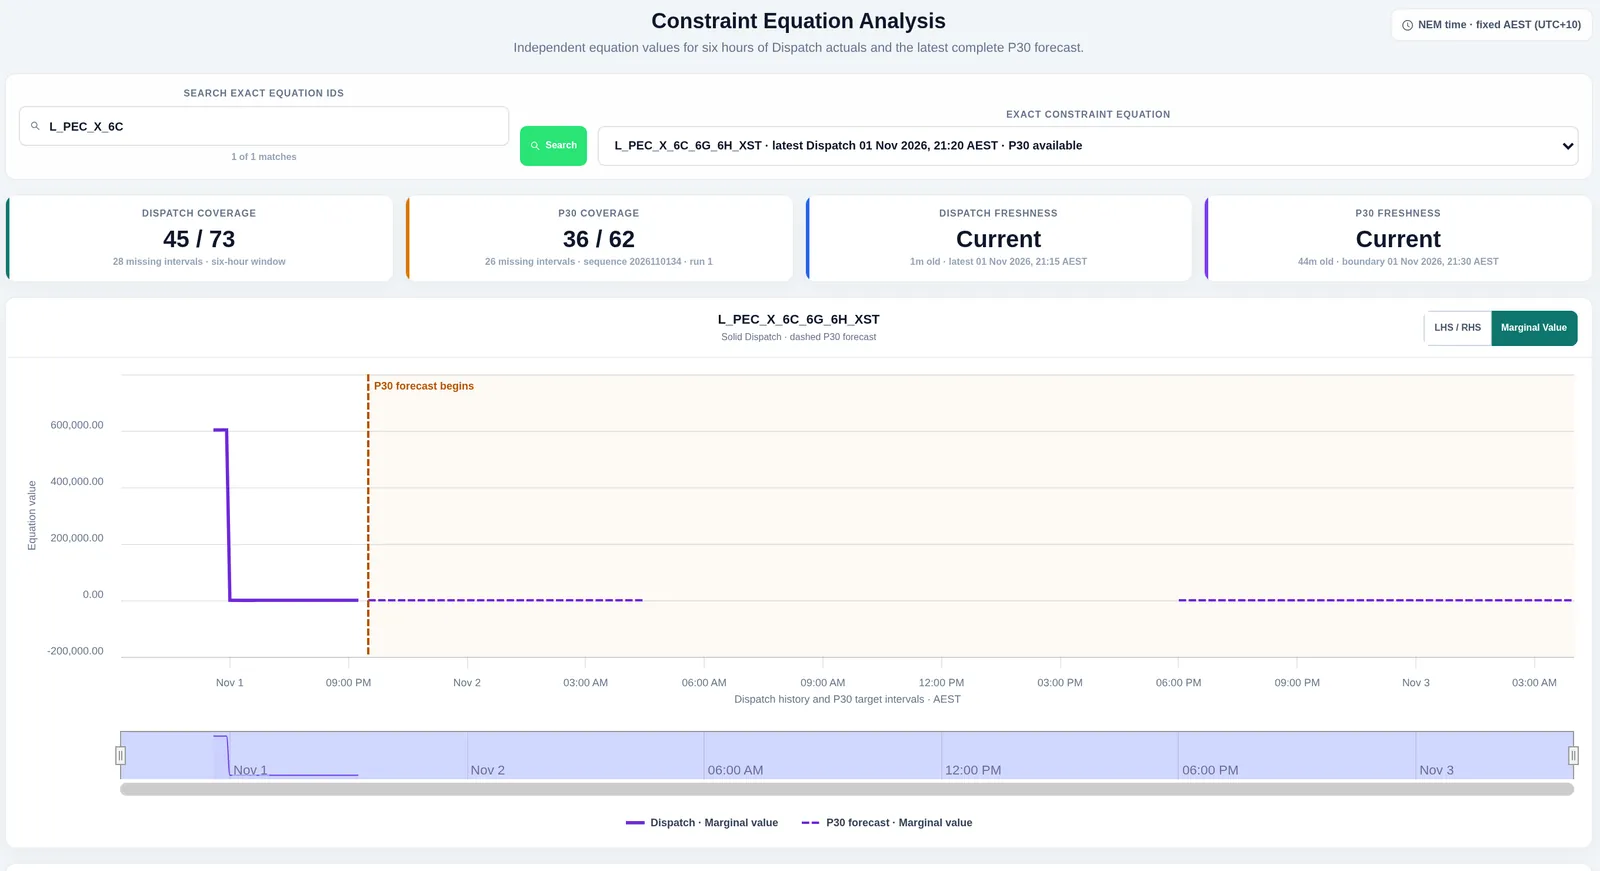
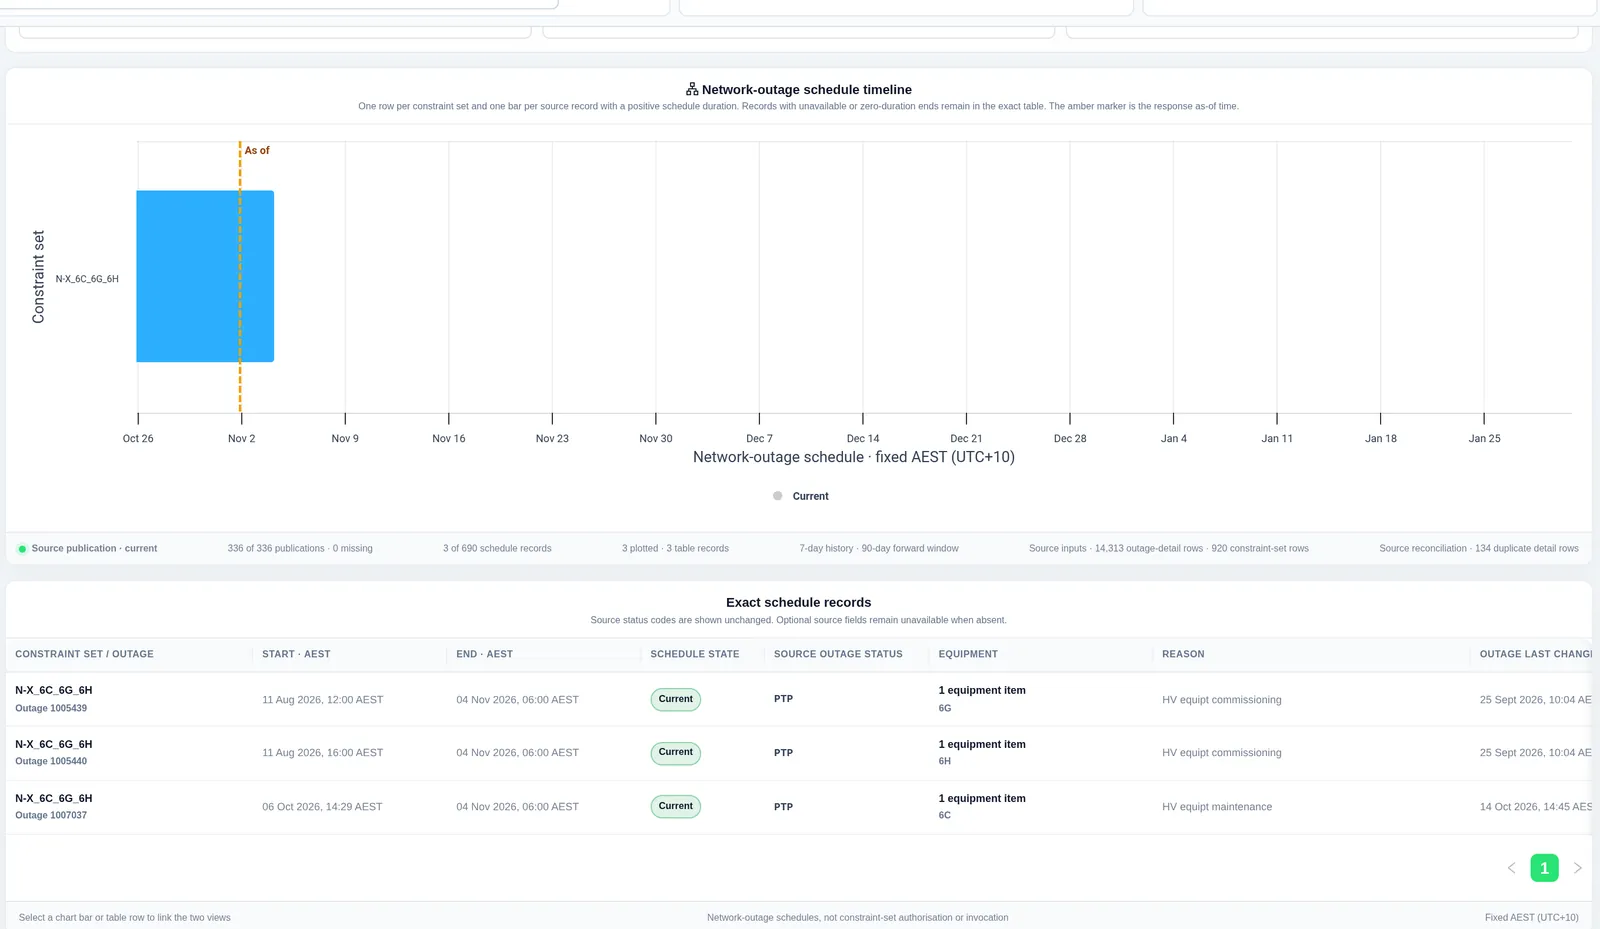
Source: the market operator's 5-minute dispatch files (latest file PUBLIC_DISPATCHIS_202611012115, SHA-256 recorded) and the network outage schedule; GET /v1/markets/nem/constraints/equations/detail and /constraints/outages?constraintSetId=N-X_6C_6G_6H, read 1 Nov 2026 11:13–11:14 UTC.
What Pro Shows You
The same evidence a connection study team asks for, on the line where it happens.
Readable Line Names
Paths named from the network operator's own descriptions, matched to constraint IDs by line number, end stations and voltage.
Headroom and History
Signed utilisation and headroom for every mapped path, at 5-minute detail for 14 days and hourly or daily back to January 2024.
Equation Analysis
Left-hand and right-hand side history and marginal values for individual constraint equations, with the P30 forecast.
Marginal Values
What each binding constraint cost in dispatch, interval by interval, ranked.
Outage Constraint Sets
The network outages that invoke each constraint set, seven days back and 90 days ahead.
Free 5-minute Snapshot
The public Constraint Map shows the latest picture for free. History, equations and marginal values are Pro.
Who It's for
Connection and Development Analysts
Shortlist connection points and see how often the line you would connect to runs close to its constraint limit.
Engineering Consultants
Bring the observed constraint record to a client meeting before the formal study starts.
Asset Owners and Traders
Check which equations bound in a given interval and what they cost.
Included with Pro, US$150/month
Constraint history per line and equation, and marginal values over time, are part of Pro and Enterprise. Analyst (US$75/month) covers the map and network layers. The free Constraint Map shows the latest 5-minute snapshot only.
Know How the Grid Treats a Site
More of the observed record behind a connection point.
Start Free, Upgrade When You Need the Evidence
Analyst US$75 a month · Pro US$150 a month · Annual plans 15% off: US$765 and US$1,530 a year.
Self-serve: pay by card or company invoice, no demo needed · Cancel anytime


