

Docs Menu
Measured Line Flow and Ratings
Network Map reports measured flow and the ratings used in dispatch for about 1,300 transmission lines and transformers, at 5-minute resolution, from the market operator's published dispatch cases. The data is historical, not live: the market operator publishes each month about 2 weeks after month end.
What We Report
For each transmission element (line or transformer) and each 5-minute dispatch interval:
| Figure | Meaning | Label |
|---|---|---|
| Measured flow | The SCADA value the dispatch engine read for the element, in MW or signed MVA | Measured, published by the market operator |
| Rating | The normal and emergency ratings used in dispatch, in MVA | Published by the market operator |
| Headroom | Rating − |flow| | Derived |
| Bands over a window | Average and P1, P5 and P10 of headroom or utilisation | Derived |
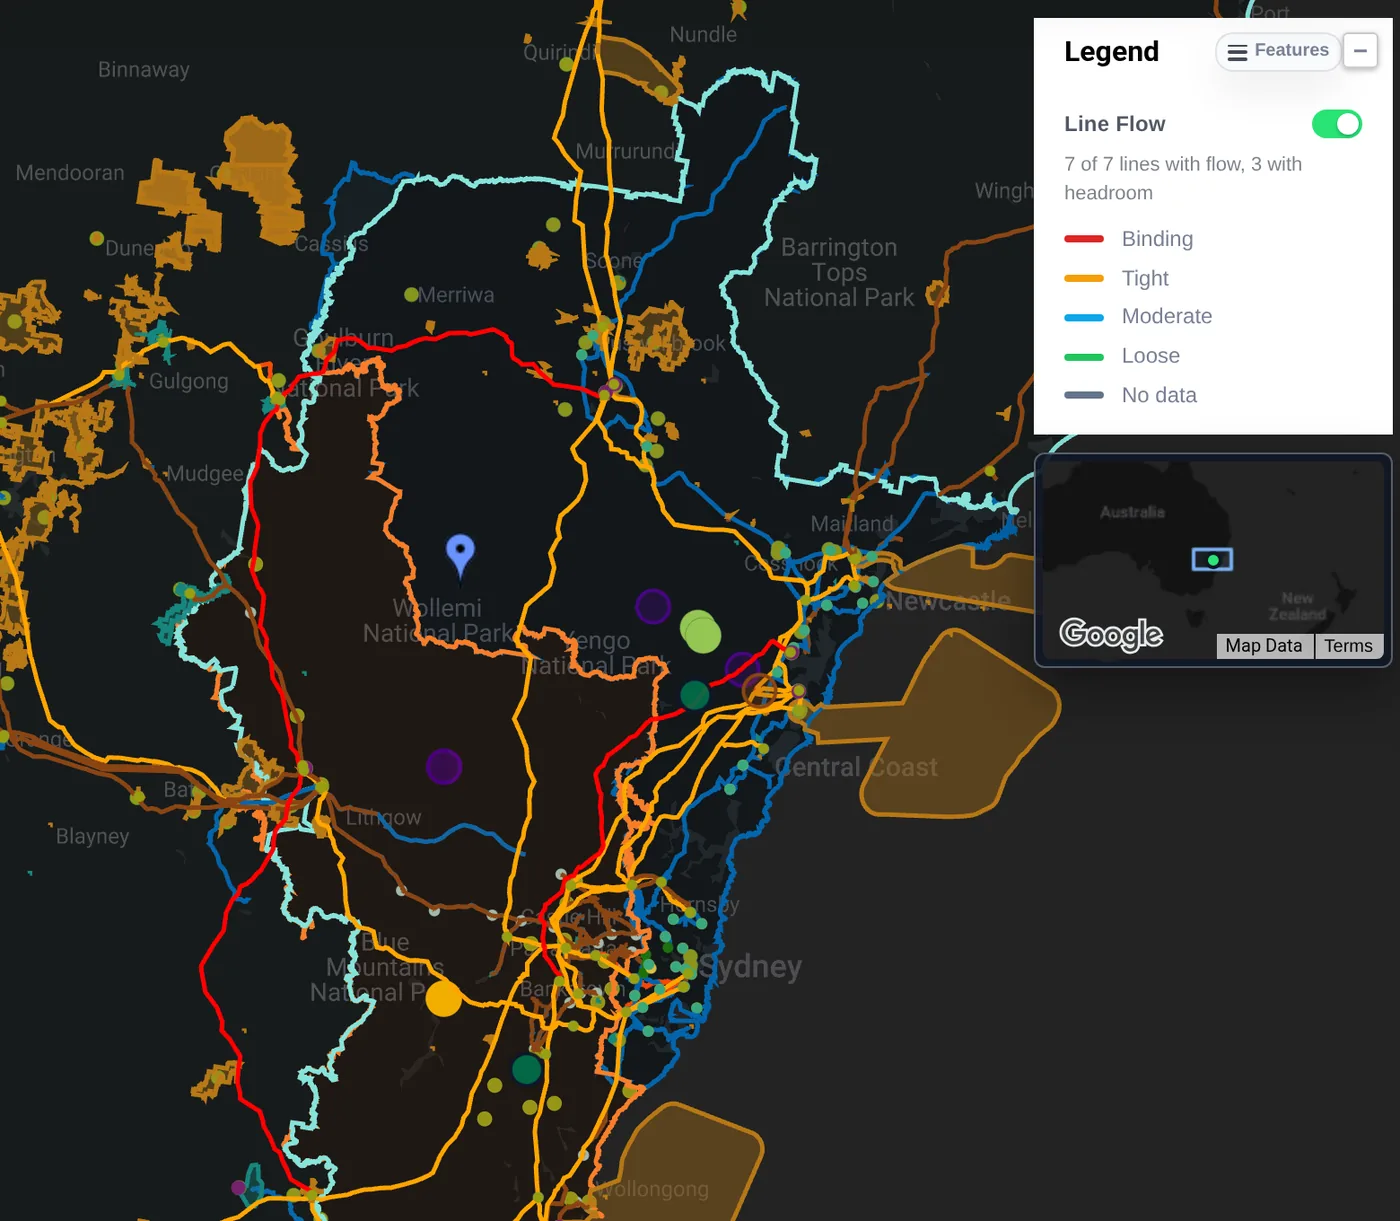
Line Flow on the Map
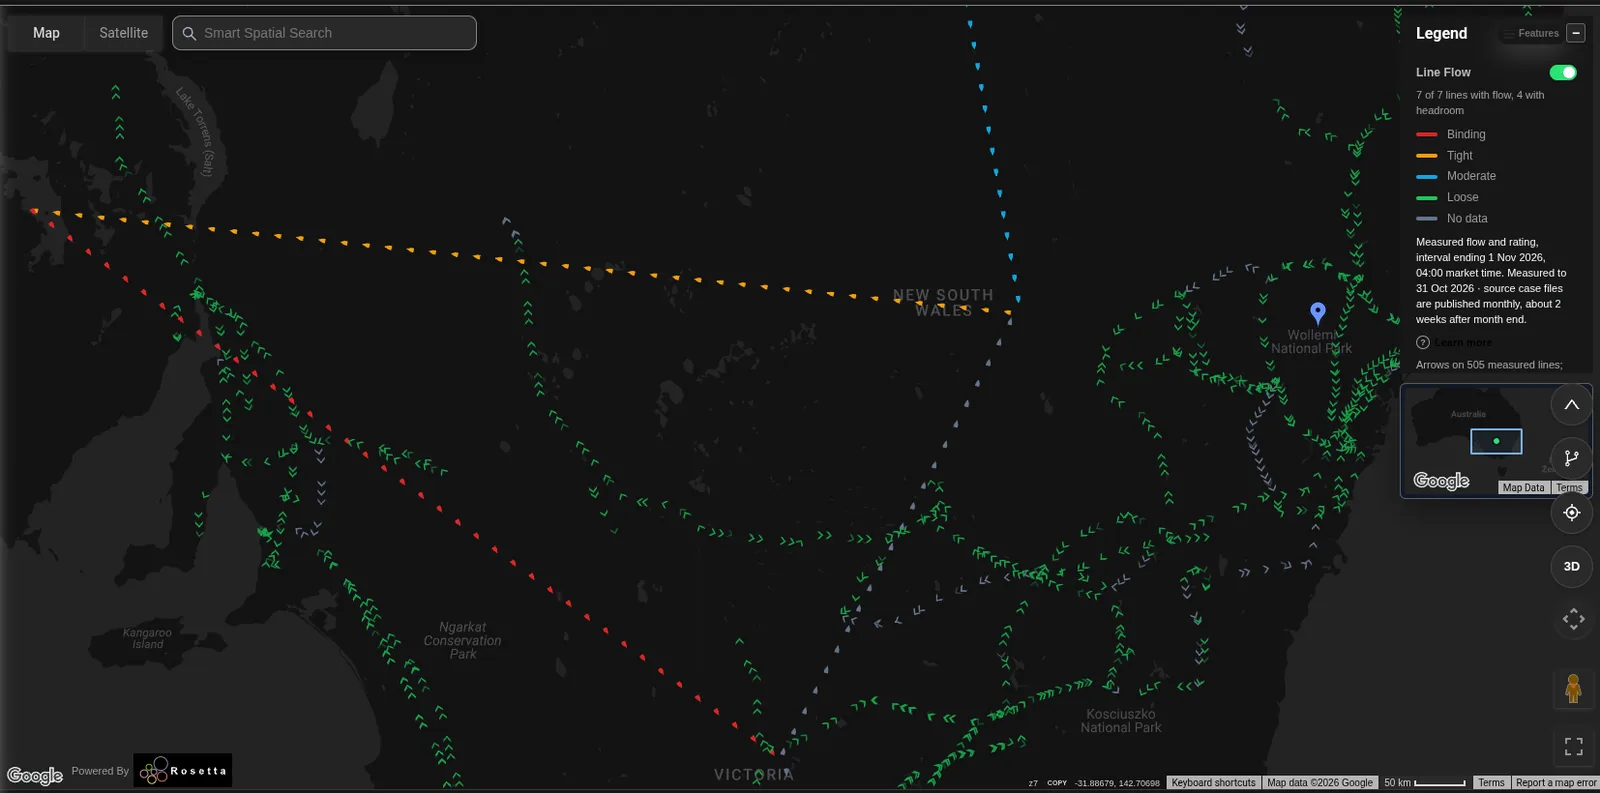
Switch on Show line flow on the map in the sidebar. Arrows move along each measured line. Faster arrows carry more of their rating. Each line is coloured by how much of its rating is left:
- At its limit
- Tight (10% or less left)
- Moderate (10% to 30% left)
- Plenty of room (above 30% left)
- No rating
The legend gives the interval and the date of the newest data, for example Measured to 31 Oct 2026. The source case files are published monthly, about 2 weeks after month end, so the newest data is always some weeks old. Line flow is from AEMO-published data.
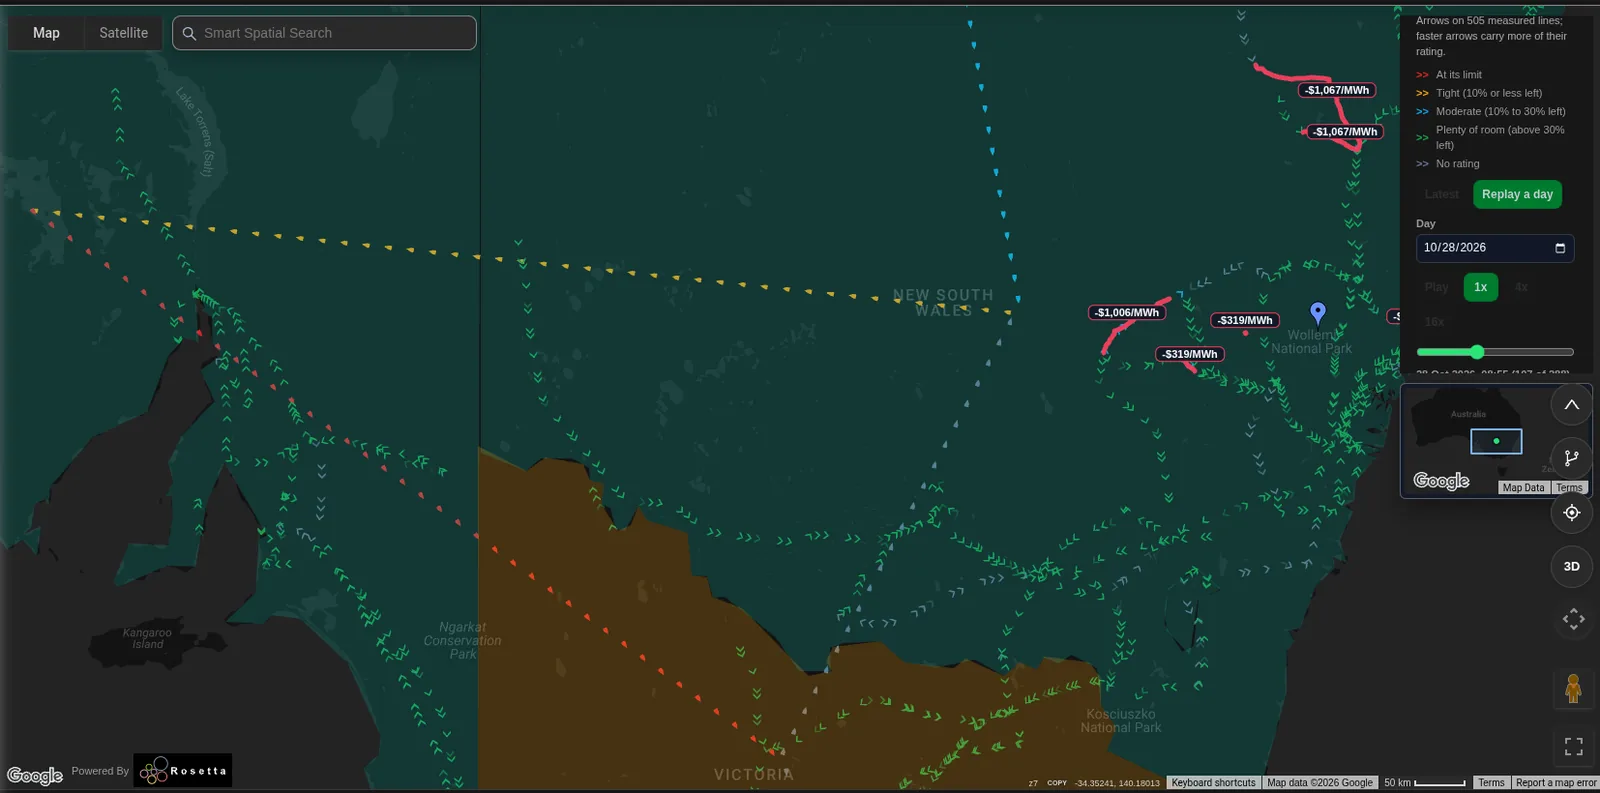
Replay a Day
Choose Latest for the newest interval, or Replay a day to step through one past day. Pick the Day, then use Play and 1x, 4x or 16x. The bar shows the interval, for example 28 Oct 2026, 08:55 (107 of 288). Jump to price event moves to a price event in the day. Panels show regional prices, the binding constraints in the interval, interconnector flow against its limit and the detail of a selected line.
Data Sources
The market operator publishes every dispatch case in a public monthly archive. Each daily file holds 288 dispatch cases. Each case holds the SCADA values the dispatch engine read for that interval, about 11,400 per case:
- Measurements of each element, in MW, MVA or signed MVA.
- Normal, emergency and load-shedding ratings in MVA.
- Quality flags for every value, kept with each point.
Standing ratings and equipment details come from the market operator's network rating and equipment data.
Coverage
| Item | Value |
|---|---|
| Elements per case | 1,382 lines and transformers; about 1,300 with a flow value and about 1,200 with a rating |
| Stable element set | 1,061 elements report in every period from January 2022 to September 2026 |
| Data quality | Over 98% of values pass the quality checks |
| Resolution | 5-minute detail for the last 90 days, with 30-minute mean, minimum and maximum for the full history |
| Updates | The market operator publishes each month about 2 weeks after month end. Network Map loads it then. The data is historical, not live. |
Rules
- Sign convention: positive means flow out of the reporting substation into the line. Both ends of a line usually report, with opposite signs.
- Units: each value is reported in the unit it was published in. Ratings are in MVA.
- Quality: values flagged as not good, or older than 1 hour, are kept with their flag and left out of bands.
- Ratings: the ratings are the ones the dispatch engine applied, so headroom reflects the limits used to run the market.
- Line matching: each map line is matched to the market operator's equipment by circuit number, voltage and end-substation names, and each match carries a confidence level.


