US Aggregate brings the US ISO/RTO markets together so you can compare demand, generation and reference prices across them.
▶ Watch the Video: International Markets & US Aggregate (1:17)
Open Markets in the product switcher, pick the market, then the view from the left-hand menu. See the Network Map Markets Guide for the common controls and plan access.
Views
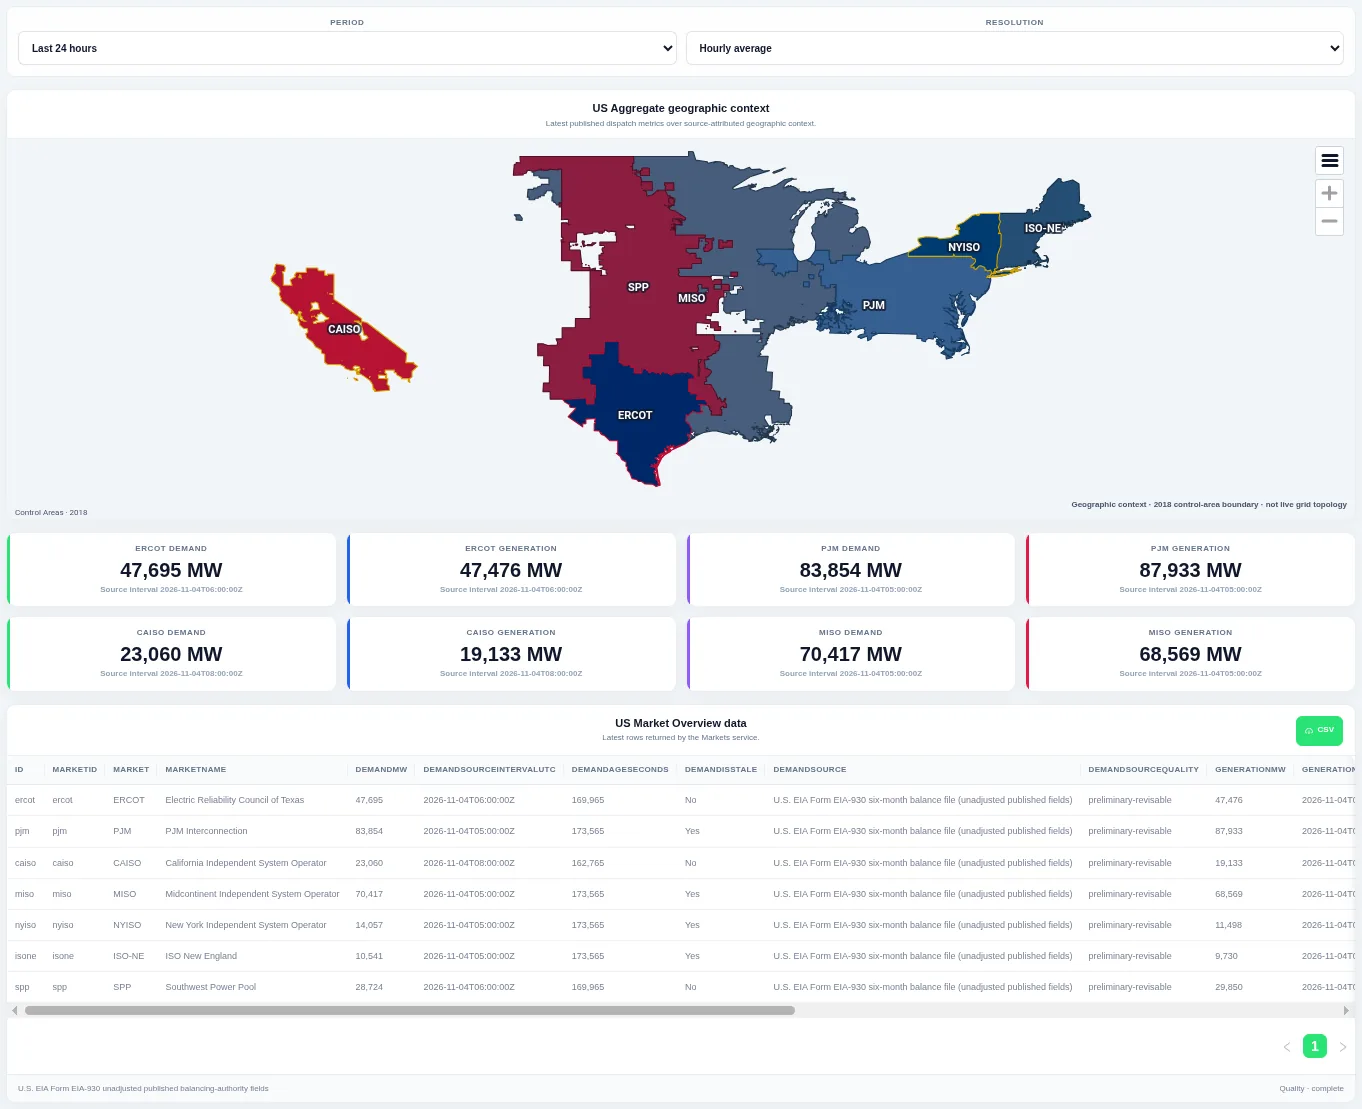
US Market Overview
A map of the tracked US ISO/RTO areas with the latest demand and generation for each market.
A geographic map of every tracked ISO/RTO, cards with the latest published demand and generation for each market, and a table of source intervals, data age and staleness flags. Choose the period and resolution at the top; the table can be downloaded as CSV.
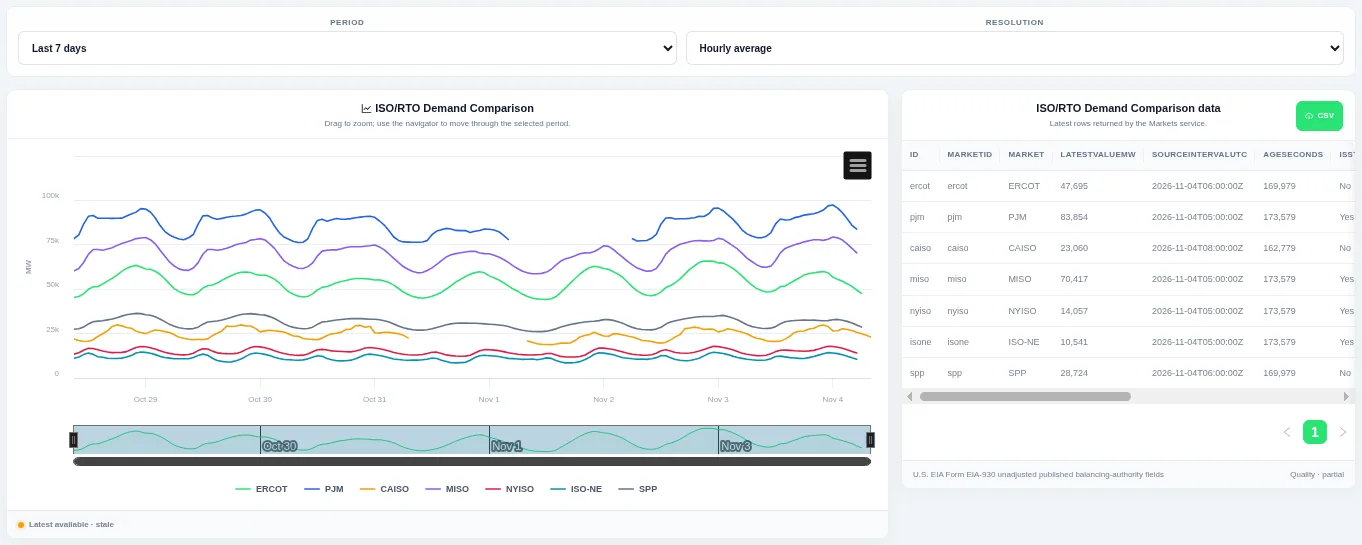
ISO/RTO Demand Comparison
Hourly demand for each tracked US ISO/RTO on one chart.
One line per market so you can compare demand levels and daily shapes across the US. Choose the period and resolution at the top, drag on the chart or the navigator to zoom, and use the table for source intervals and a CSV download.
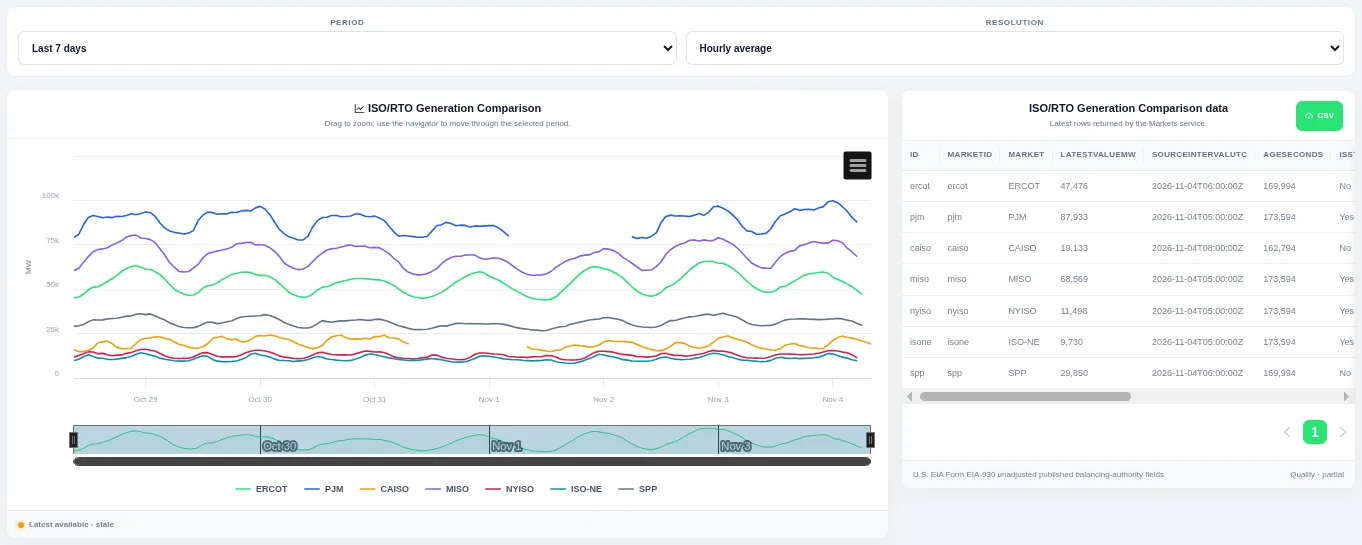
ISO/RTO Generation Comparison
Hourly generation for each tracked US ISO/RTO on one chart.
One line per market so you can compare generation levels and daily shapes across the US. Choose the period and resolution at the top, drag on the chart or the navigator to zoom, and use the table for source intervals and a CSV download.
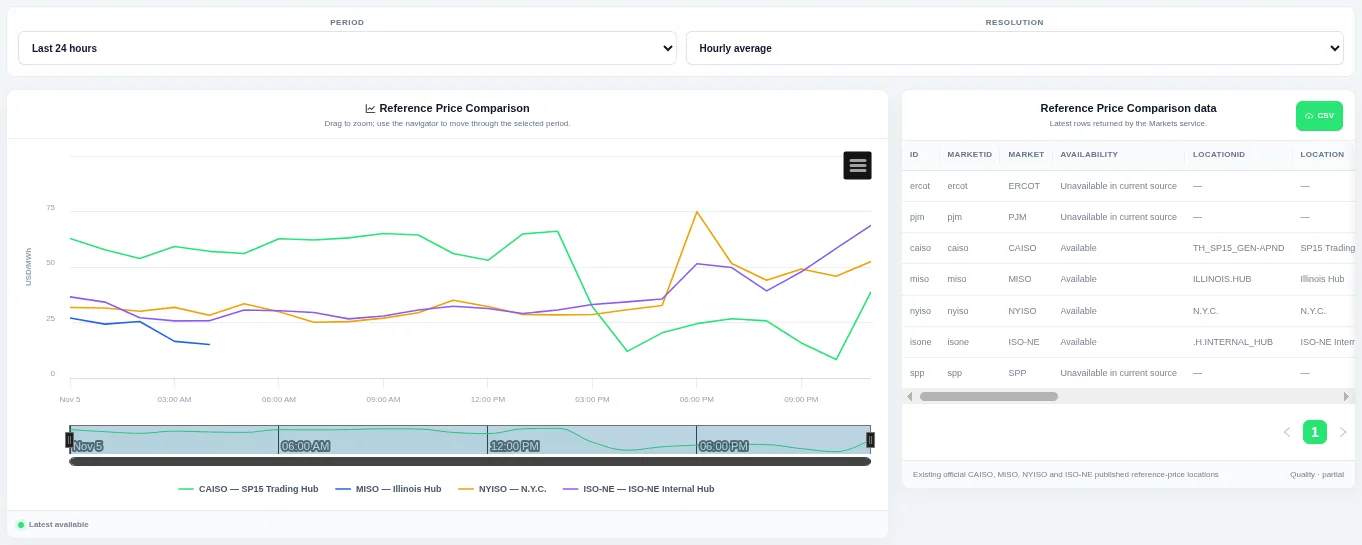
Reference Price Comparison
Published reference hub prices for the US markets that expose one, on one chart.
Each line is one market reference location, and the table marks markets whose source has no reference price as unavailable rather than zero. Choose the period and resolution at the top and drag to zoom.
Nodal Price Map
A map of nodal prices across the US markets, coloured by price for the selected interval. Choose the interval and price component at the top.