

Docs Menu
East Coast Supply and Demand
These views show who is generating, how units and stations are running, how offers are stacked and how demand is changing.
Open any view from Markets in the product switcher, then pick the market and the view from the left-hand menu. See the Network Map Markets Guide for the common controls and plan access.
Views
NEM Generation
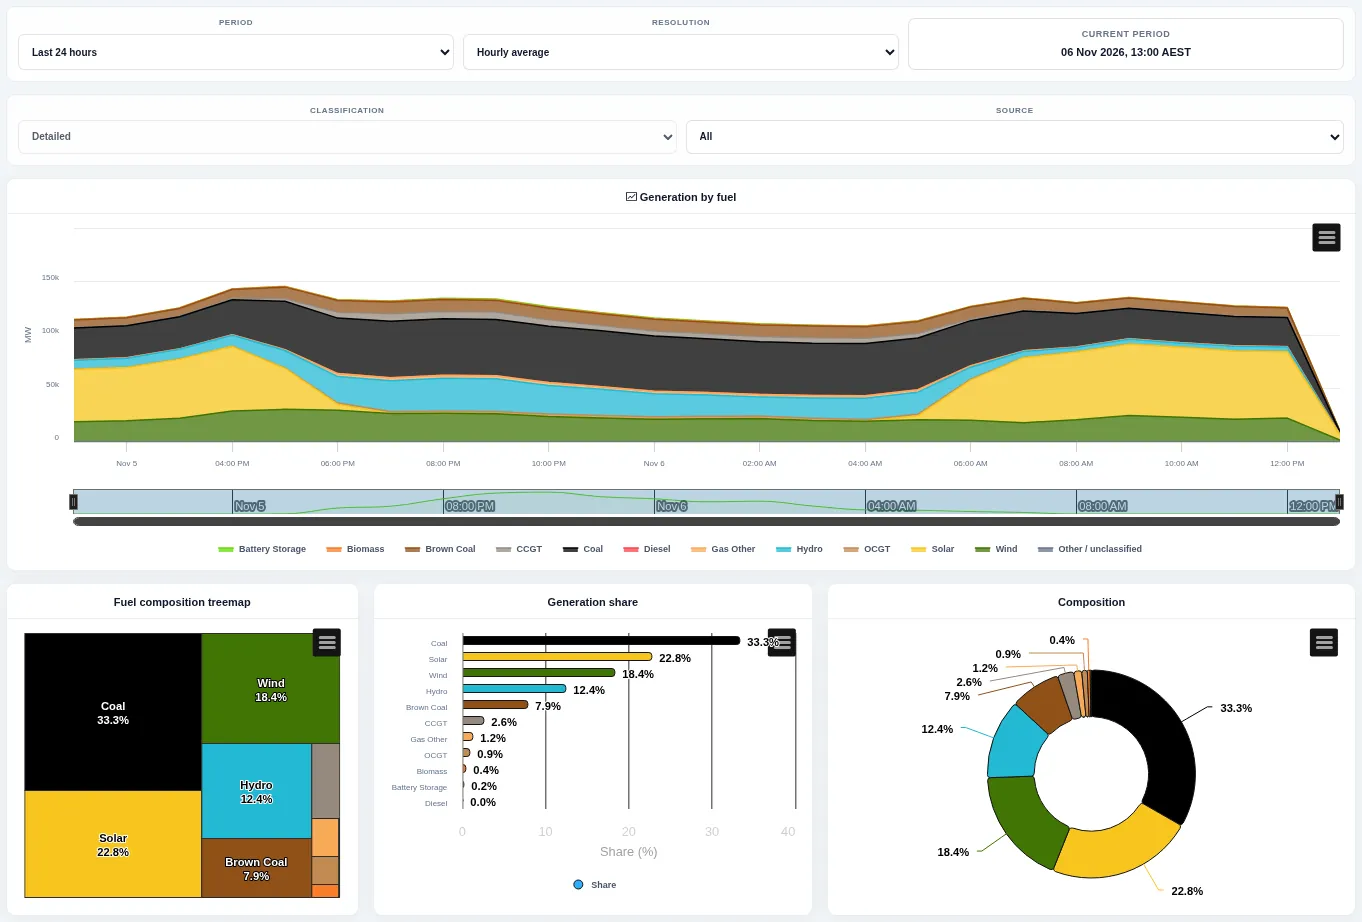
A stacked area chart of generation by fuel, with a fuel mix treemap and share chart below. Change the period and resolution.
Generators
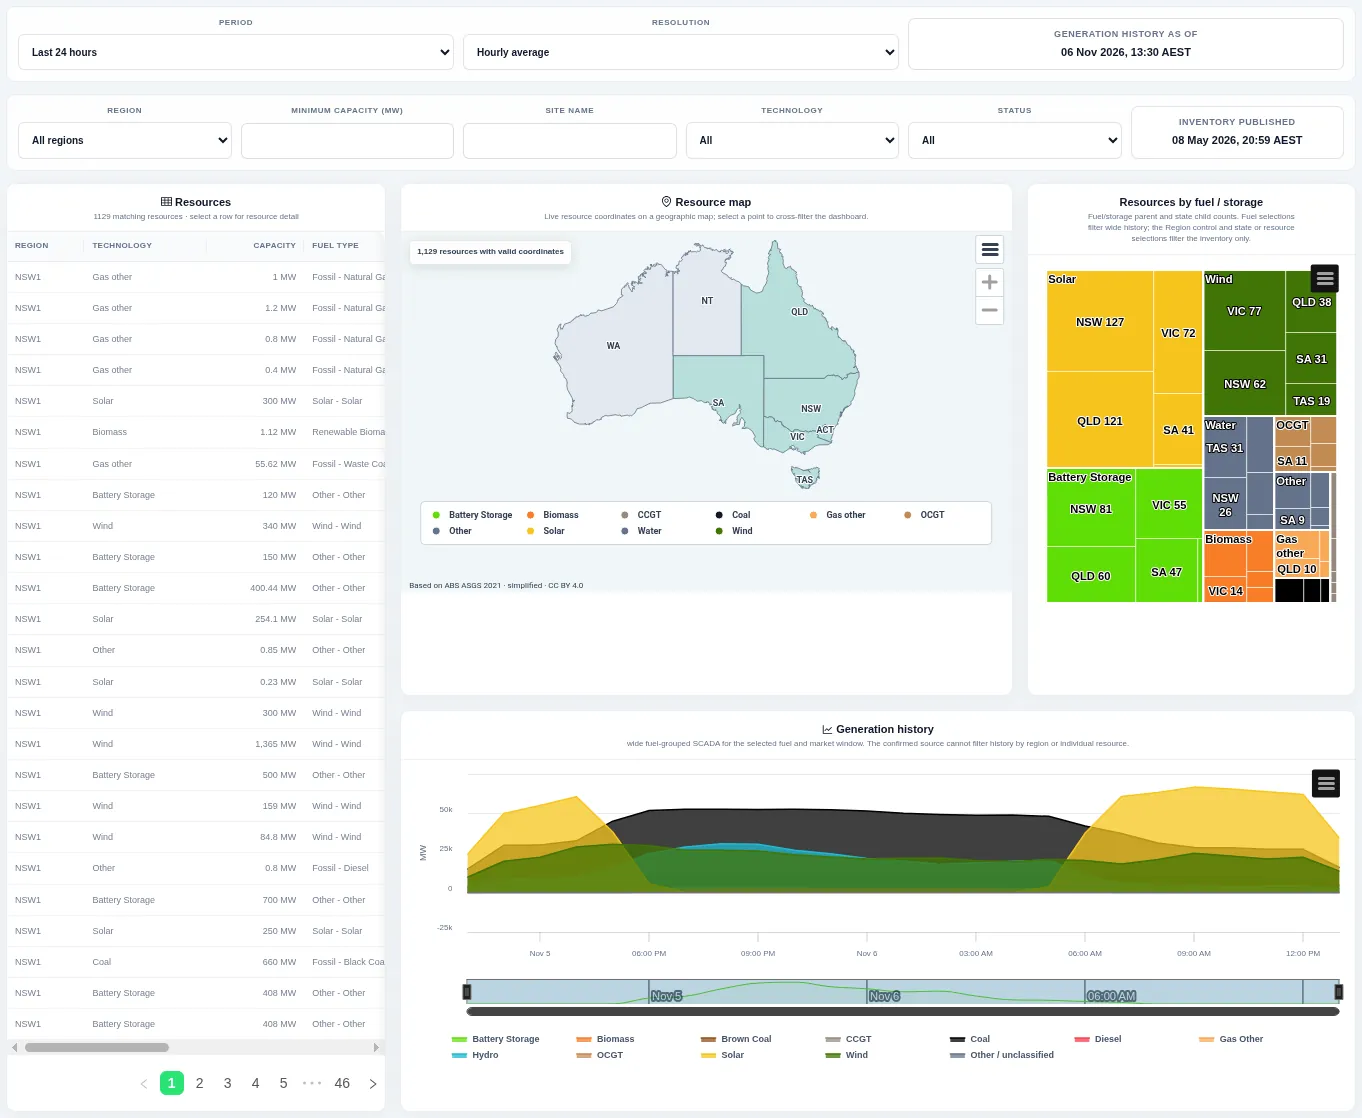
A searchable list of generating resources with region, technology and capacity, a map of their locations, a treemap of counts by fuel and a generation history chart. Filter by region, minimum capacity, technology and status; selecting a row or a point filters the rest of the page.
Unit Output Changes
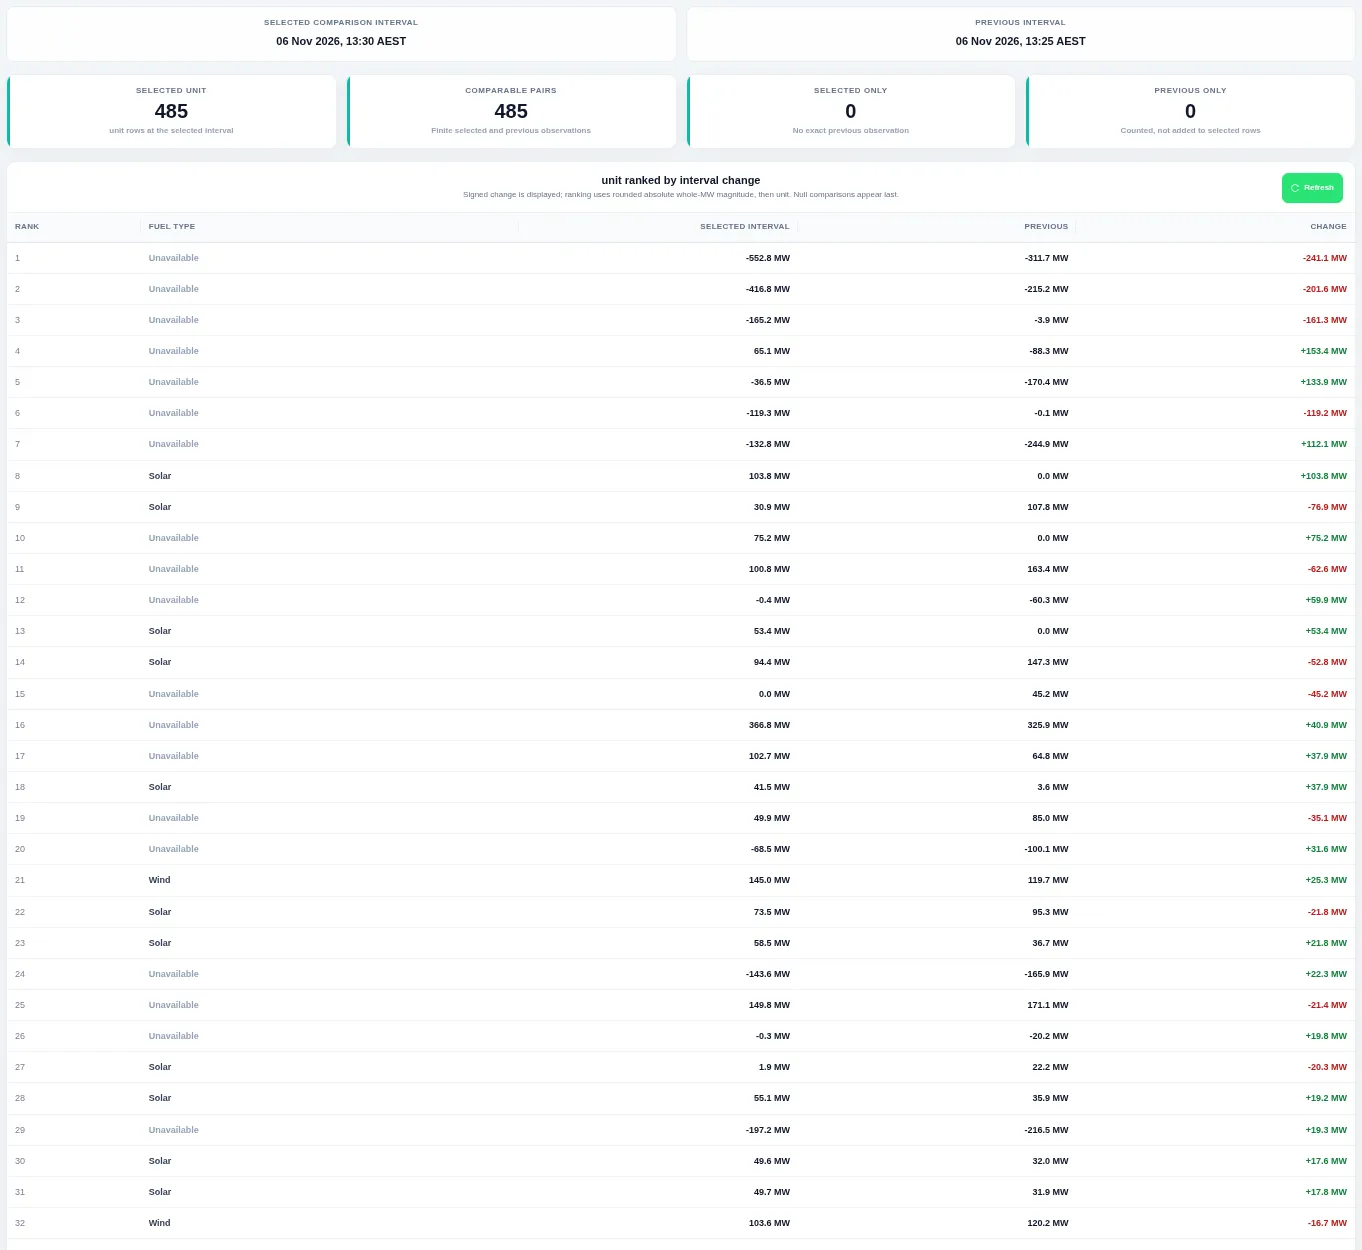
Summary cards count the comparable units, and the table ranks every unit by the size of its change in output since the previous five-minute interval. The view refreshes automatically; the change column is green for increases and red for decreases.
Fleet Status
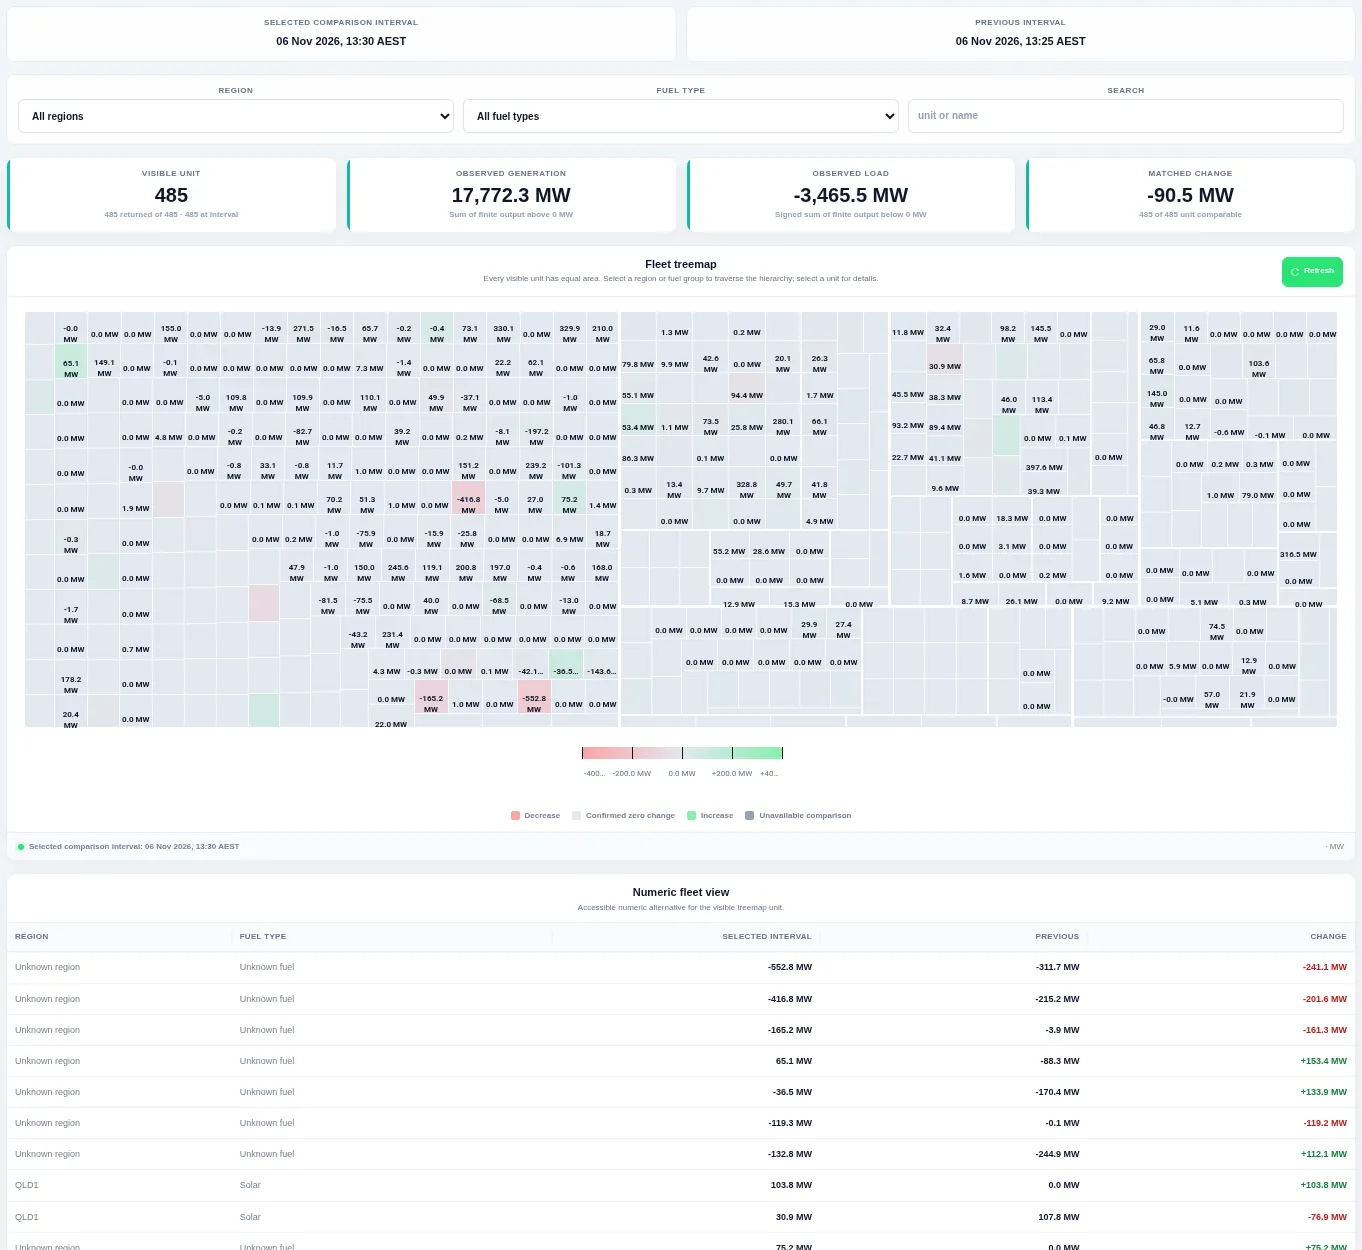
Every unit is one equal-sized tile, grouped by region and fuel, coloured by its five-minute change: green for an increase, red for a decrease, pale for no change. Filter by region and fuel type or search; a numeric table repeats the treemap values below.
Unit Operations
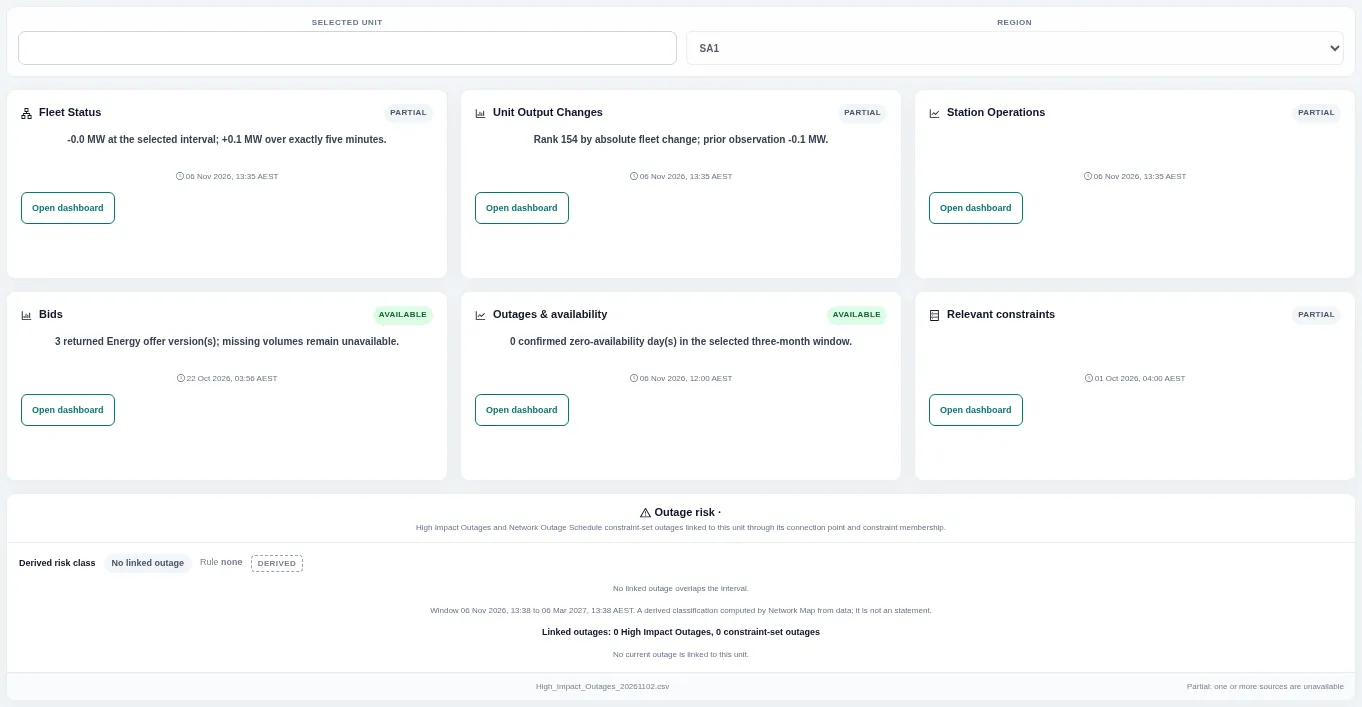
Cards summarise one unit's fleet status, output change, station operations, bids, outages and relevant constraints, each with a link to the full view, followed by an outage risk panel. Enter a unit and region at the top.
Station Operations
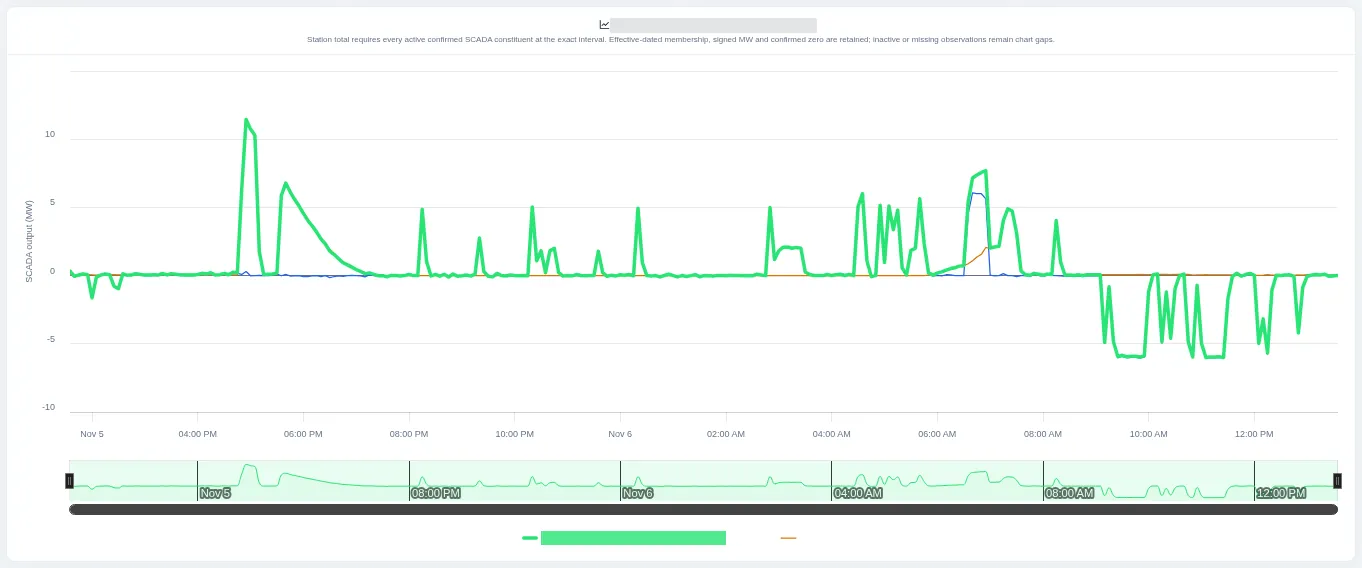
The chart shows the station total and the output of each of its units over the last day. Choose the region and station at the top; the station total is shown only where every unit has a reading.
Regional Network Overview
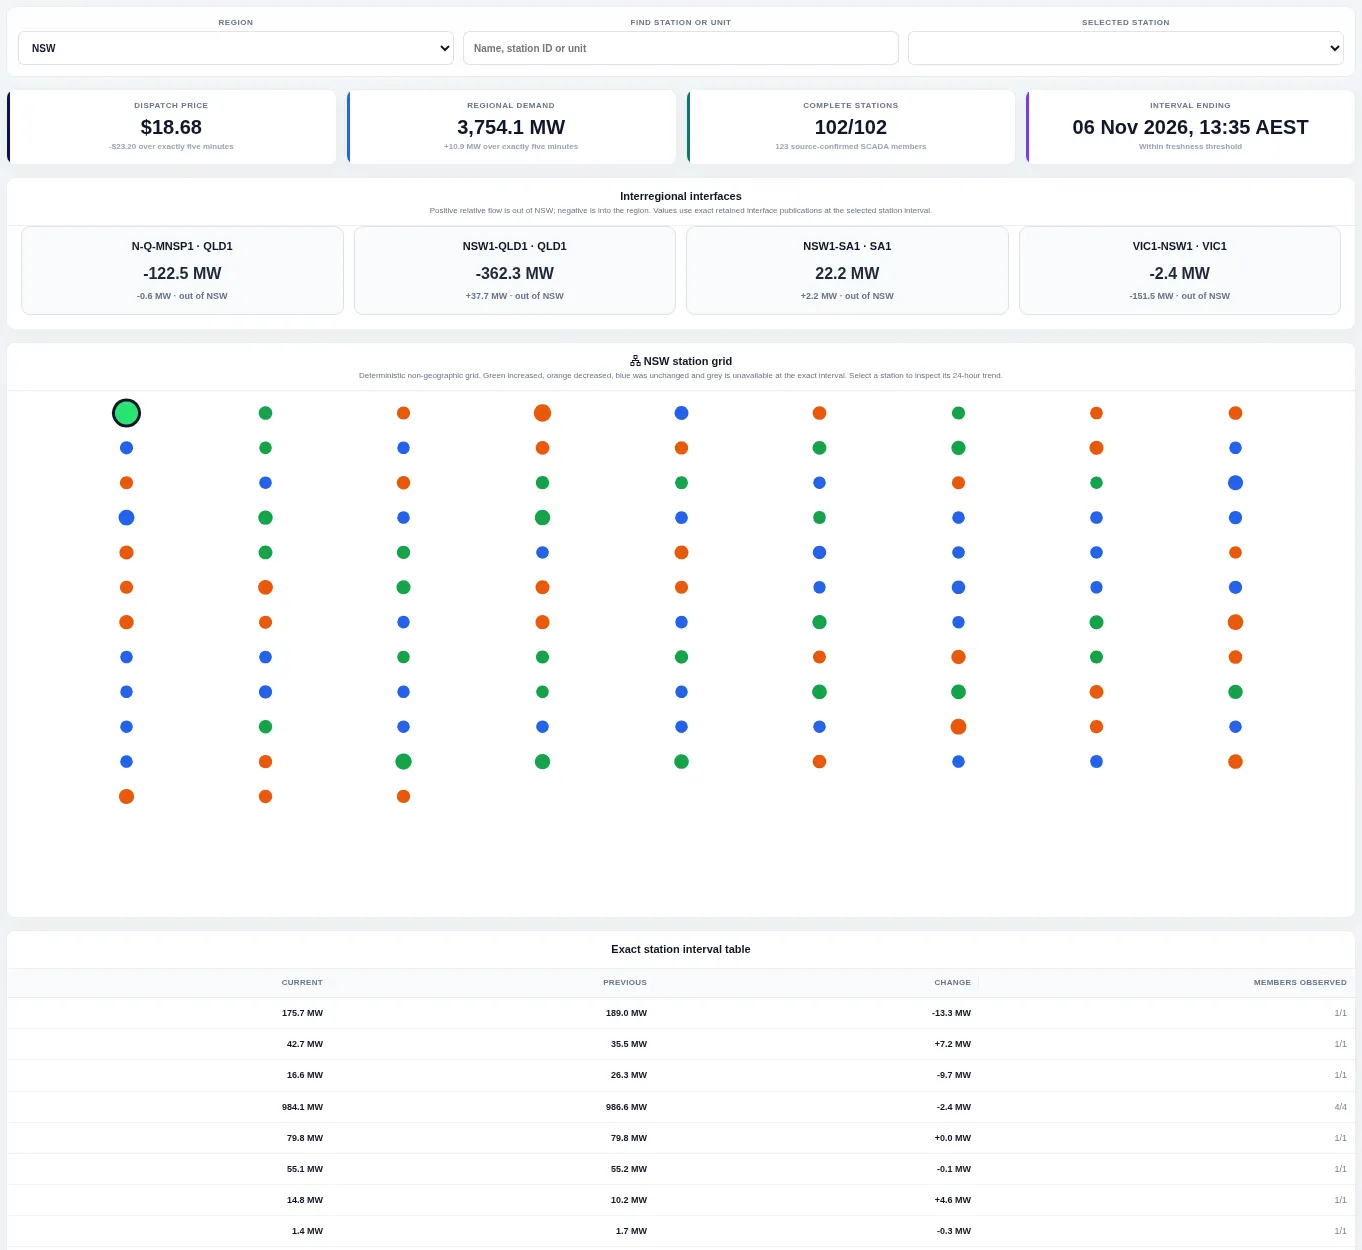
Headline cards give the region's price and demand, interconnector cards show flows in and out, and a grid of dots shows each station coloured by whether its output went up, down or stayed the same. Choose the region and a station; the table below lists current and previous output.
NEM Outages
Shows unit outages: units offered at zero availability. It does not show network outages.
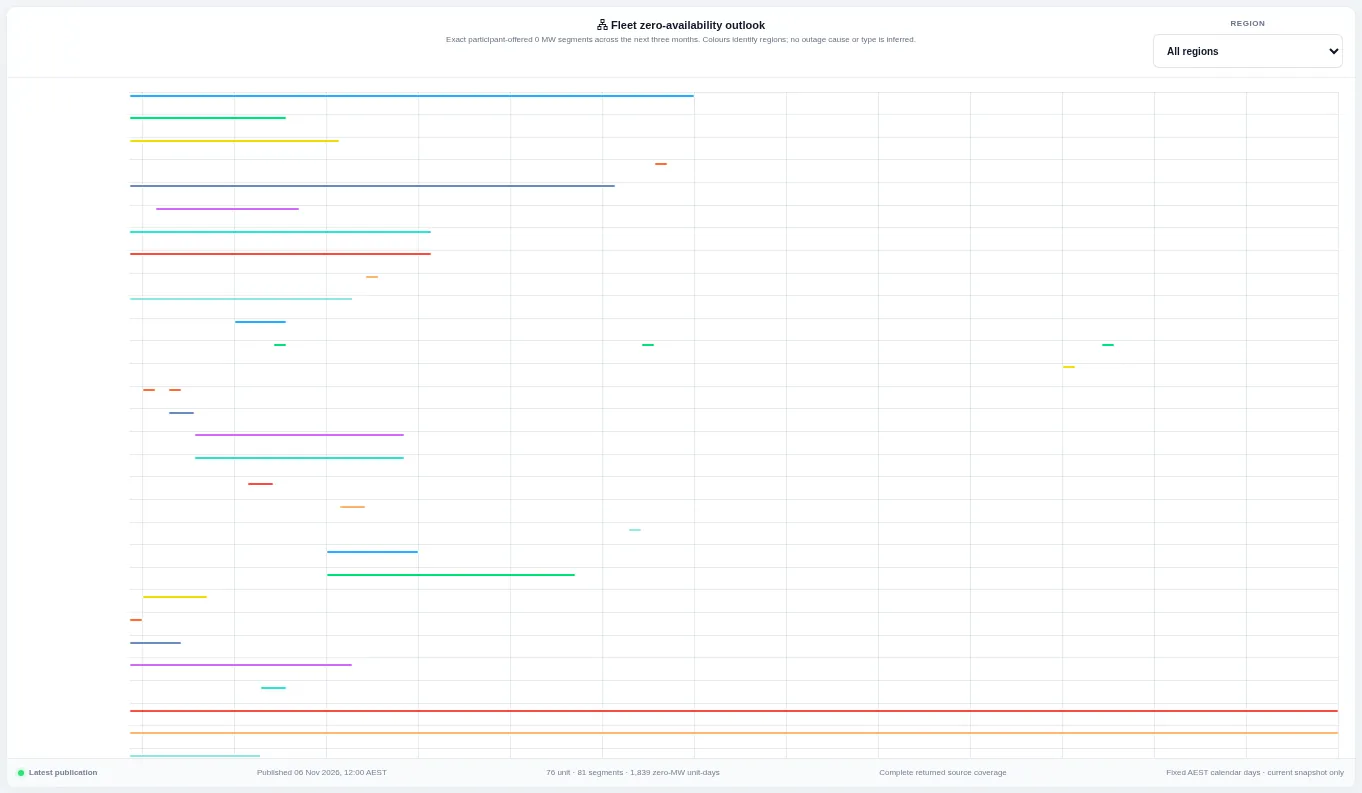
Each line is a period in the next three months when a unit is offered at zero megawatts, coloured by region. Filter by region; the view uses offered availability and does not infer the cause of an outage.
Generator Output Heatmap
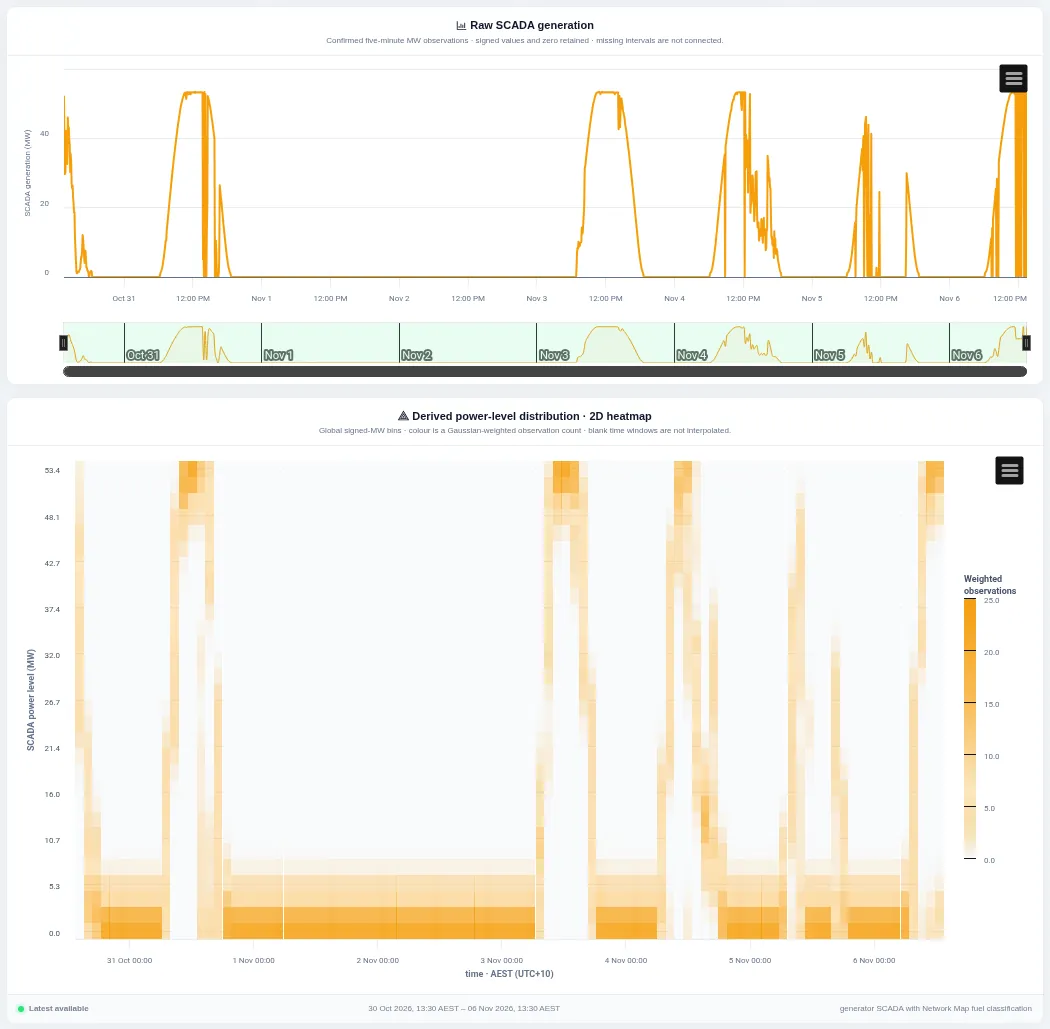
The top chart shows the unit's measured output; the heatmap below shows how often it ran at each power level in each time window, with darker cells meaning more time spent there. Pick the unit, period, resolution and number of bins.
Bid History
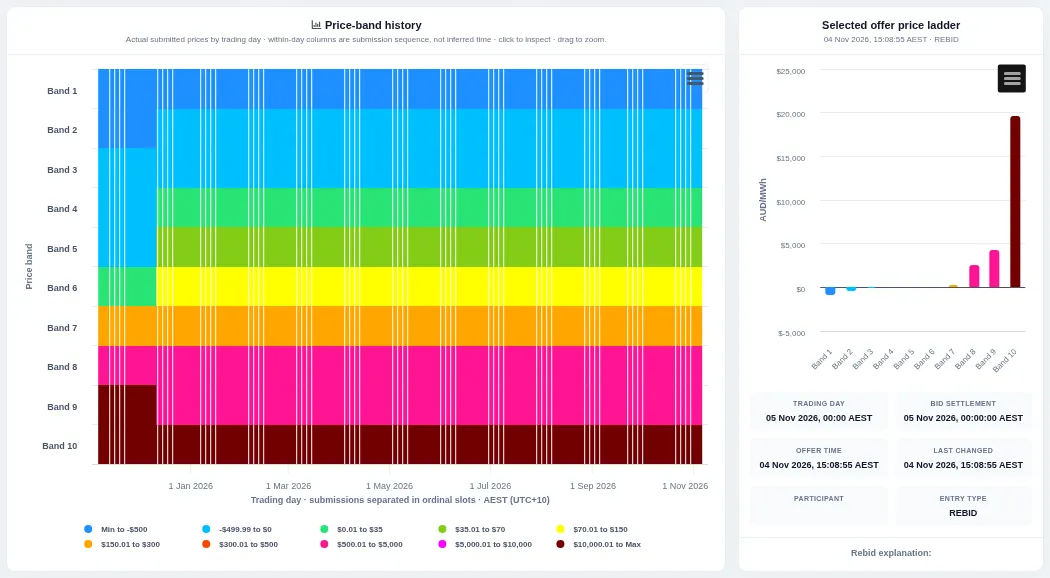
The heatmap shows the price of each of the ten bid bands for every submission across the period; the bar chart on the right shows the price ladder for the selected submission. Choose the unit, bid product and period; click a submission to update the ladder.
Price Setter Components
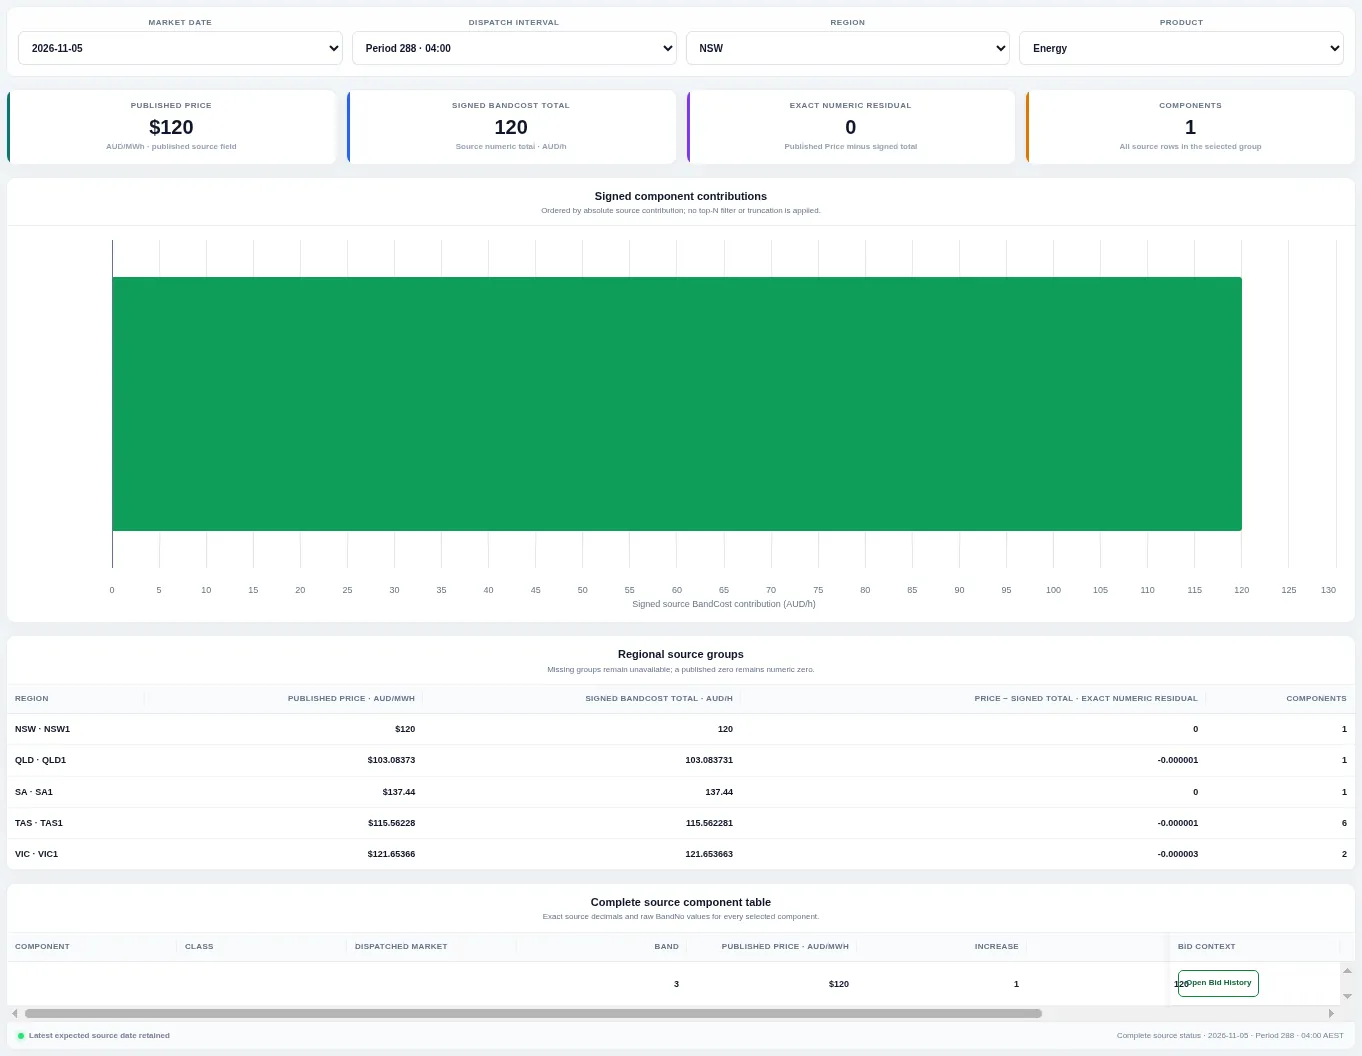
Bars show each component's signed contribution to the published price for the chosen region, product and interval; tables list the totals for every region and every component. Change the market date, dispatch interval, region and product.
Regional Energy Merit Order
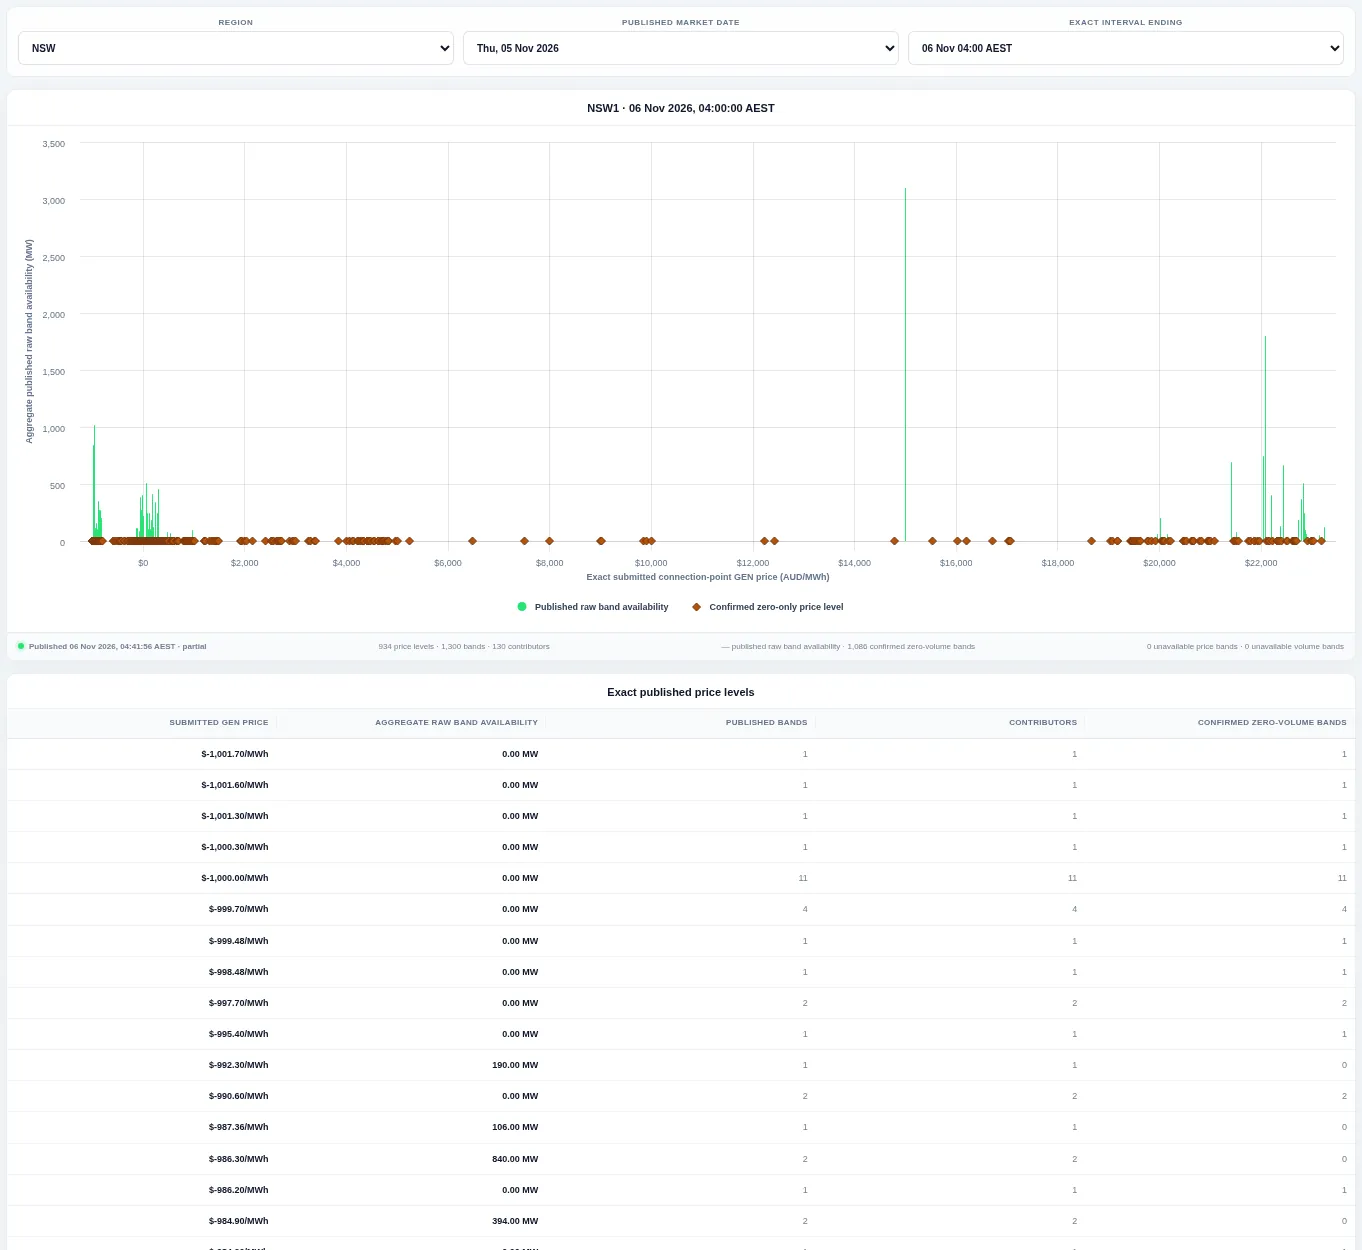
Offered energy is stacked from the lowest to the highest price to form a supply curve for one region and interval, with a table of bands below. Choose the region, market date and interval.
Regional FCAS Offer Stack
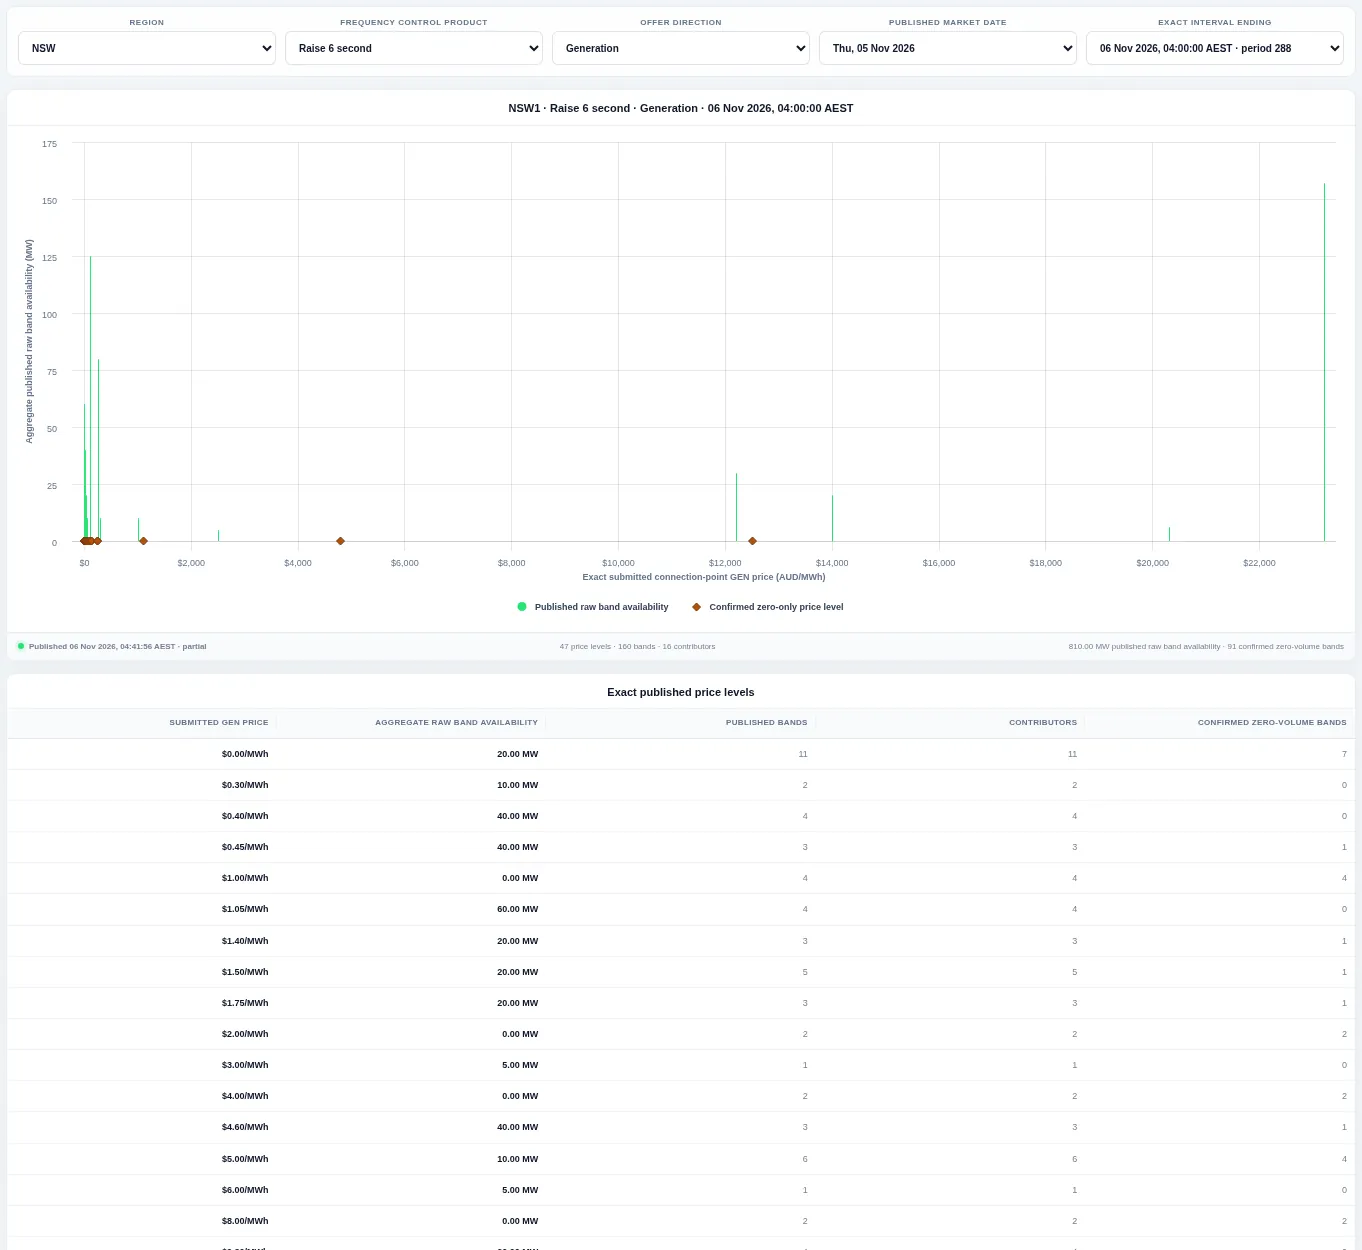
The same supply curve for one frequency control ancillary service (FCAS) product and direction. Choose the region, product, direction, market date and interval.
FCAS Offer Progression
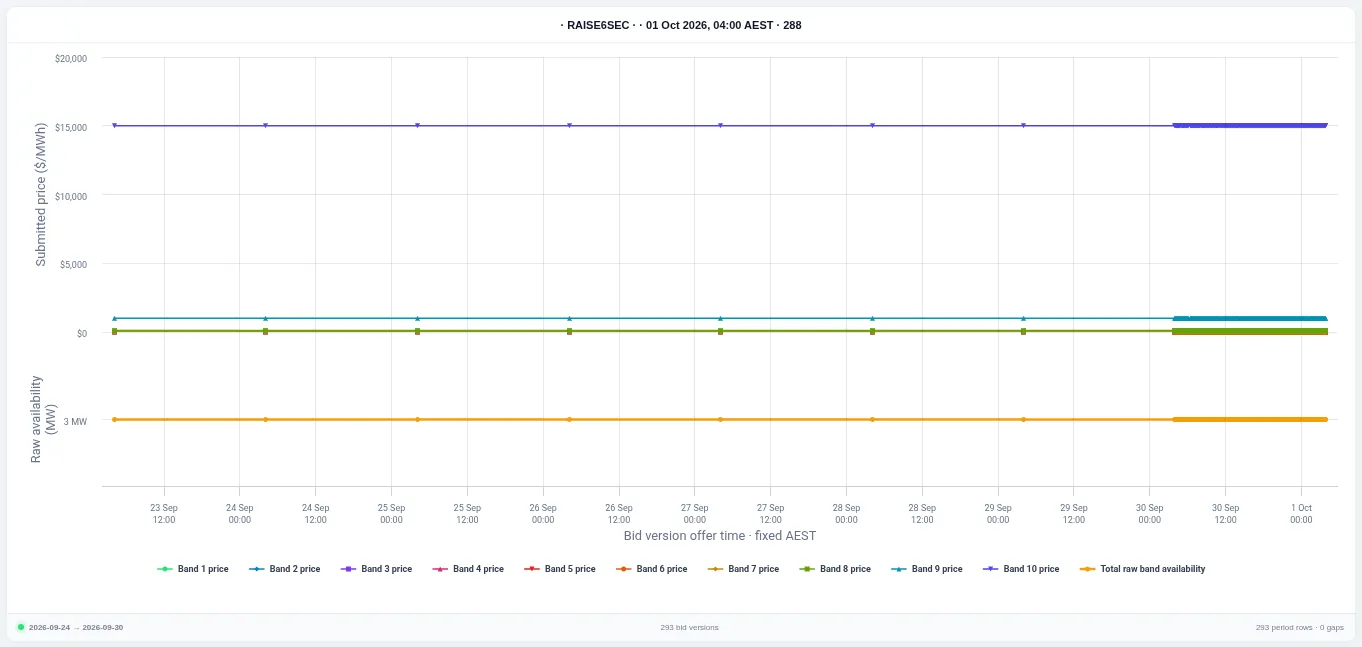
Lines show the price of each band and the total offered availability for every bid version leading up to the chosen interval. Choose the unit, product, direction, market date and interval; the table lists each version and its rebid reason.
Applied Bid Progression
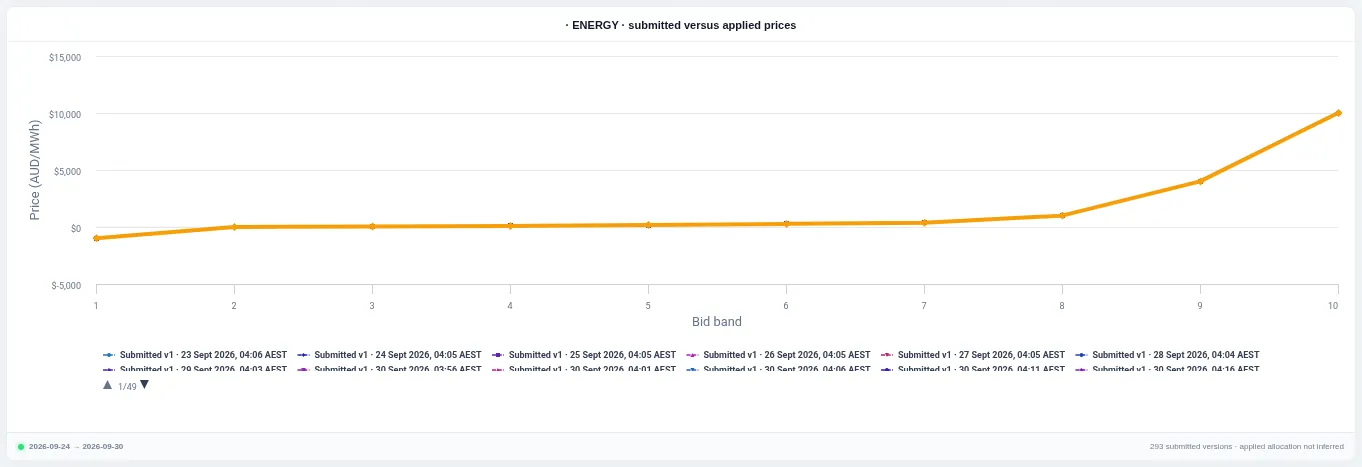
Each line is one bid version's price across the ten bands, so changes between versions are easy to spot. Choose the unit, product, direction, market date and interval; page through the legend to show or hide versions.
Selected-Interval Bid Stack
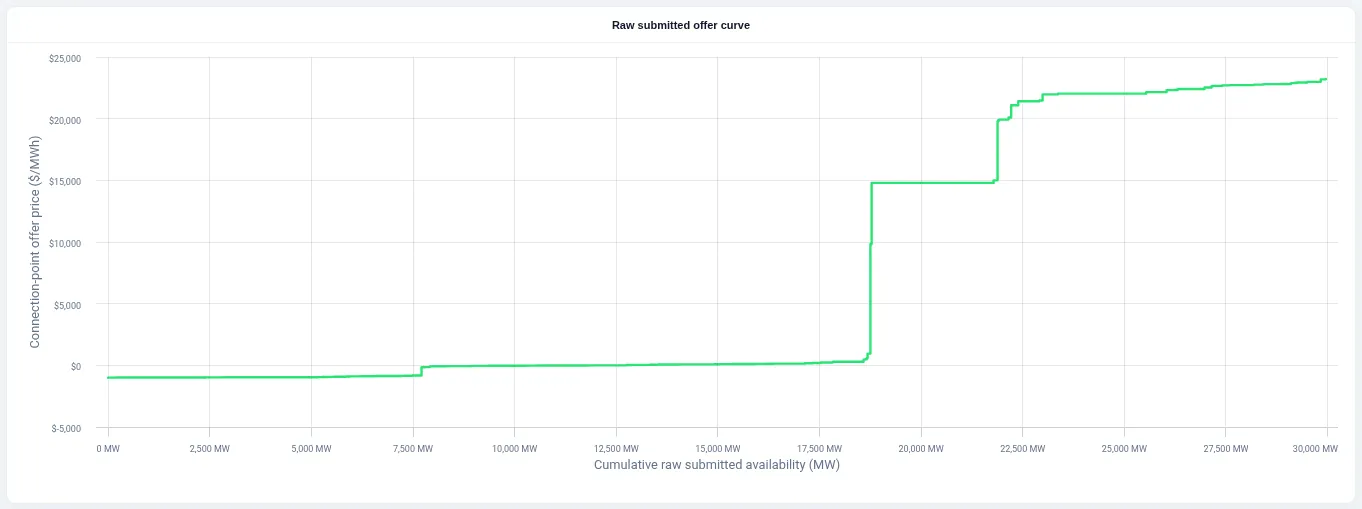
All submitted offers for the chosen region, product and direction are stacked by price into one curve for a single interval. Change the region, product, direction, market date and interval.
Regional Load Bid Stack
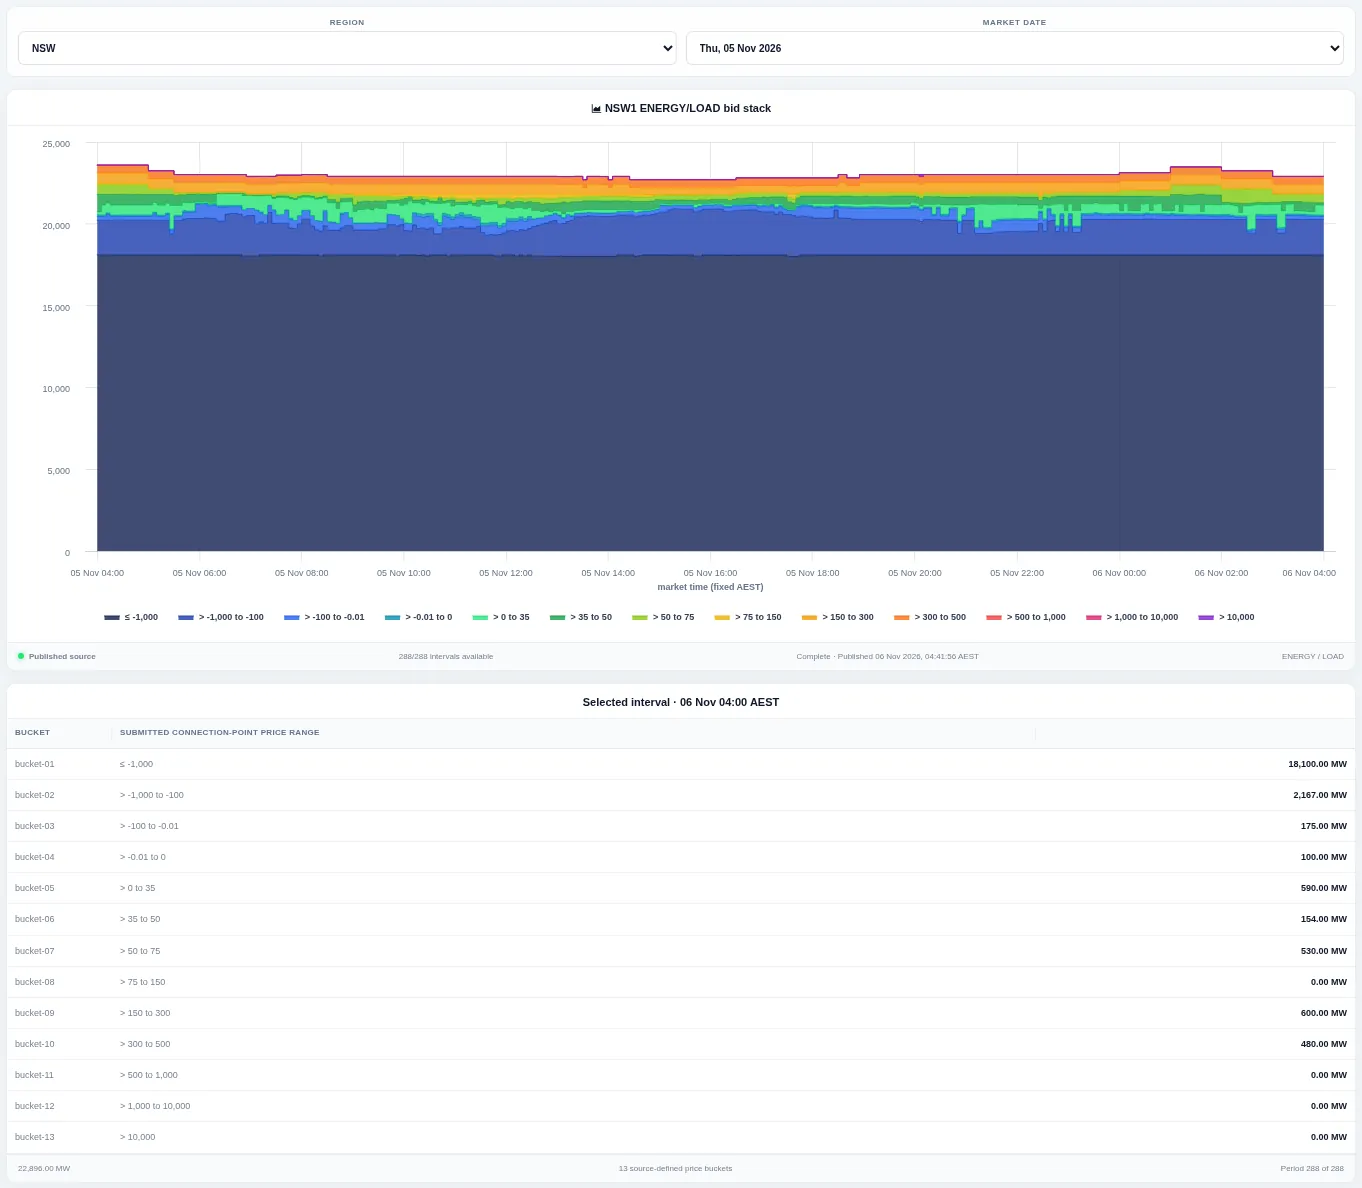
A stacked chart shows how much load was bid in each price bucket for every interval of the day, with a table below. Choose the region and market date.
Operational Demand
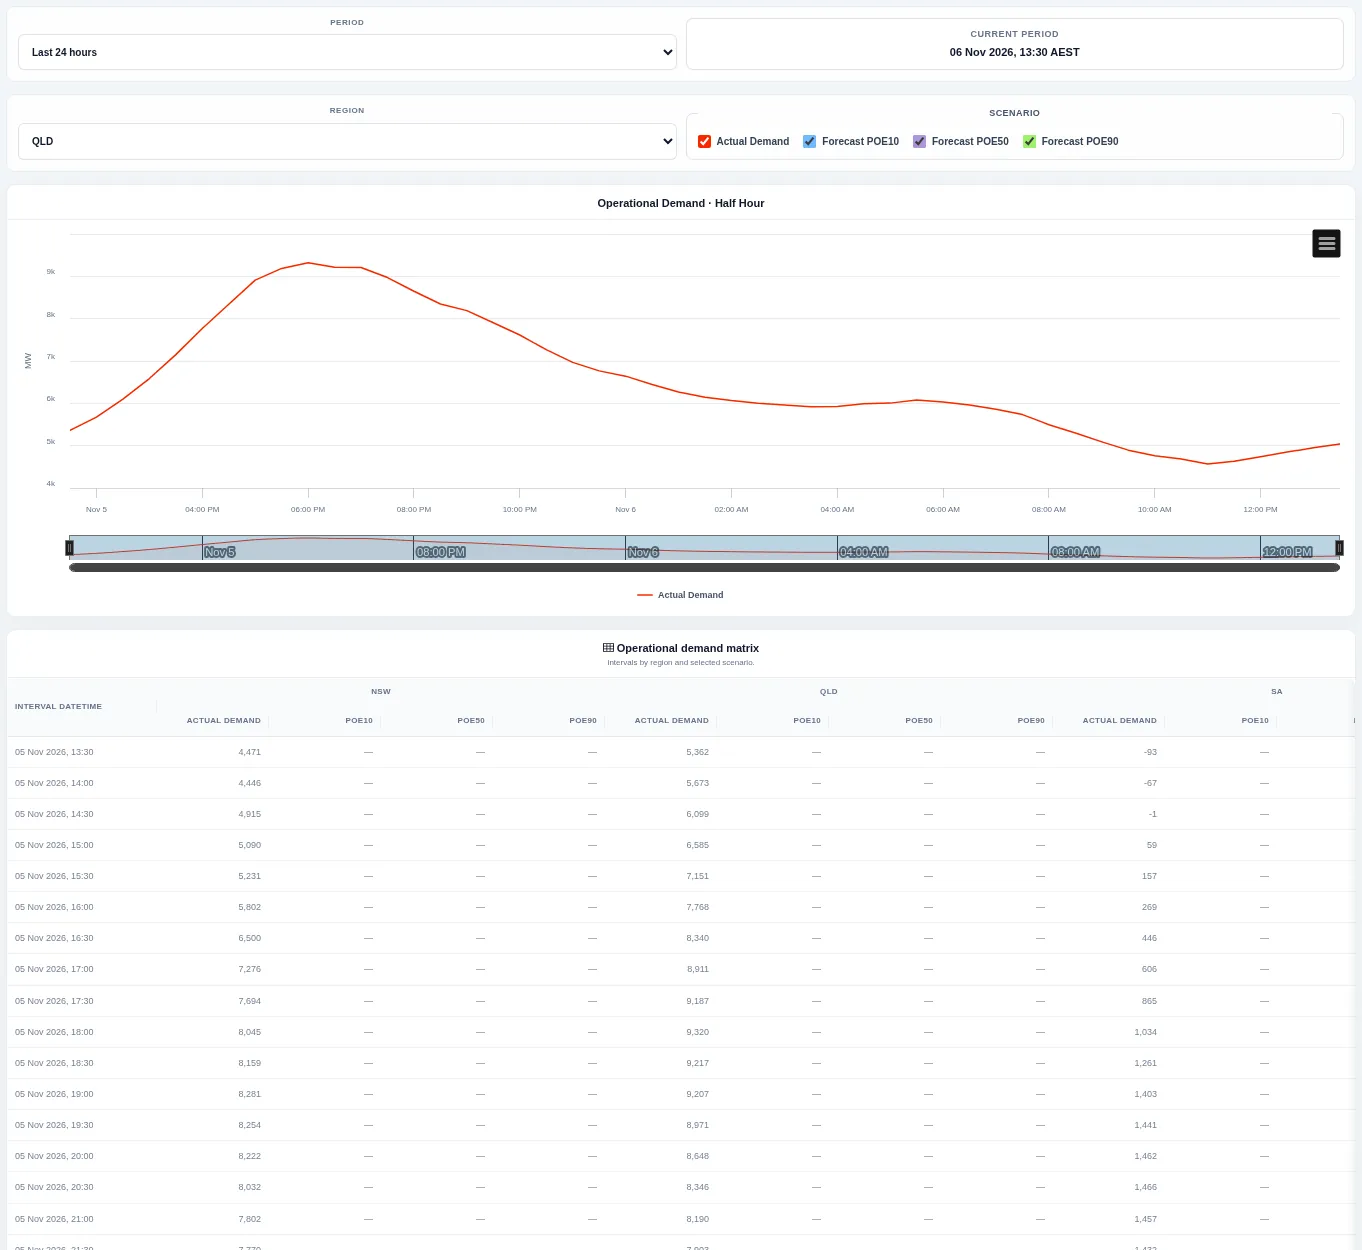
Half-hour operational demand actuals are shown with the forecast scenarios that have a ten, fifty and ninety per cent chance of being exceeded. Change the period and region; the table lists each interval.
FCAS Prices
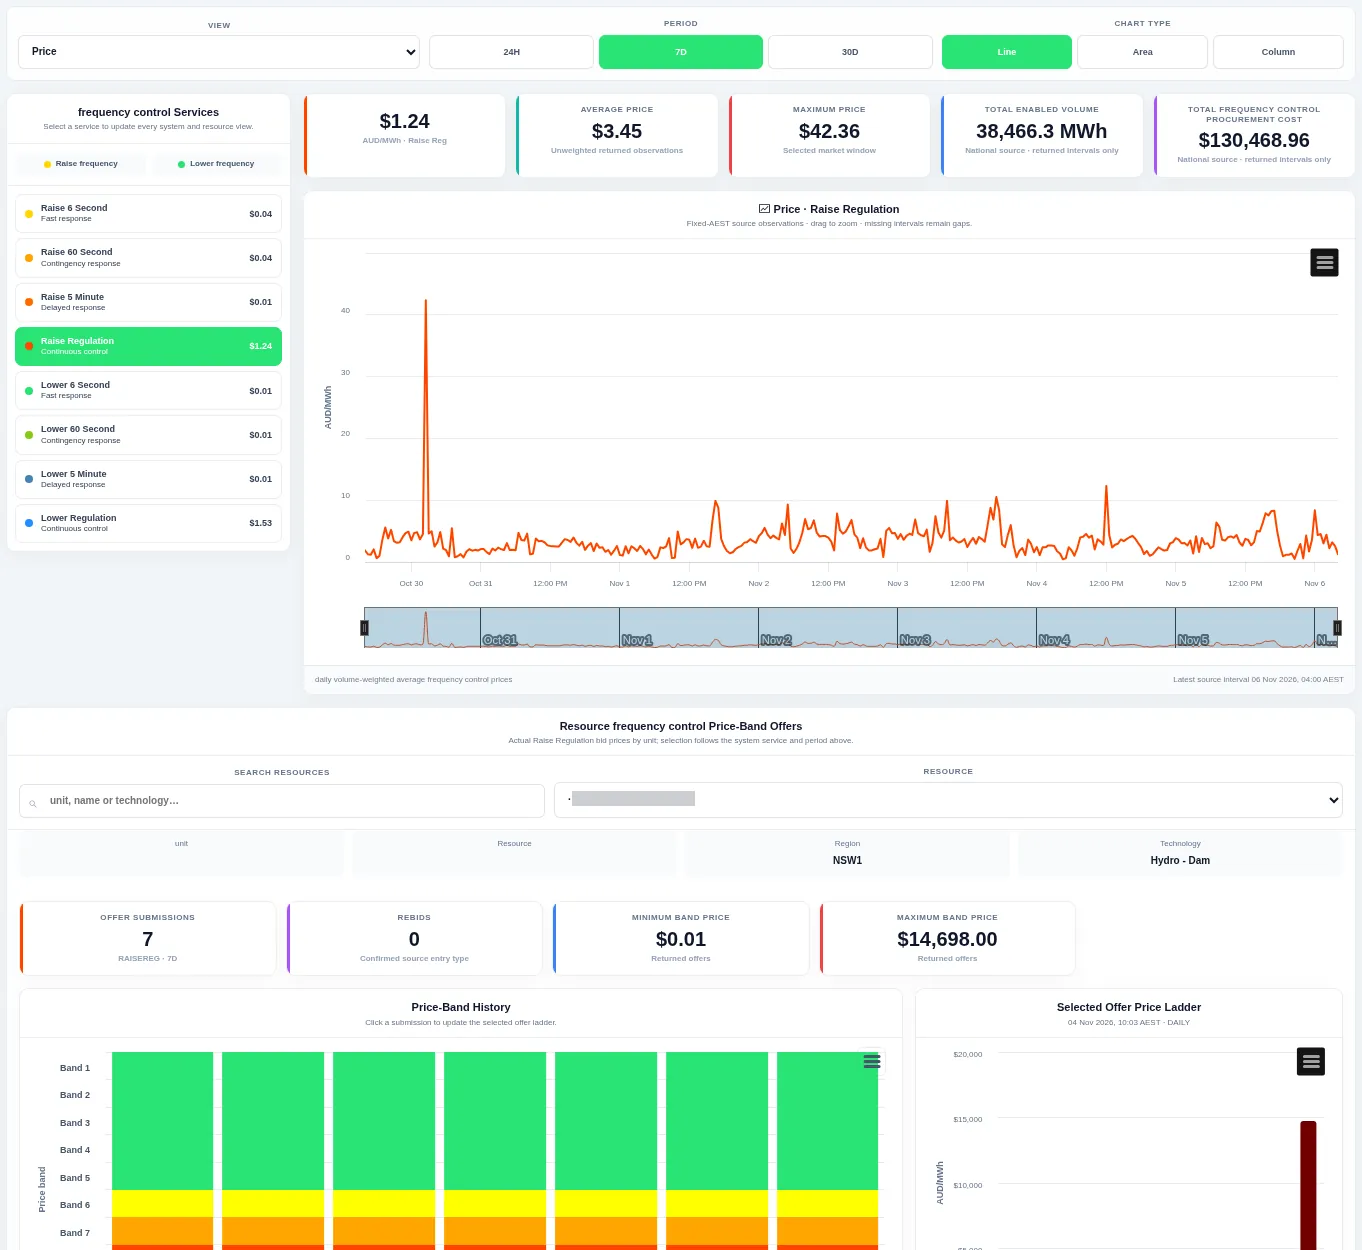
FCAS Prices shows frequency control ancillary service prices. Pick a service on the left to update the price chart and headline cards for price, enabled volume and cost; the lower panel shows a chosen resource's price-band offers for that service. Change the view, period and chart type at the top.
Commissioning Hold Points
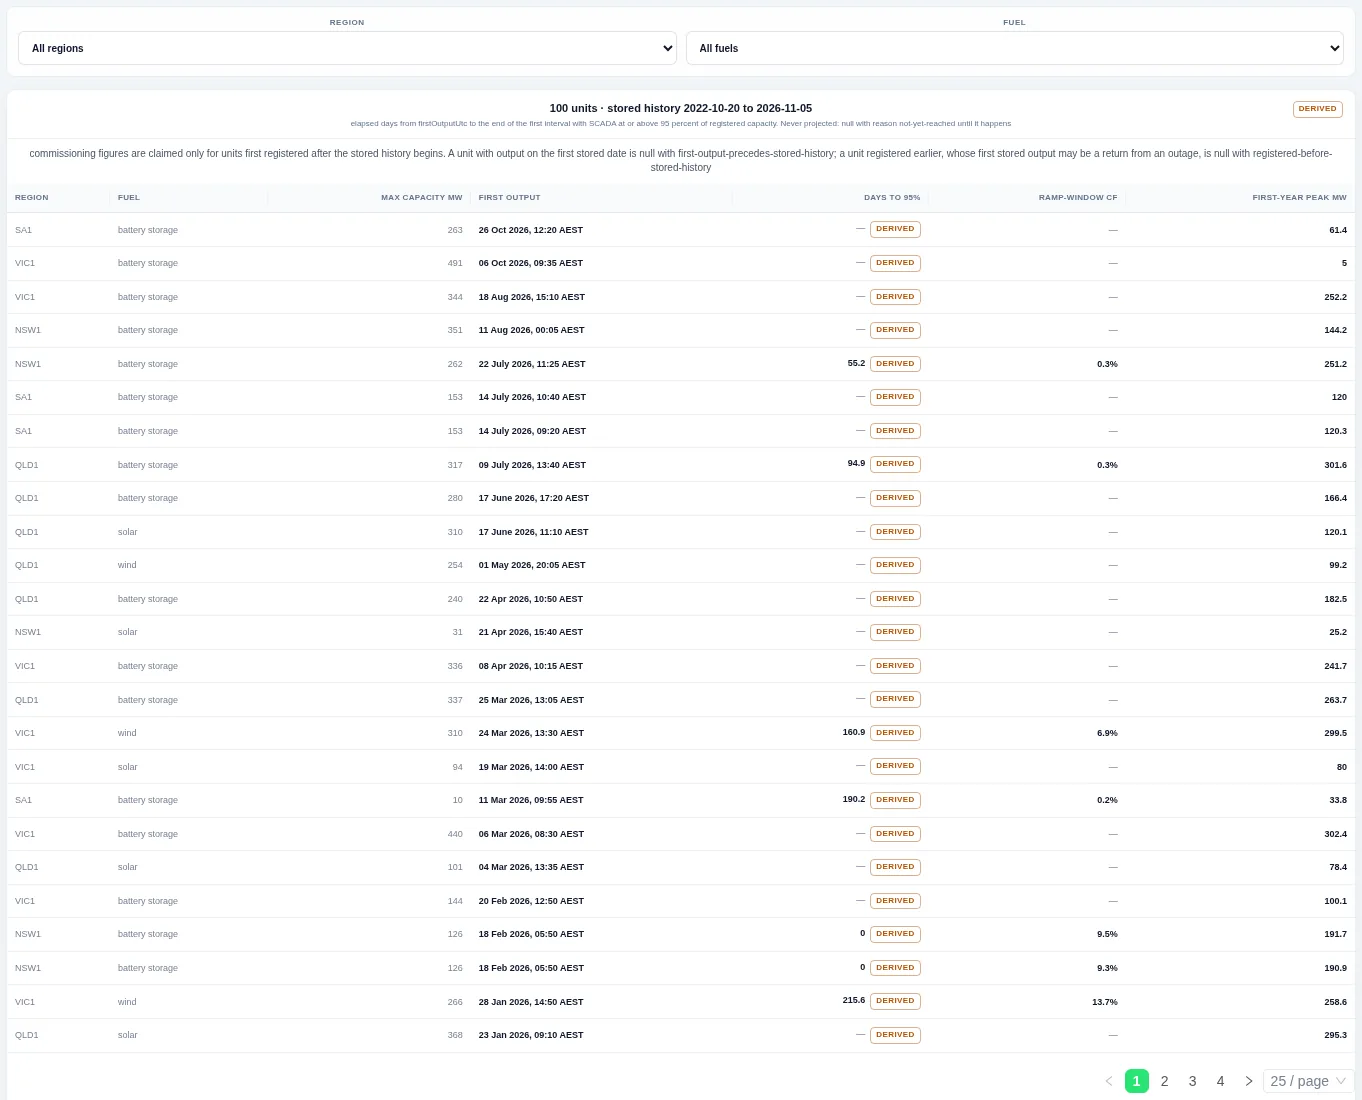
Commissioning Hold Points tracks how newly registered units ramp up after first output. Each row shows a unit's region, fuel, capacity, first output time and how long it took to approach full capacity. Figures are left blank rather than projected when a milestone has not been reached.
Regional Bid Stack Timeline
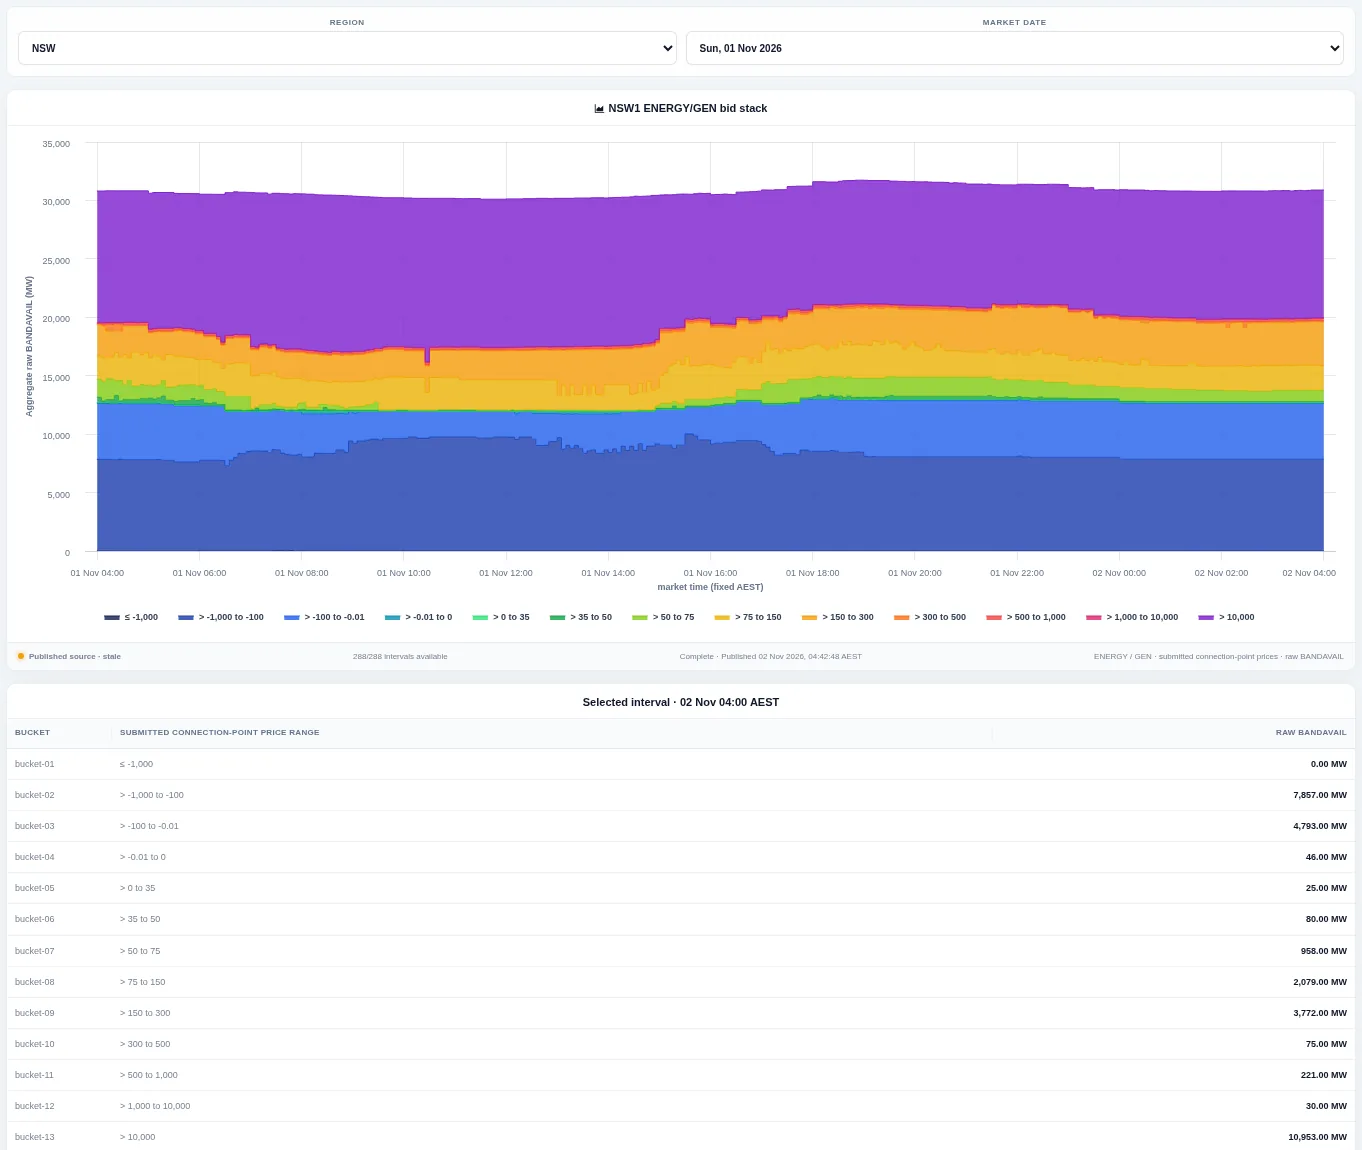
Regional Bid Stack Timeline shows how much generation was offered in each price bucket across one market day for a region. Each coloured band is a price bucket, stacked by offered volume for every five-minute interval. The table lists the bucket volumes for the selected interval.
Portfolio Operations
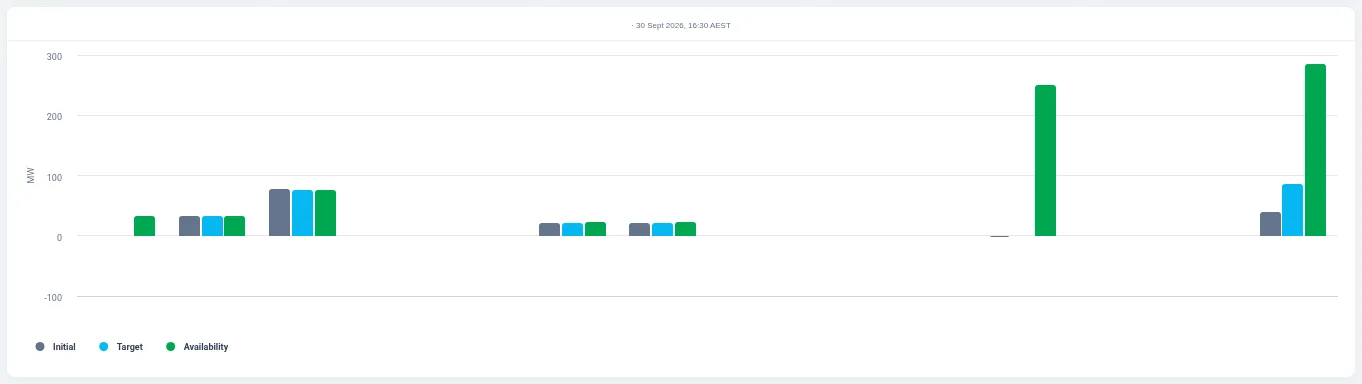
Portfolio Operations compares the units in one participant's portfolio at a single dispatch interval. For each member unit, bars show initial output, dispatch target and availability side by side. Pick a participant, market date and dispatch period to change the view.


