Docs / Markets / East Coast Constraints and Market Information
Docs Menu
East Coast Constraints and Market Information
These views show which network constraints bind, what they cost, which outages drive them, and how futures compare with the realised spot price.
▶ Watch the Video: East Coast Market & Constraints (1:03)
Open any view from Markets in the product switcher, then pick the market and the view from the left-hand menu. See the Network Map Markets Guide for the common controls and plan access.
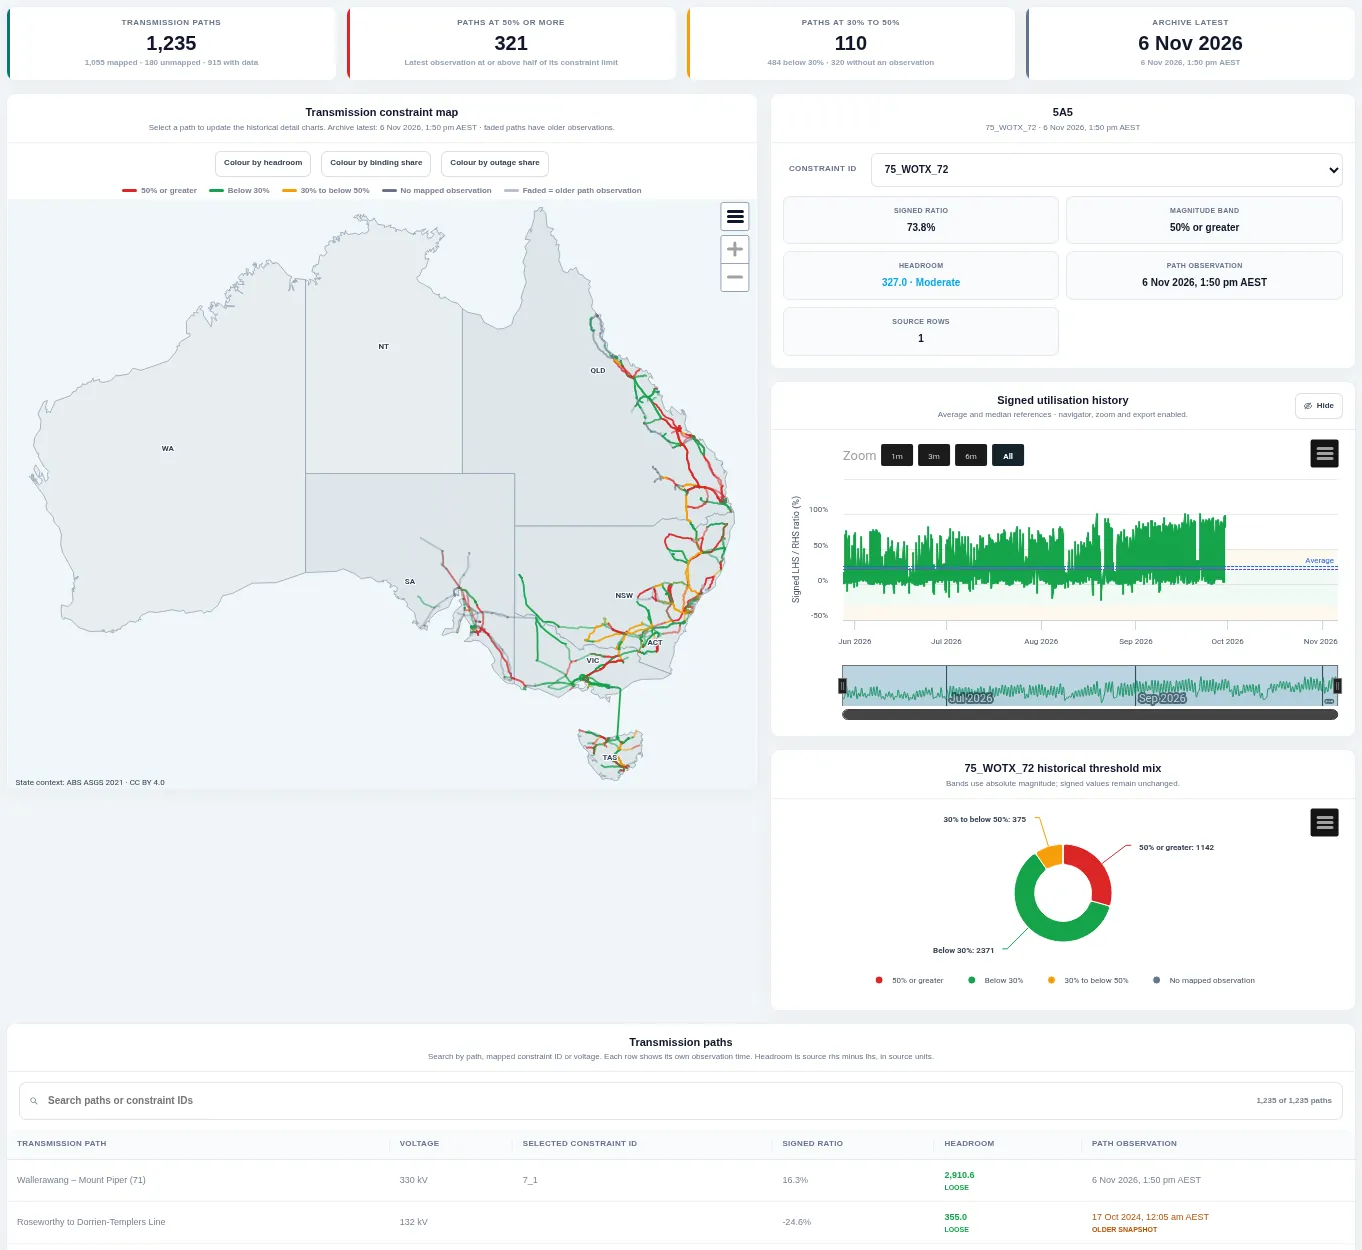
Headline cards count paths by utilisation, the map colours each path by how close its constraint is to its limit, and the right panel shows the selected constraint's history and threshold mix. Search the path table below or click a path on the map.
Dispatch Constraint Marginal Values
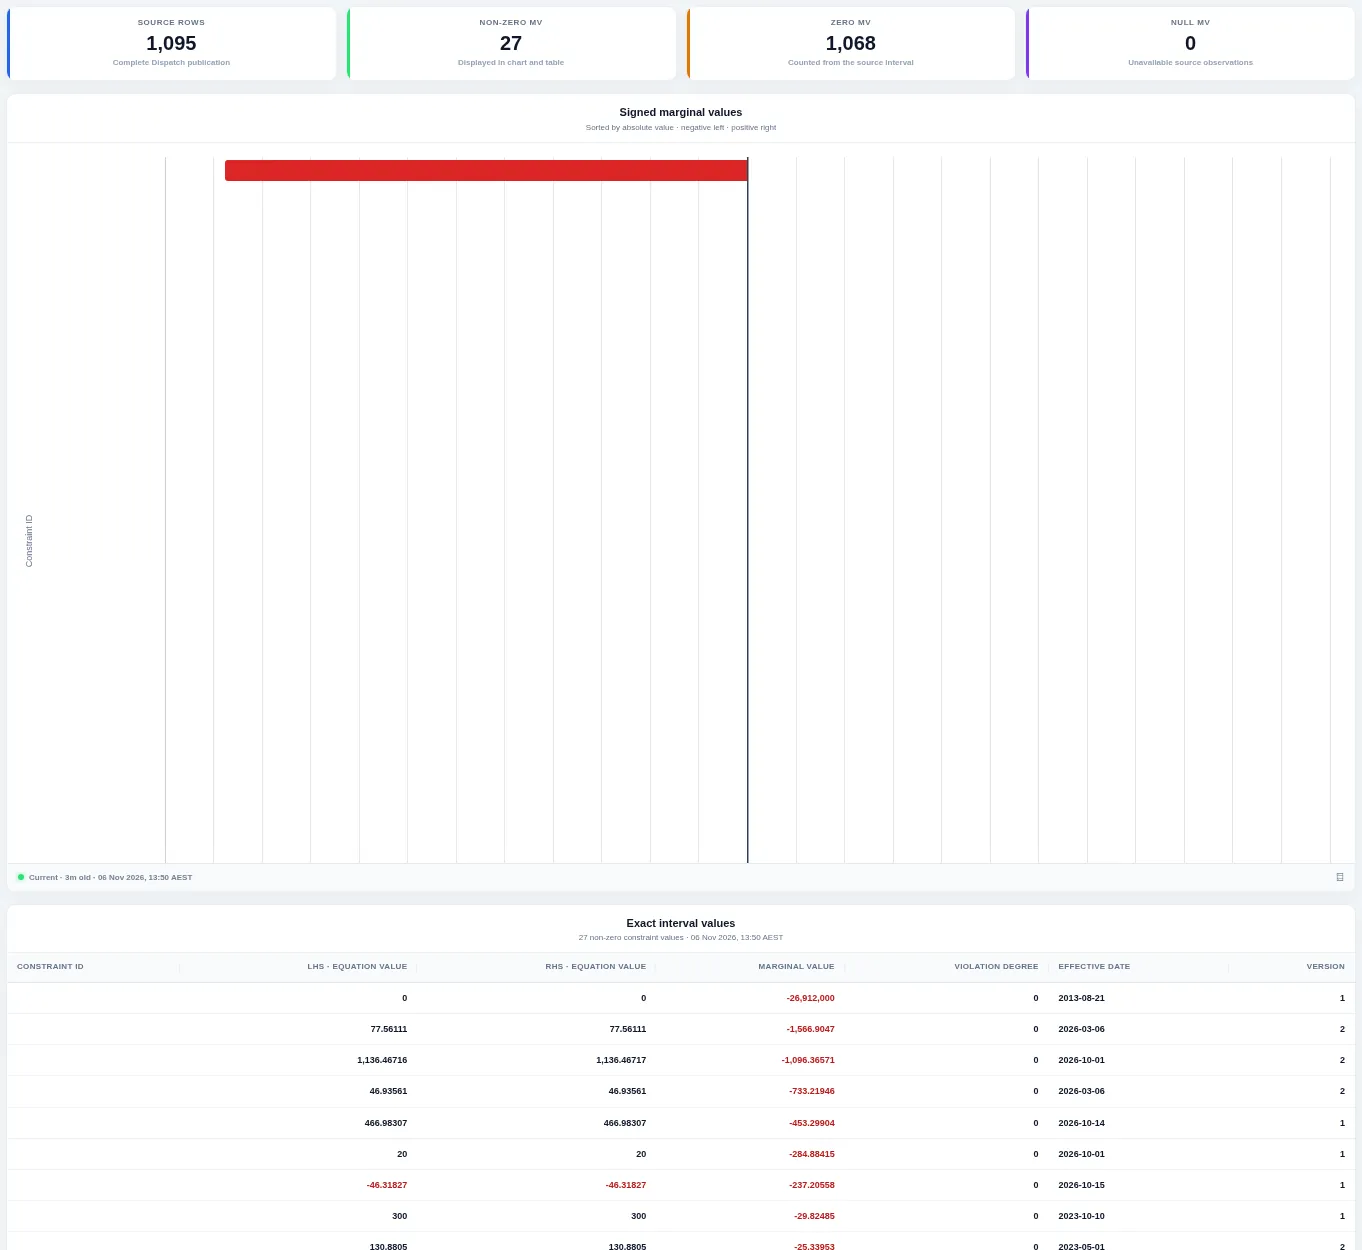
Binding constraints and their marginal values in the latest interval.
The chart and table rank the constraints that are binding in the latest interval by marginal value, with their left-hand side, right-hand side and violation degree. A higher marginal value means the constraint had a larger effect on dispatch cost.
Constraint Investigation
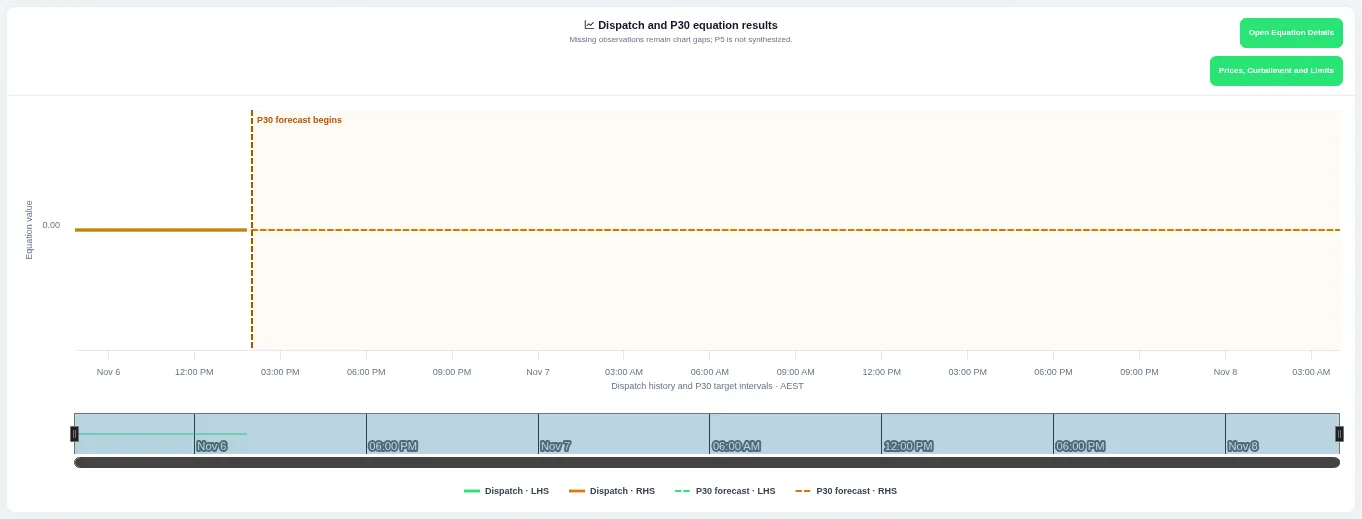
Dispatch and forecast results for a binding constraint.
The chart joins recent dispatch results for the constraint to its thirty-minute forecast, with buttons to open the equation details or the linked prices, curtailment and limits. Enter a unit, constraint or constraint set to trace.
Network Outage Constraint Sets
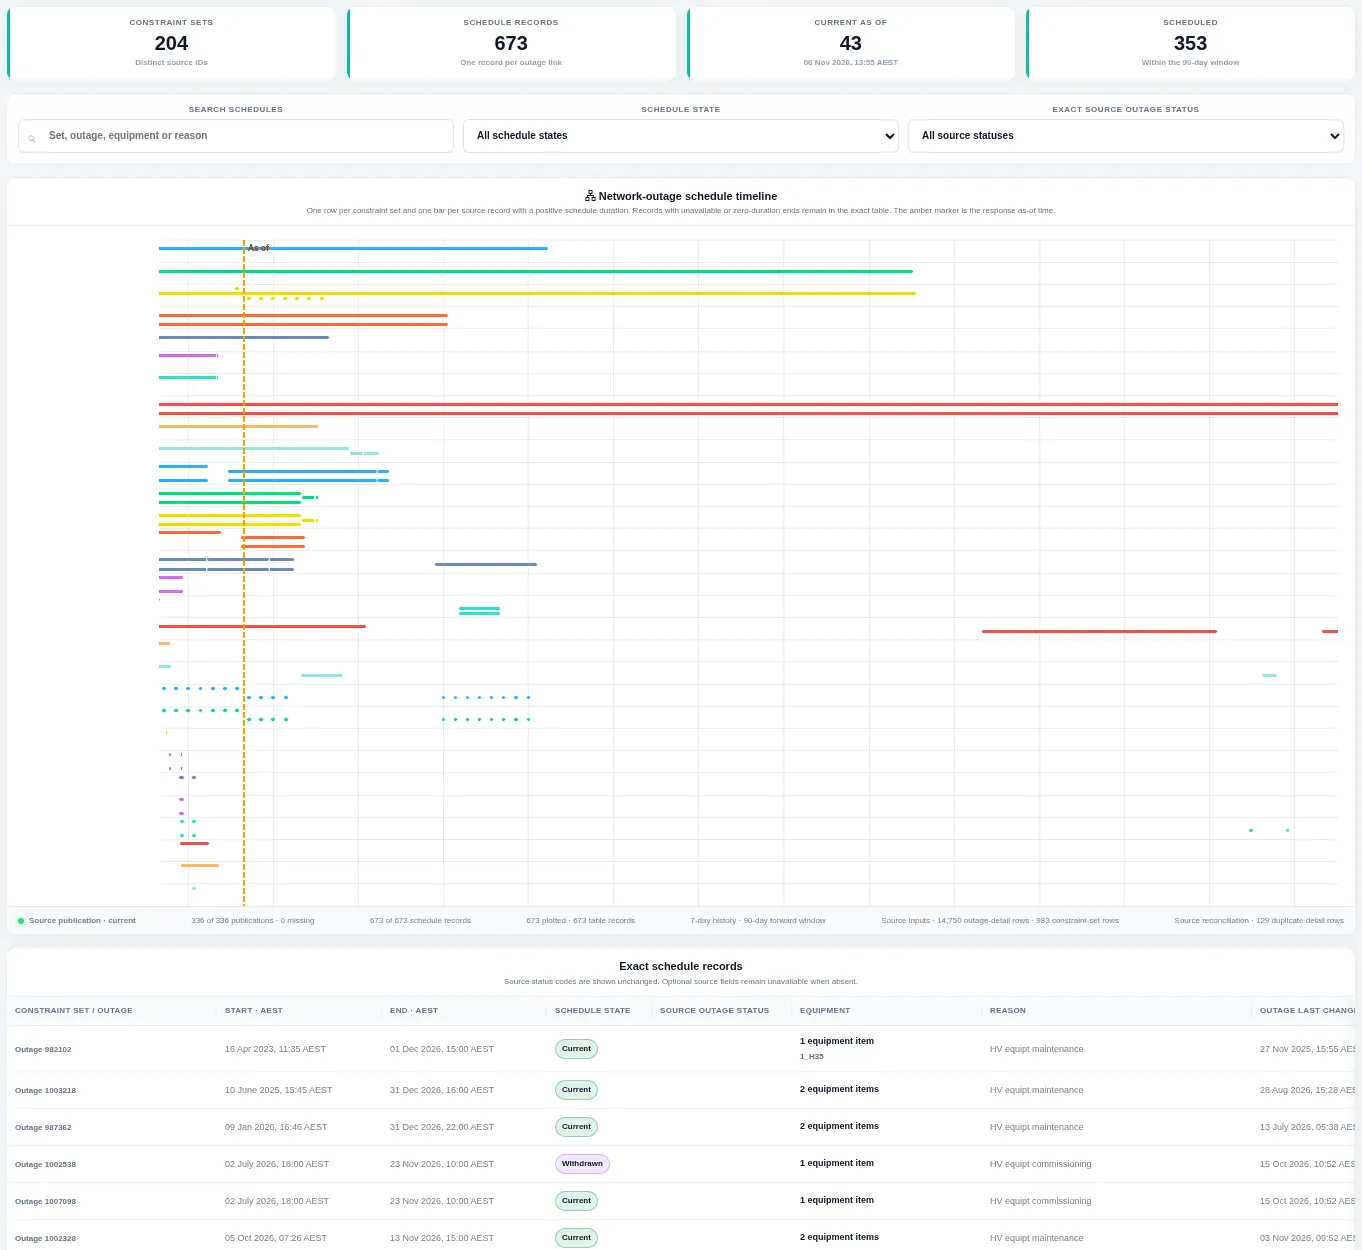
Network outages linked to constraint sets.
A timeline shows one bar per scheduled network outage record over the last seven and next ninety days, with an amber marker at the current time and an exact table below. Search and filter by schedule state and outage status.
Constraint Set Analysis
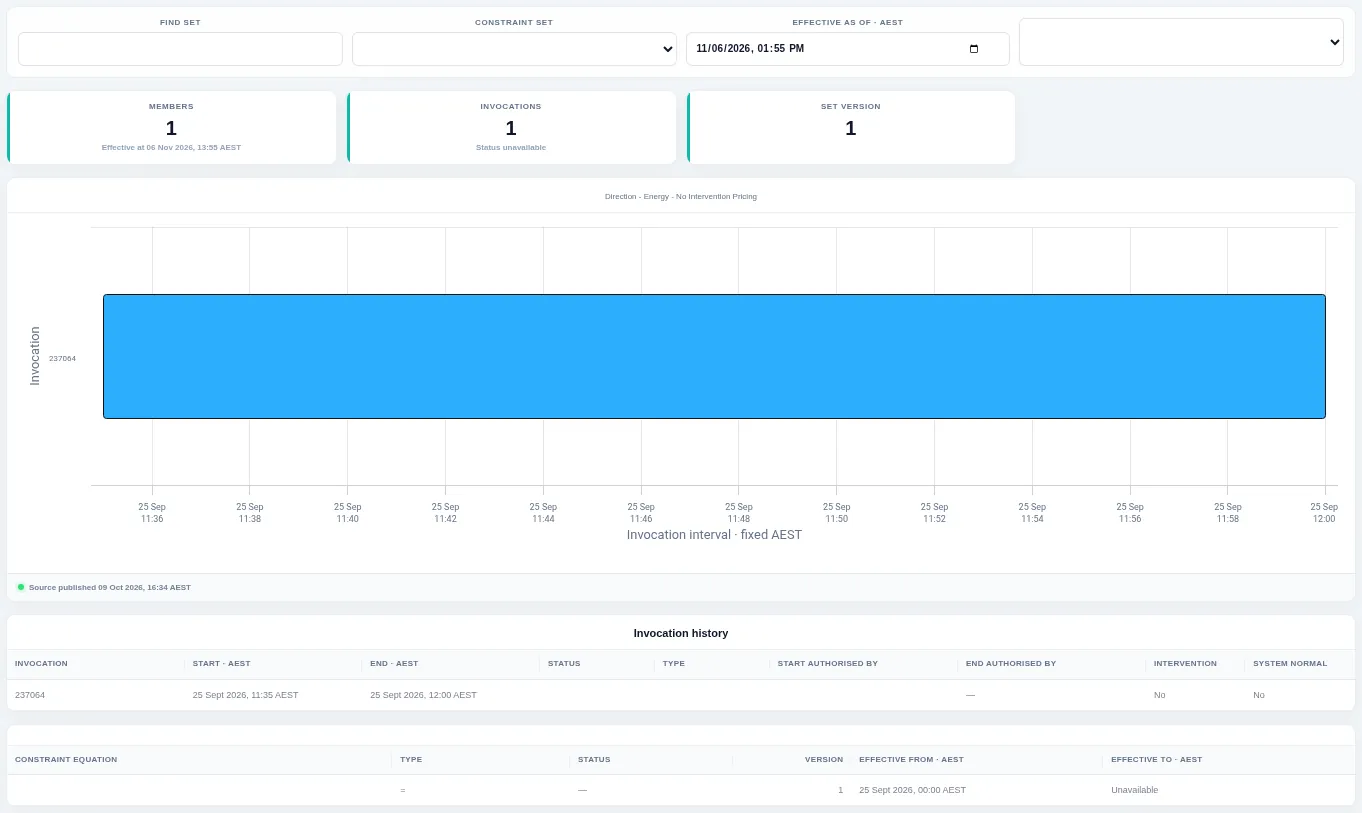
One constraint set's invocations, equations and results.
Cards give the set's members, invocations and version, the chart shows when it was invoked, and tables list its invocation history and equations. Find a set by ID and choose an effective date.
Electricity Futures
Futures prices and volumes with the front contract against realised spot.
Electricity futures history, latest prices and traded volume by region, with each front contract's last close against the realised spot price. Change the period and region.
AEMO Notices
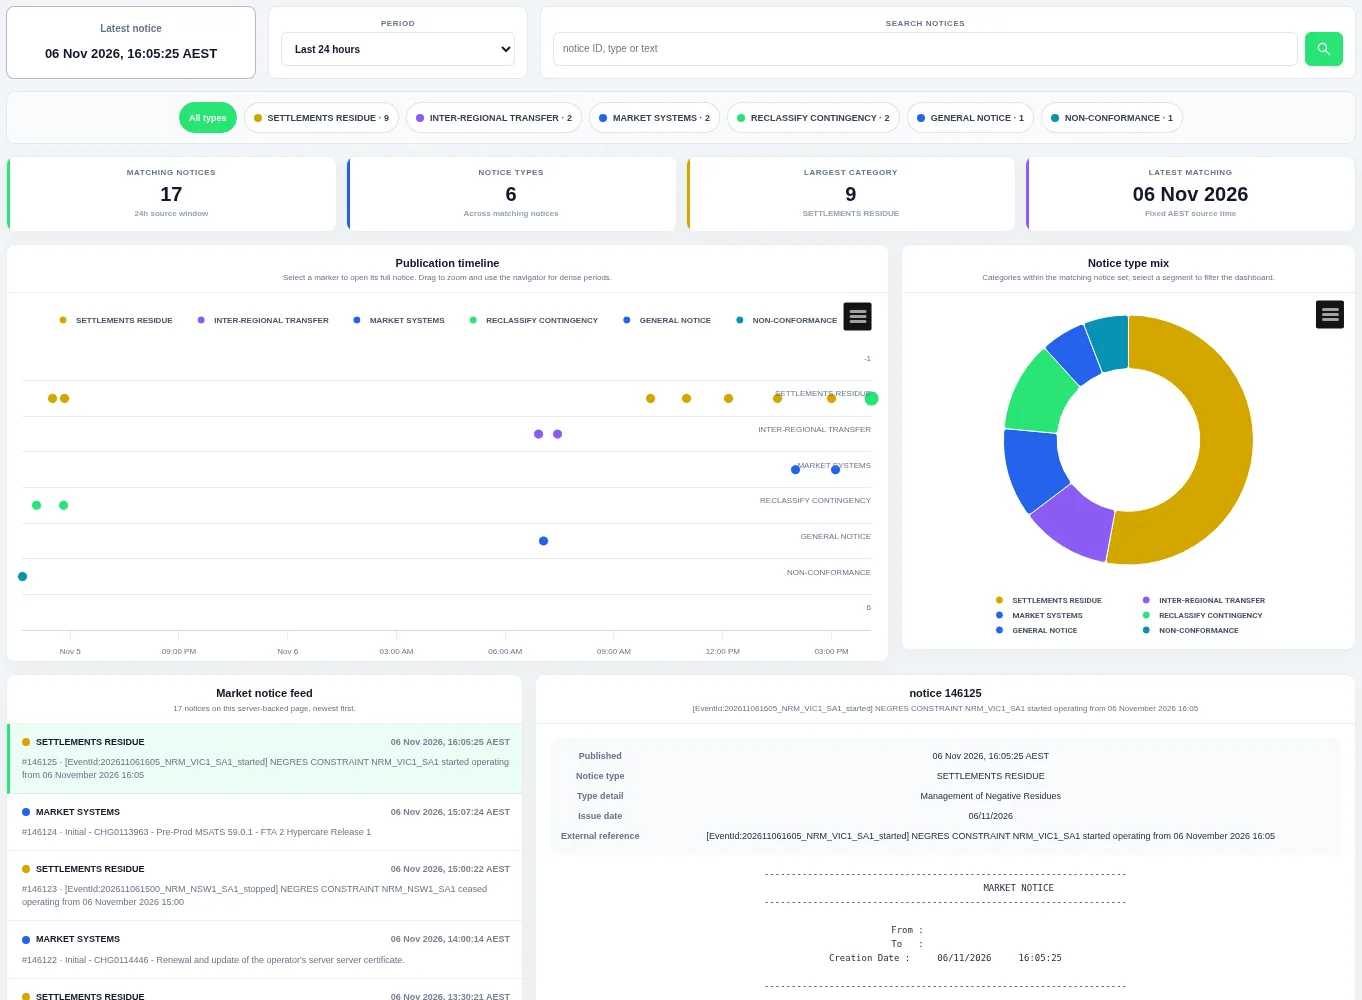
AEMO Notices brings the operator's published notices into one searchable feed with type filters.
AEMO Notices brings the operator's published notices into one searchable feed with type filters. A timeline and type mix chart show when notices were published and which categories dominate. Selecting a notice opens its full plain-text detail.
Constraint Trend
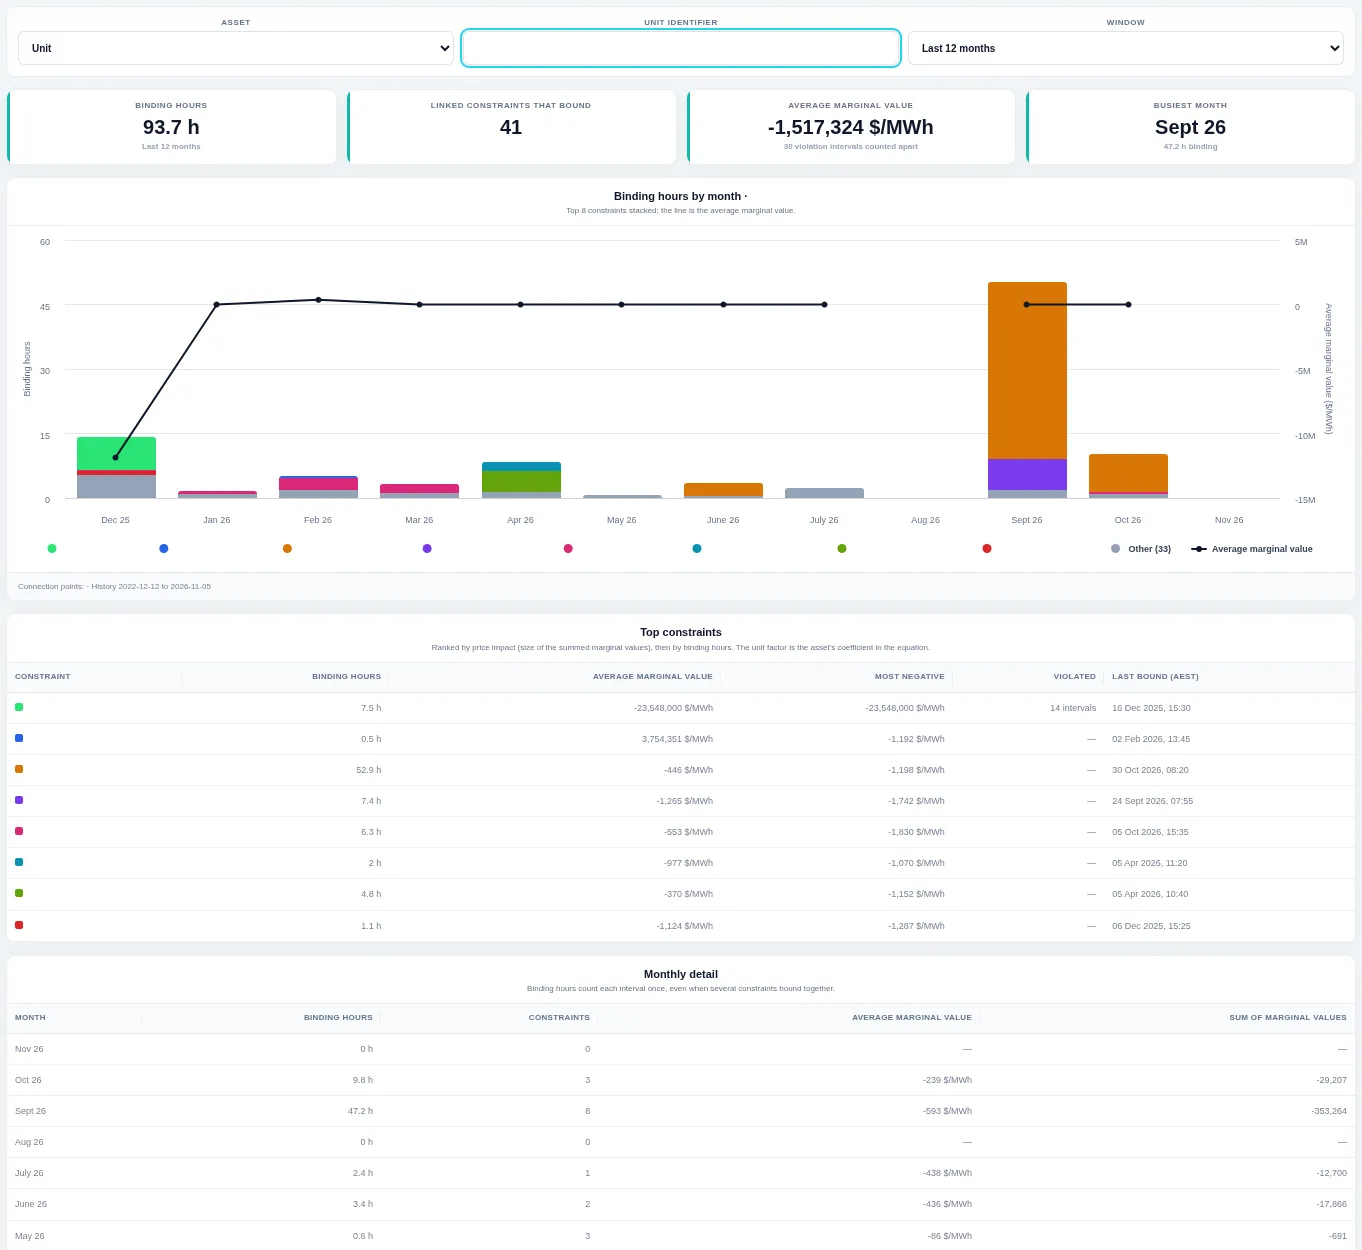
Constraint Trend shows how often network constraints that include a chosen unit or site have bound each month.
Constraint Trend shows how often network constraints that include a chosen unit or site have bound each month. Bars stack binding hours by constraint and a line tracks the average marginal value. Tables below rank the constraints and give monthly detail.
Constraint Equation Analysis
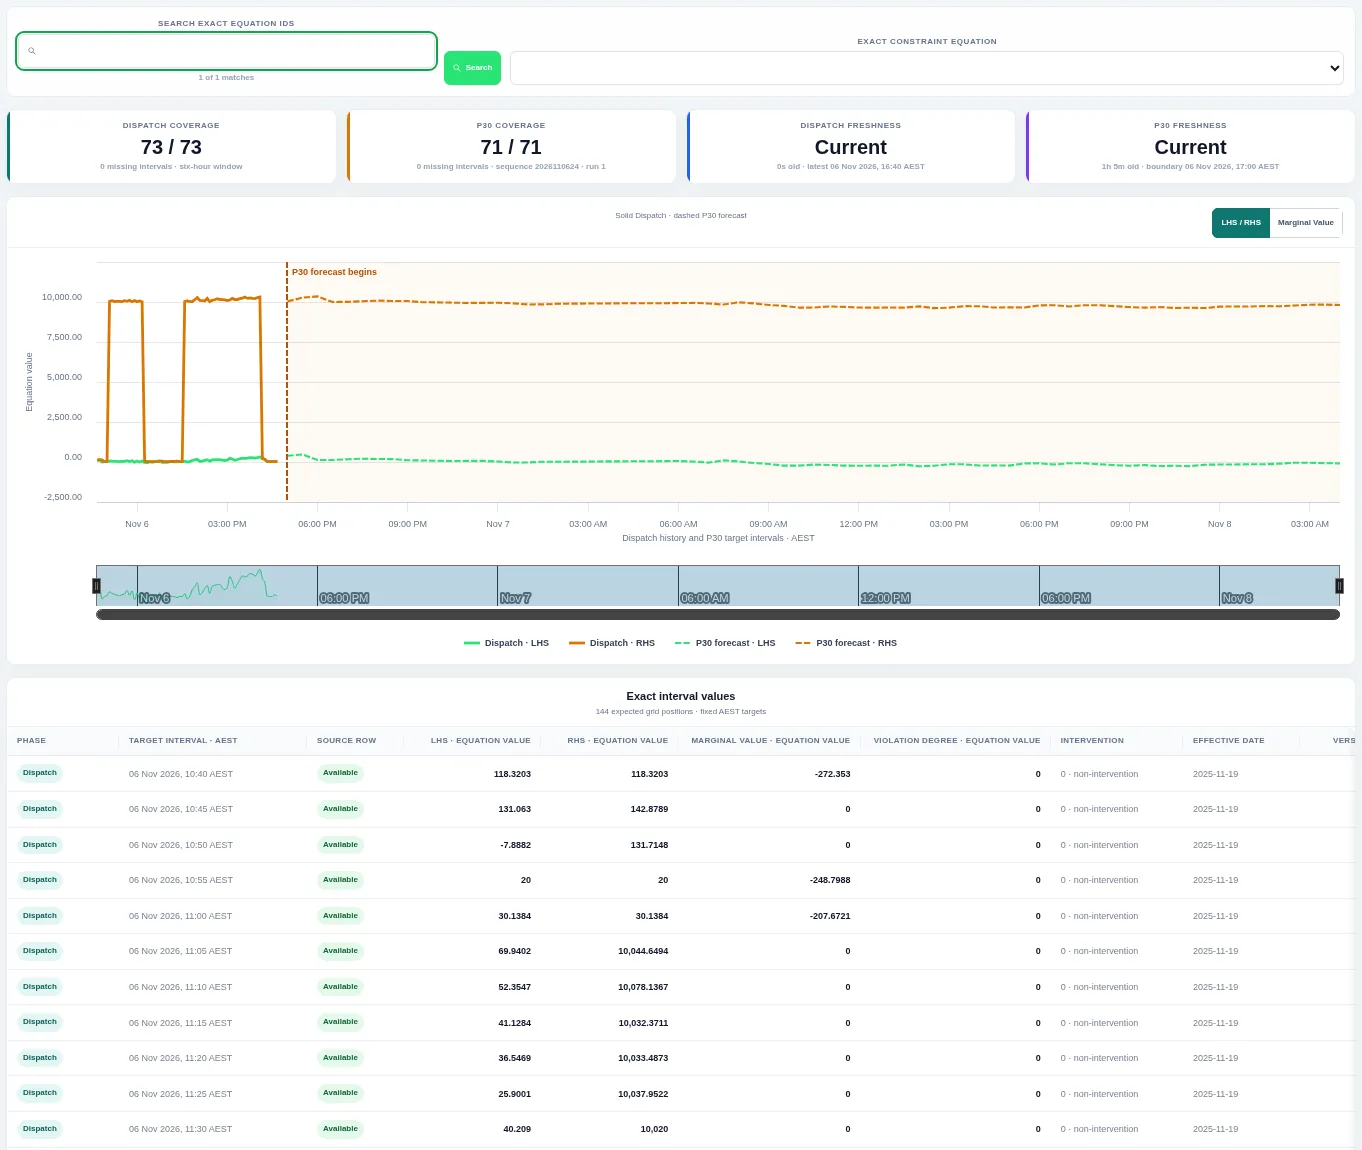
Constraint Equation Analysis plots one constraint equation's values across recent dispatch intervals and the latest forecast run.
Constraint Equation Analysis plots one constraint equation's values across recent dispatch intervals and the latest forecast run. Solid lines show actual dispatch values and dashed lines show the forecast. Coverage and freshness tiles show how complete each source is.