

Network Map Solutions
Commercial & Revenue
Connect physical energy flows to contracts, clean energy and the business case.
Free account. Paid plans from US$75/month.
Follow a modelled example through energy balance, an NPV ranking of design alternatives, financial outlook and cumulative discounted cashflow.
Connected Decisions
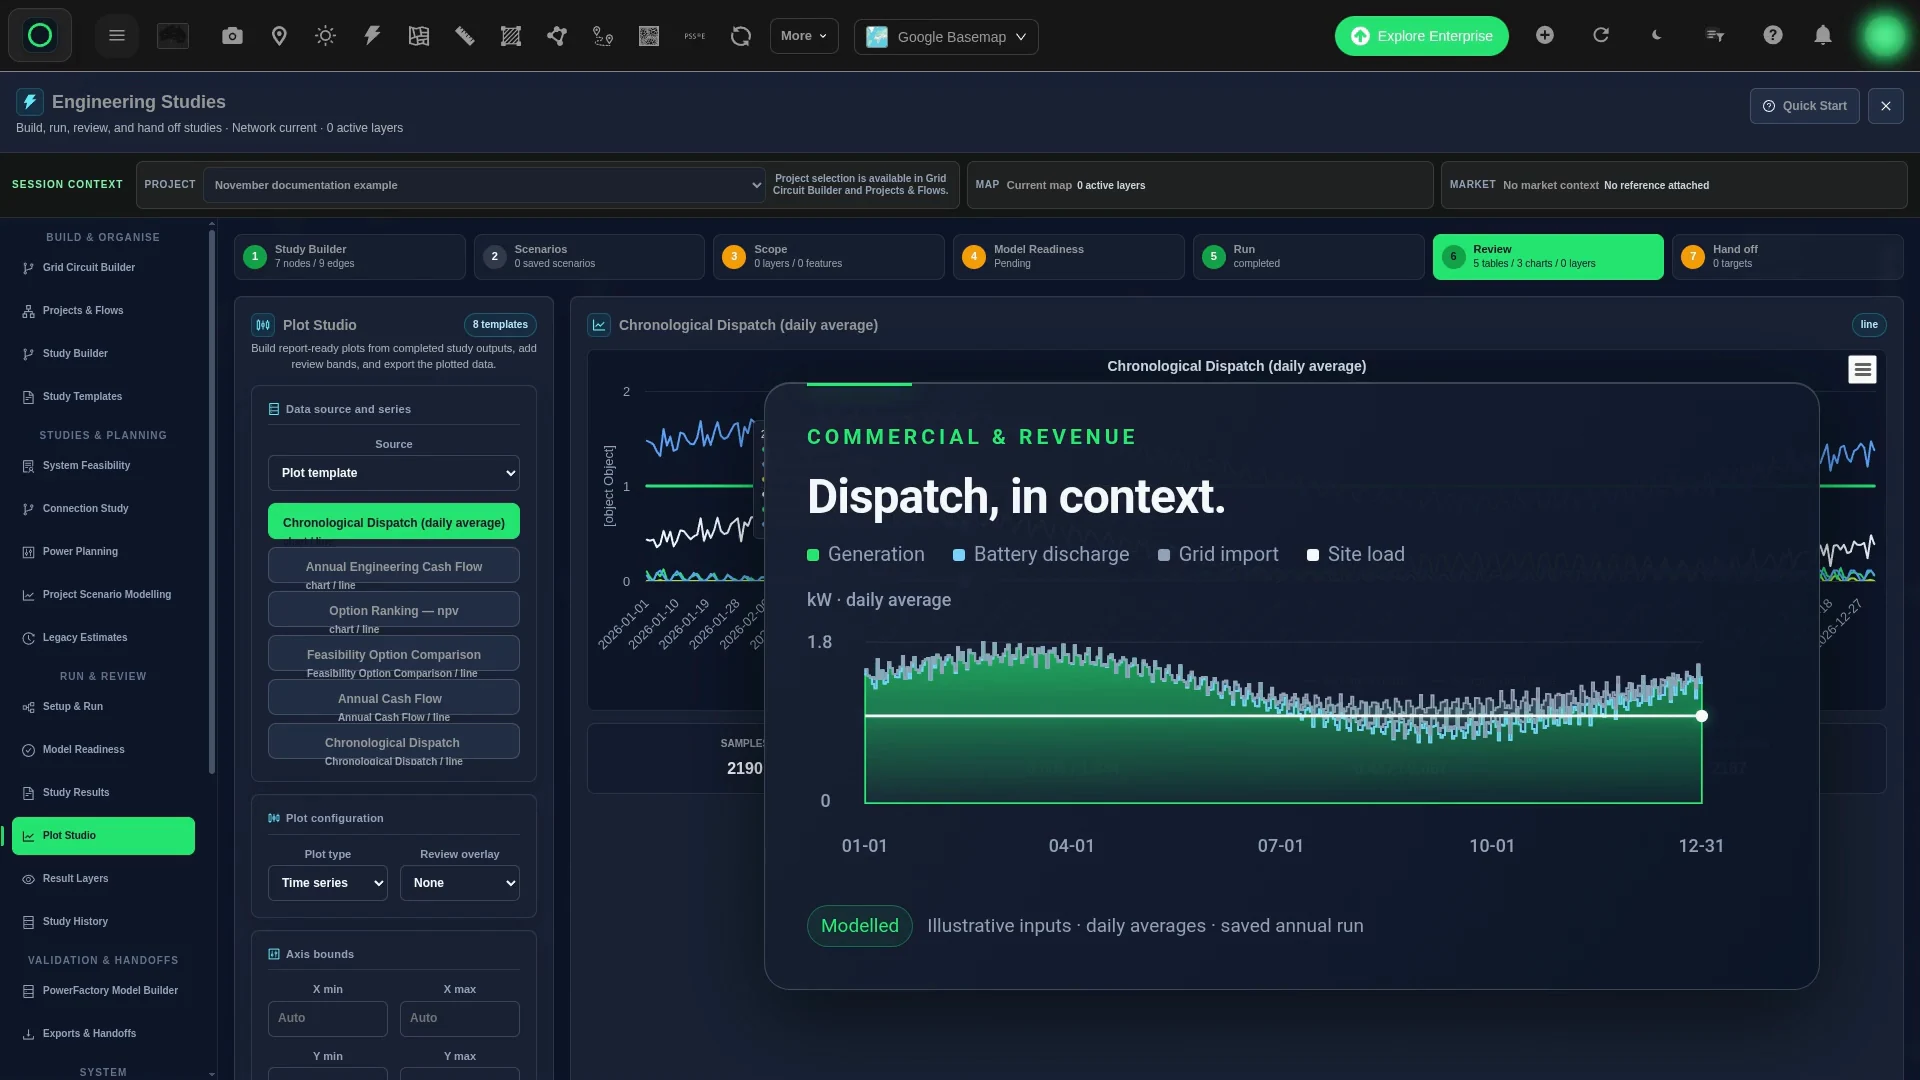
See How Assets Work Together
Review modelled dispatch across solar, storage and the grid. Keep the operating profile and its assumptions in view.
Connected Decisions
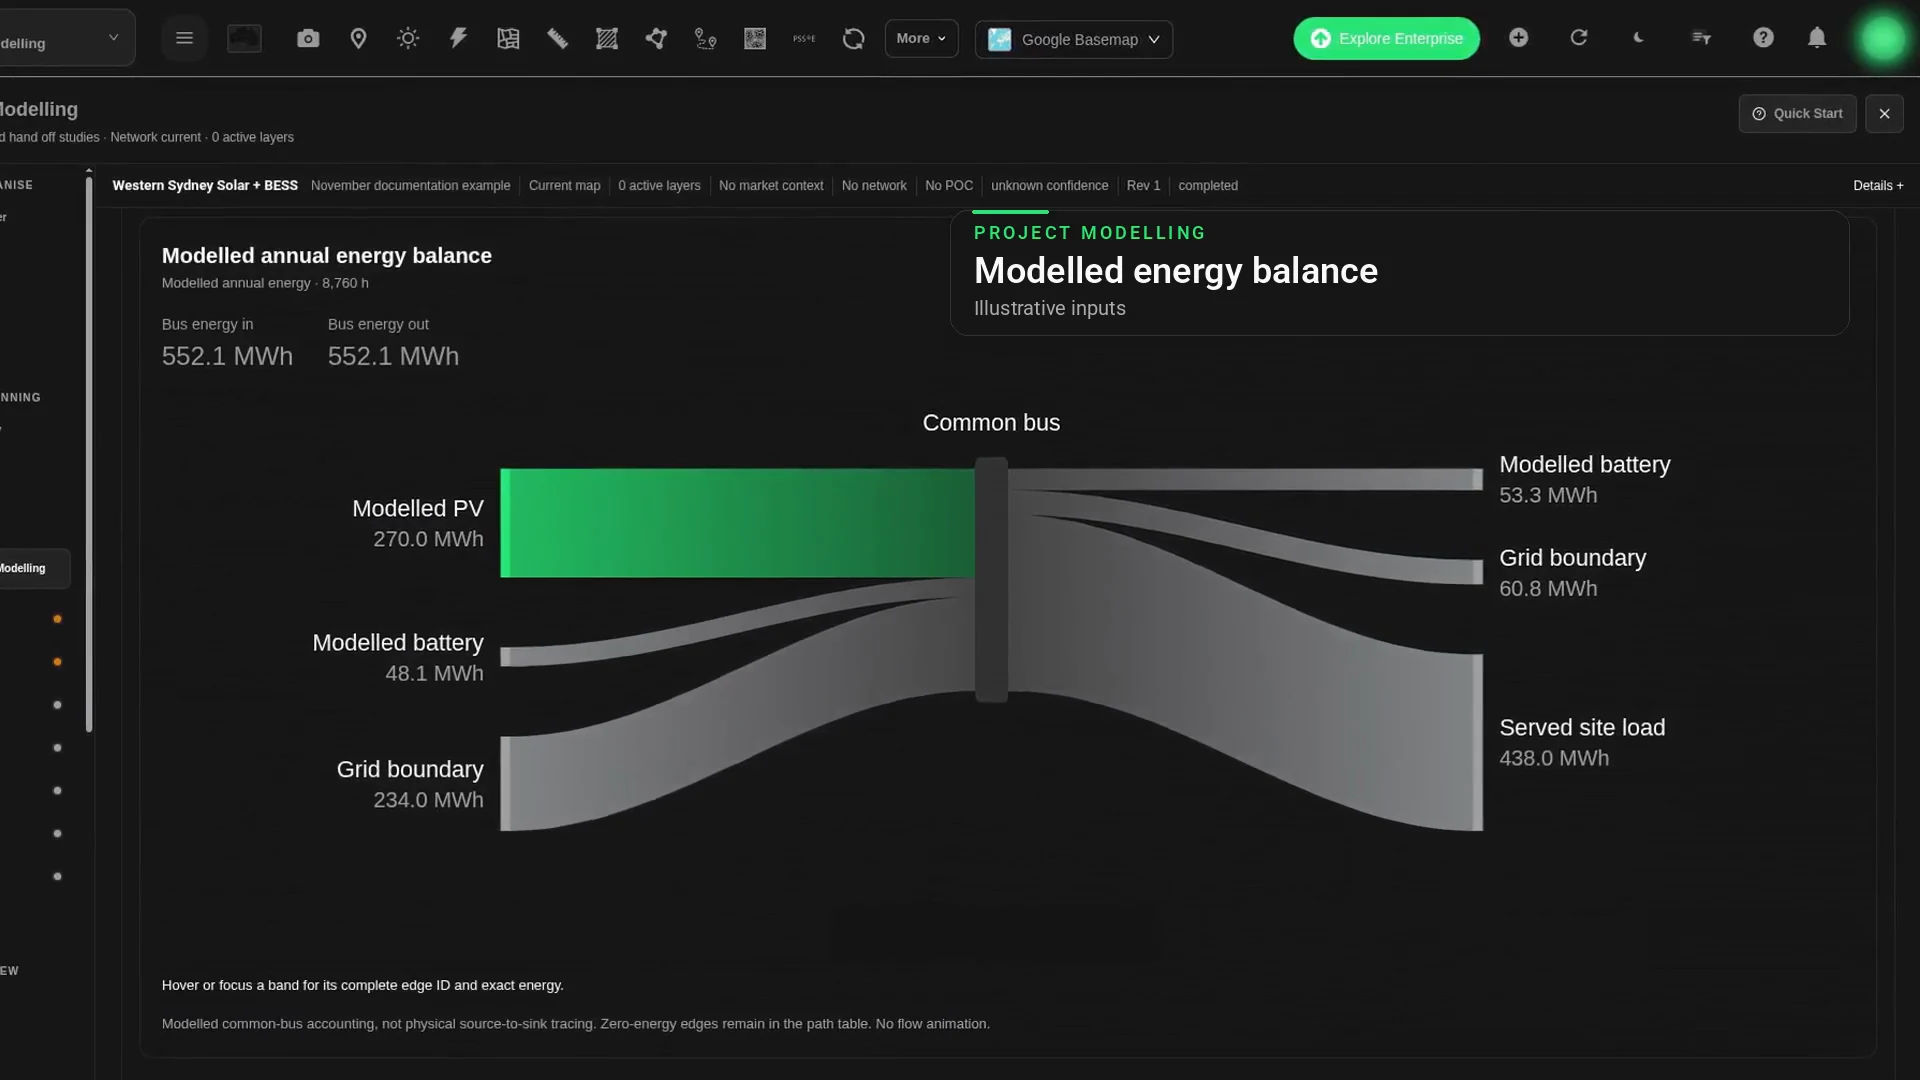
Follow Every Unit Of Energy
See the modelled energy of solar, storage, grid and load on a common bus, with every MWh in and out accounted for.
Connected Decisions
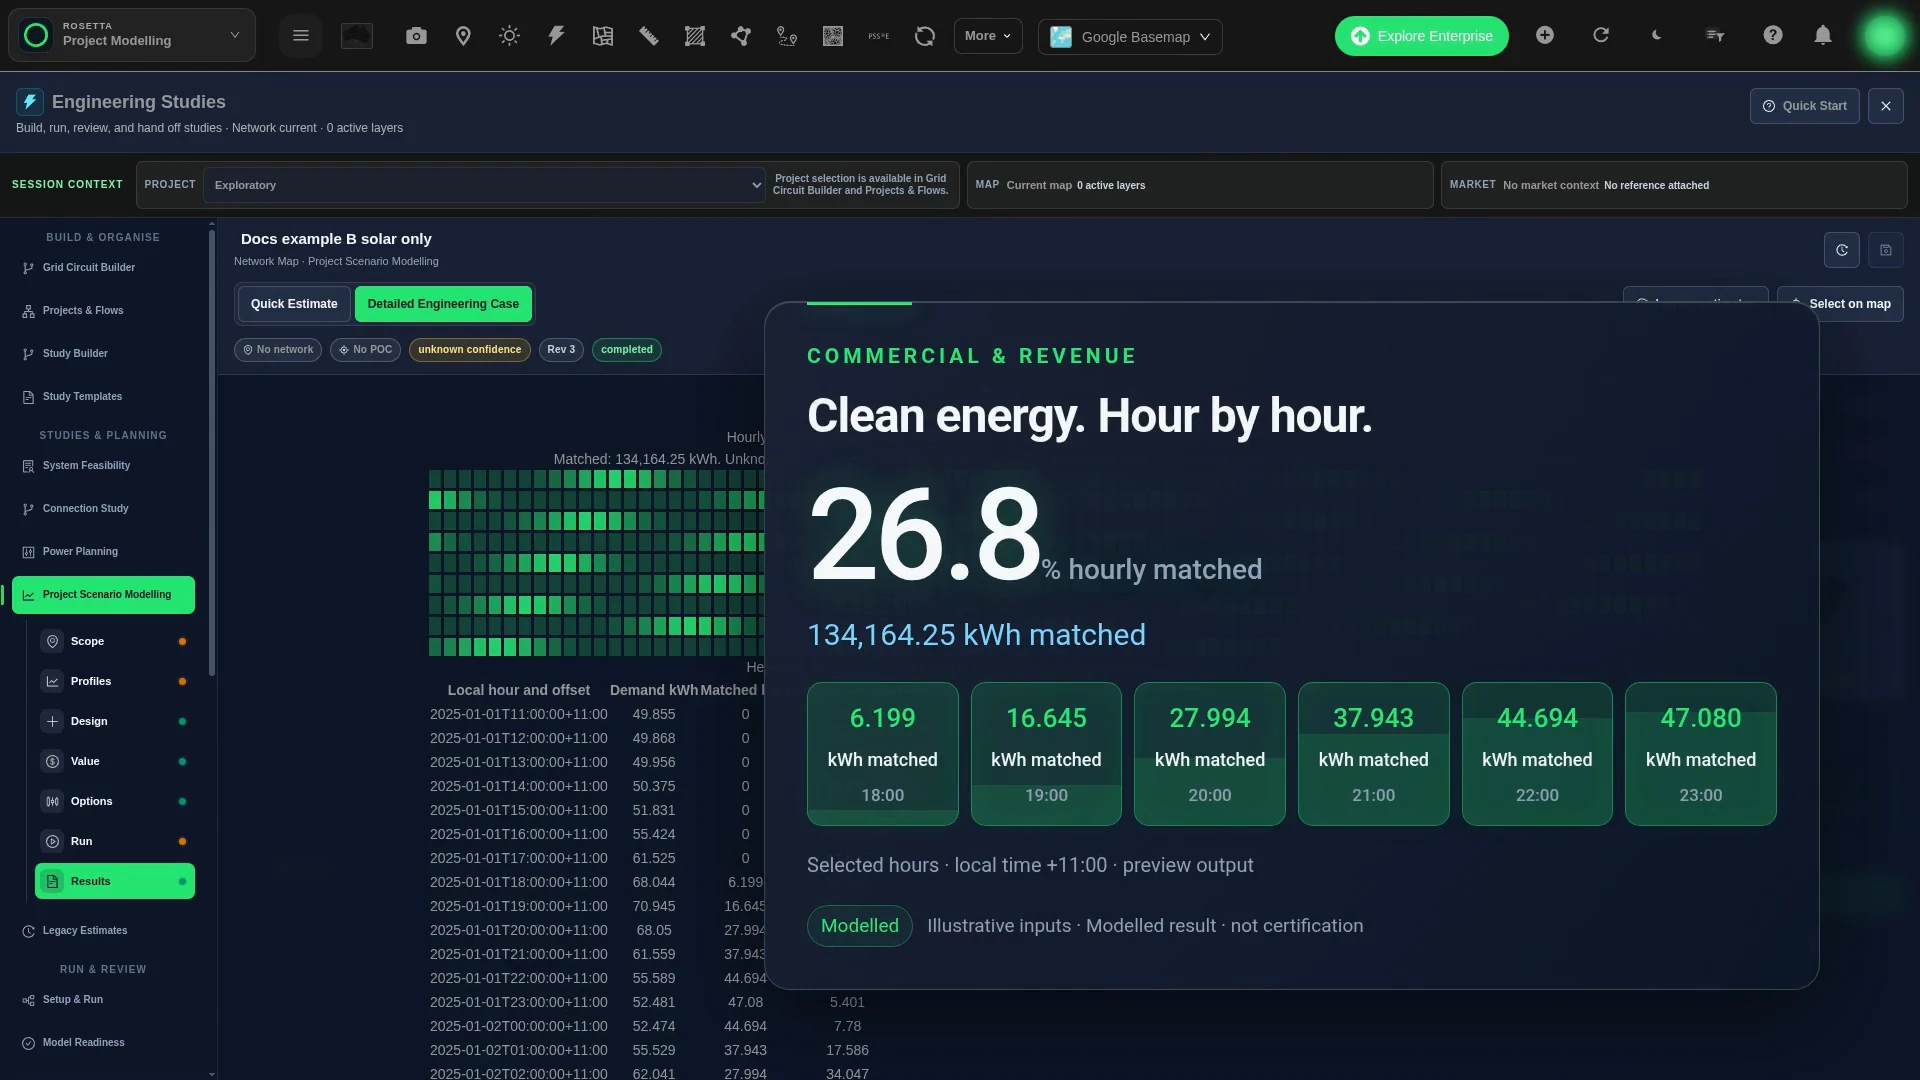
Connect Contracts And Clean Energy
Review contract settlement and hourly clean-energy matching alongside the physical energy paths. Keep the results tied to their inputs.
Connected Decisions
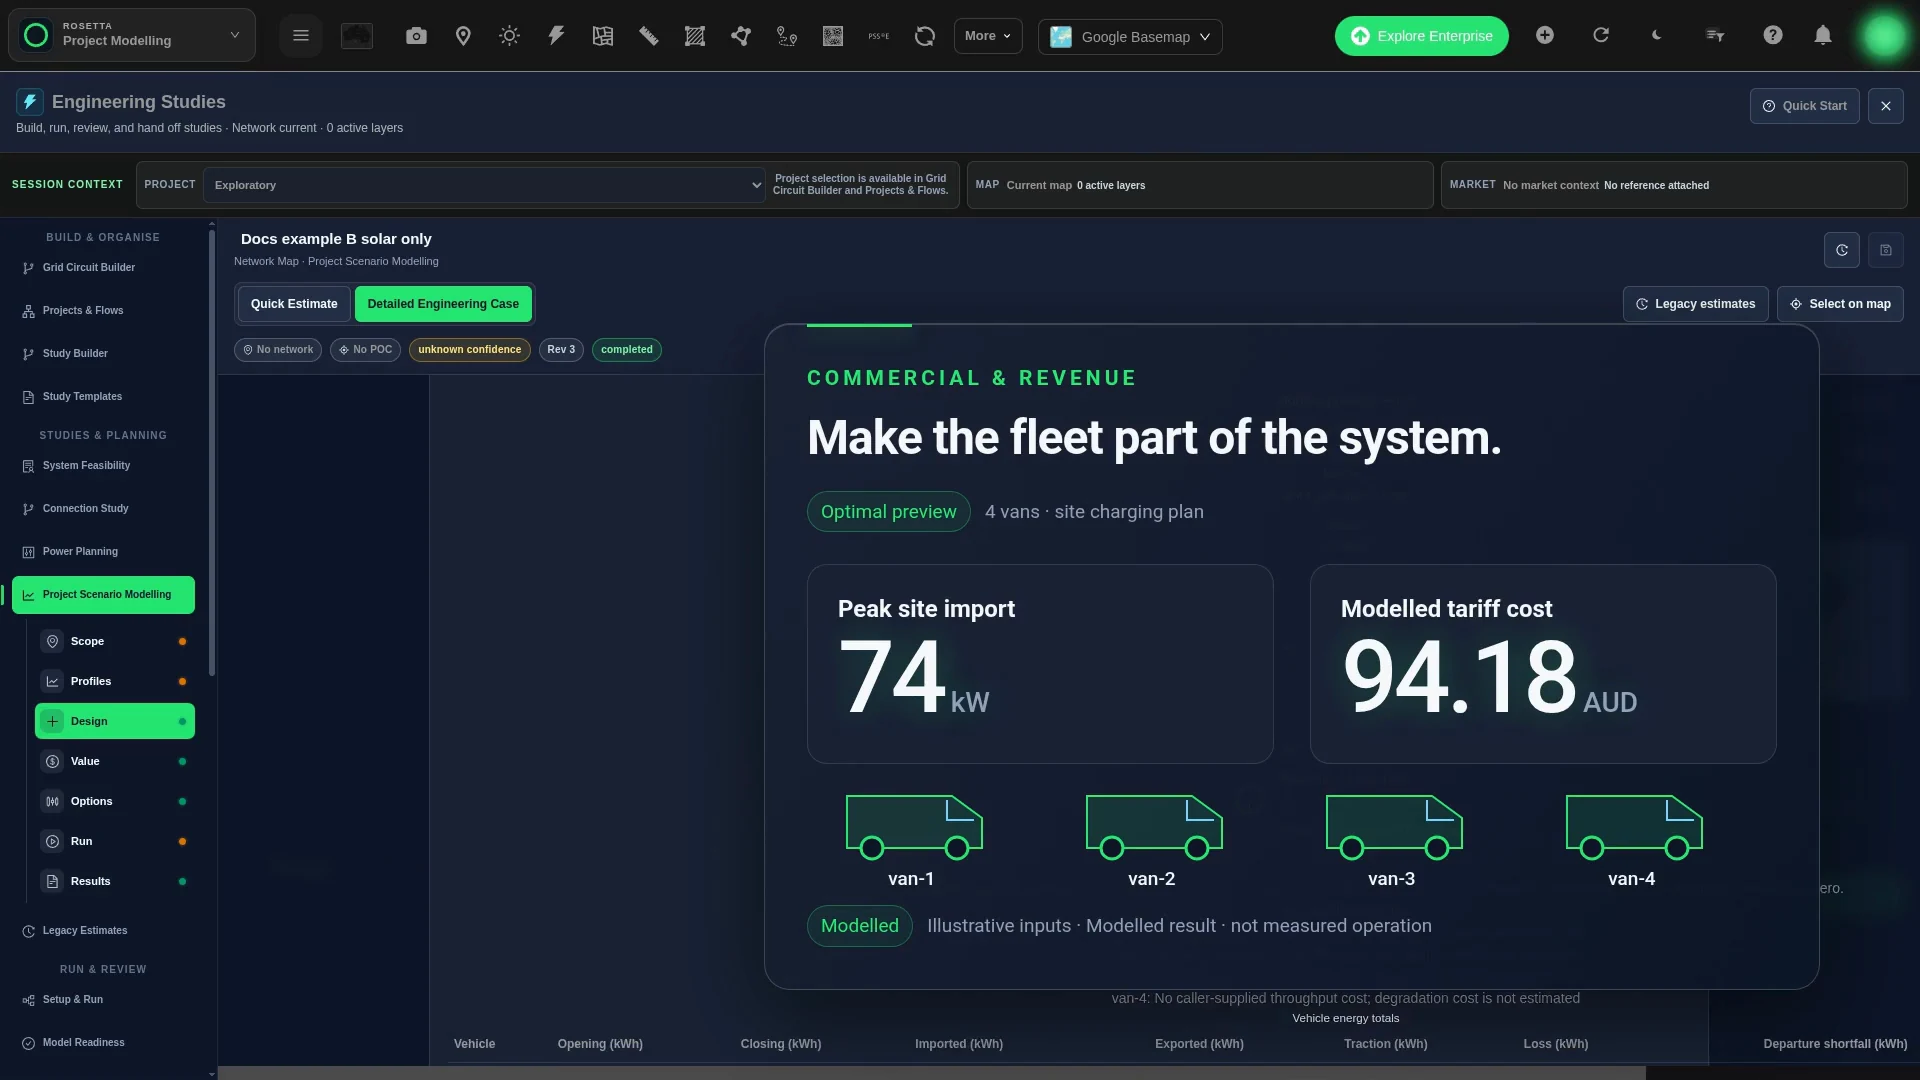
Plan The Fleet With The Site
Plan vehicle charging and discharge alongside the site’s energy needs. Read the modelled state of charge with the charging assumptions in view.
Illustrative site study
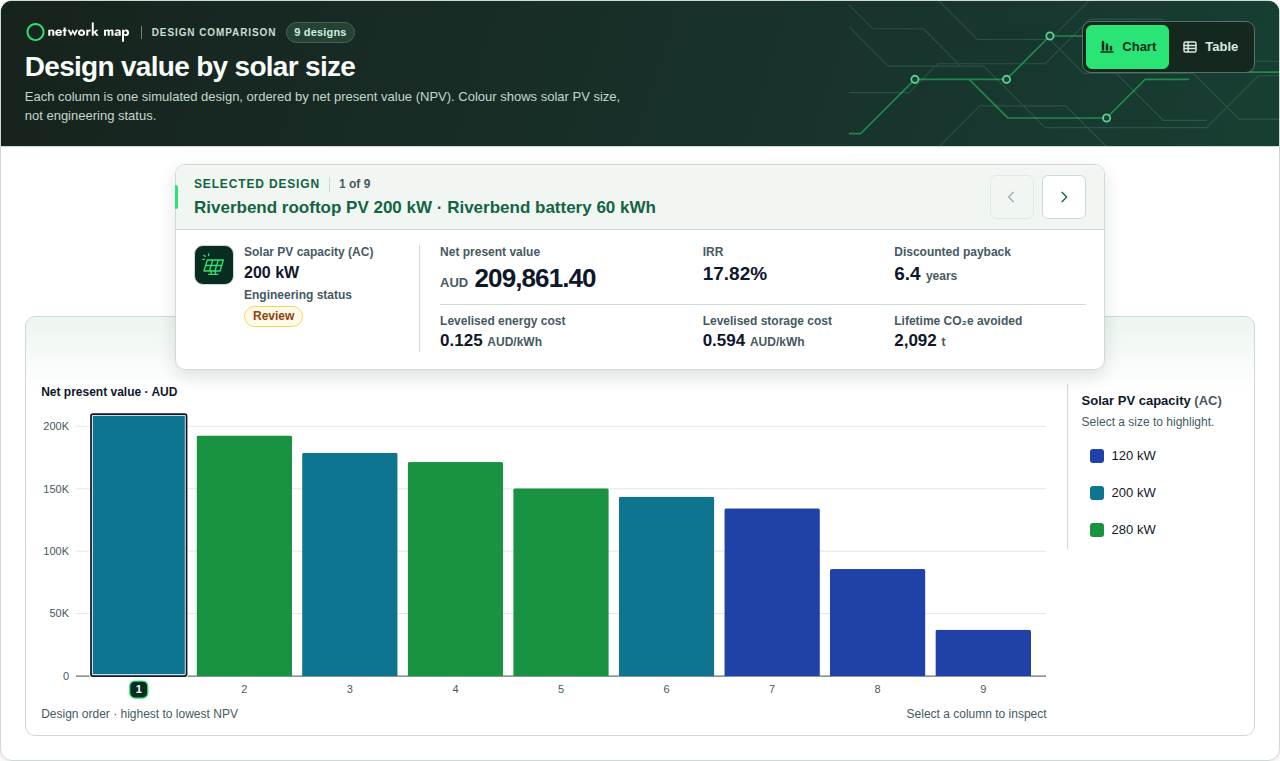
Why 200 kW beat 280 kW at Riverbend
At this fictional cold store, the 200 kW solar array has about A$17,200 more in modelled net present value (NPV) than the 280 kW array over 15 years. Both use the same 60 kW / 60 kWh battery.
In year one, most of the larger array’s extra output is exported or curtailed. Exporting a kilowatt-hour earns 4.5¢; using it onsite avoids a 23¢ grid purchase. Both designs still need engineering review.
Riverbend in 47 seconds · sound on
The Highest NPV Is Only The First Movement
Watch nine designs rank by NPV. Then follow the ranking onto the network: lines and substations, power flow, bus voltages, and value and engineering status side by side.
Fictional Riverbend cold store. The NPV ranking uses modelled results and illustrative inputs. The network, power flow and voltage scenes show an illustrative case, not Riverbend. All nine designs still need engineering review.
Connected Decisions
Bring The Business Case Into Focus
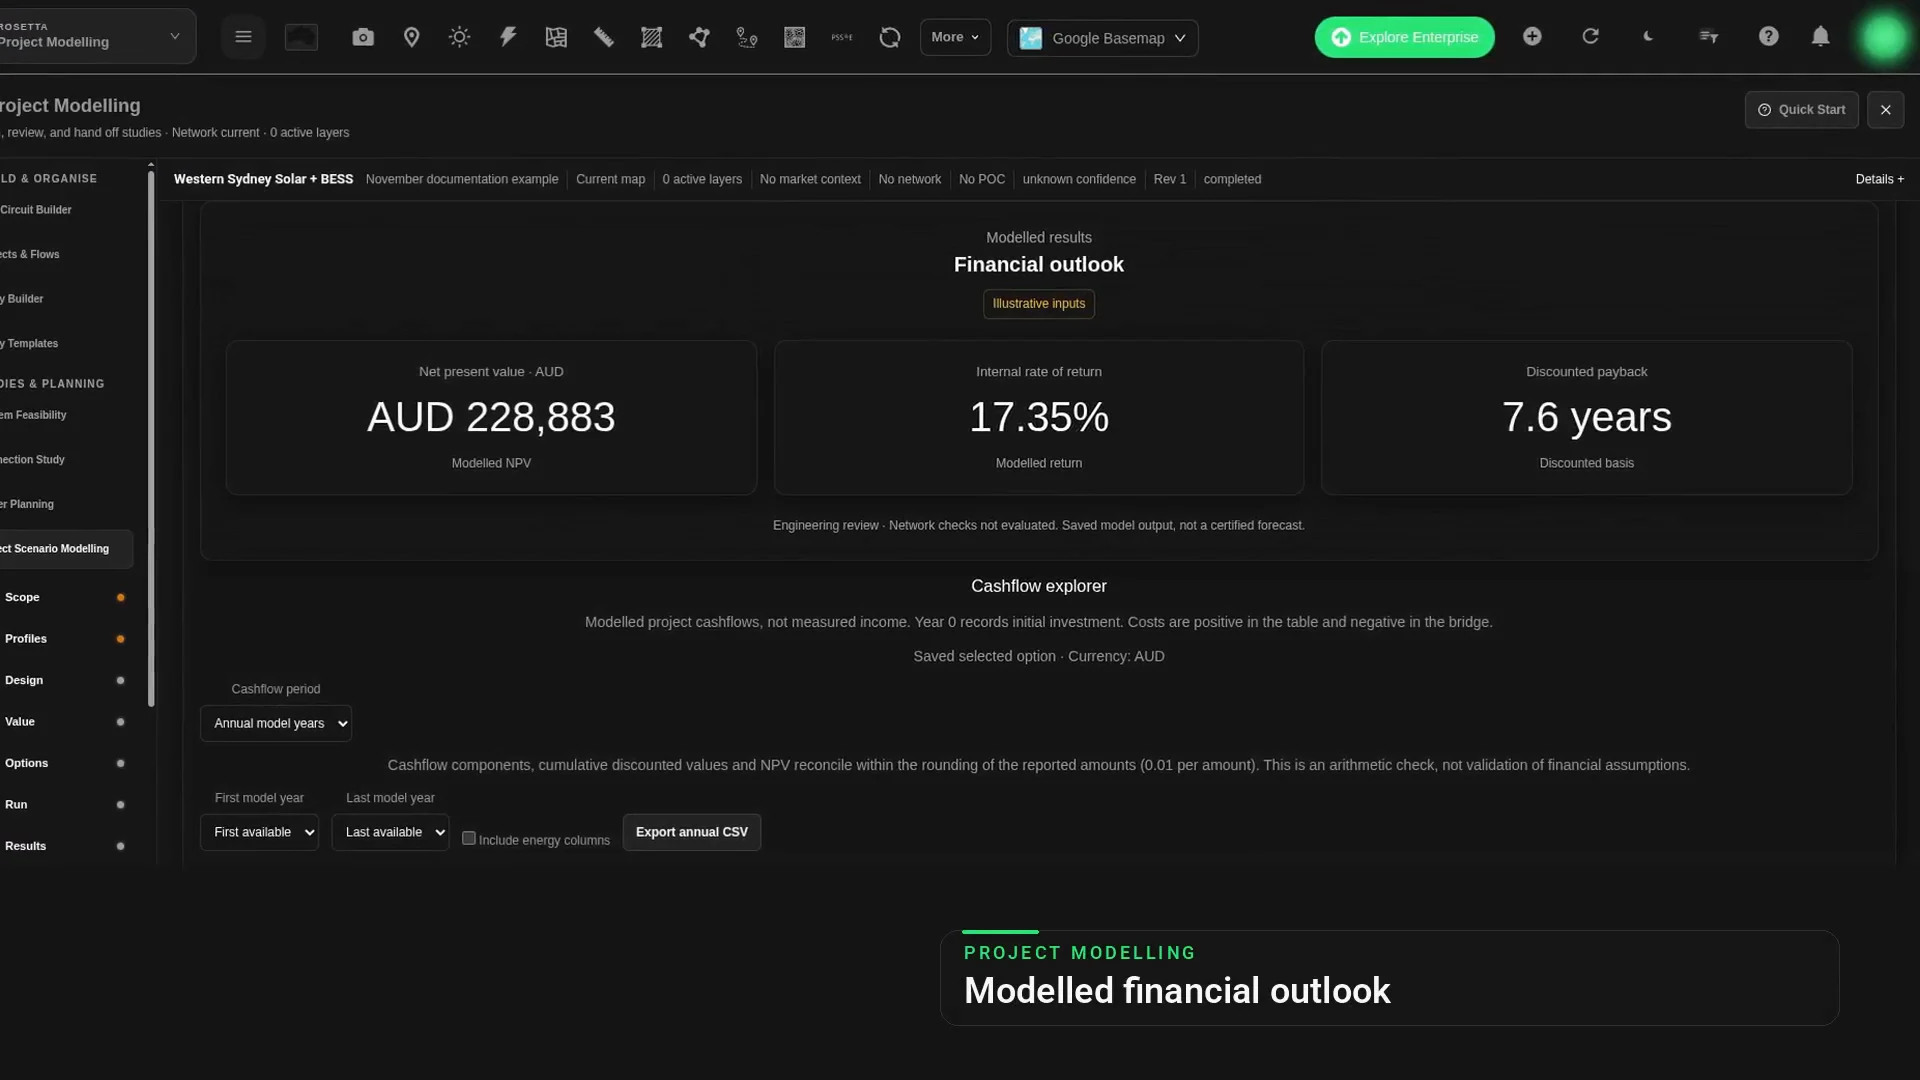
Read modelled net present value, internal rate of return and discounted payback together. Keep financial results linked to the assumptions that produced them.
From Network Context To Project Value
See The Whole Platform
Follow the connected workflow from the grid to the business case.
Explore modelled examples that connect network context, engineering results and project value.
Your Next Decision Starts Here
Bring The Whole Picture Together
Explore network context, compare designs and follow the results through to project value.
Explore Network Map

