

Docs Menu
SWIS Market Views
These views cover the SWIS market: energy and essential service prices, system operations, facility output and market advisories.
Open any view from Markets in the product switcher, then pick the market and the view from the left-hand menu. See the Network Map Markets Guide for the common controls and plan access.
Market
Dispatch Overview
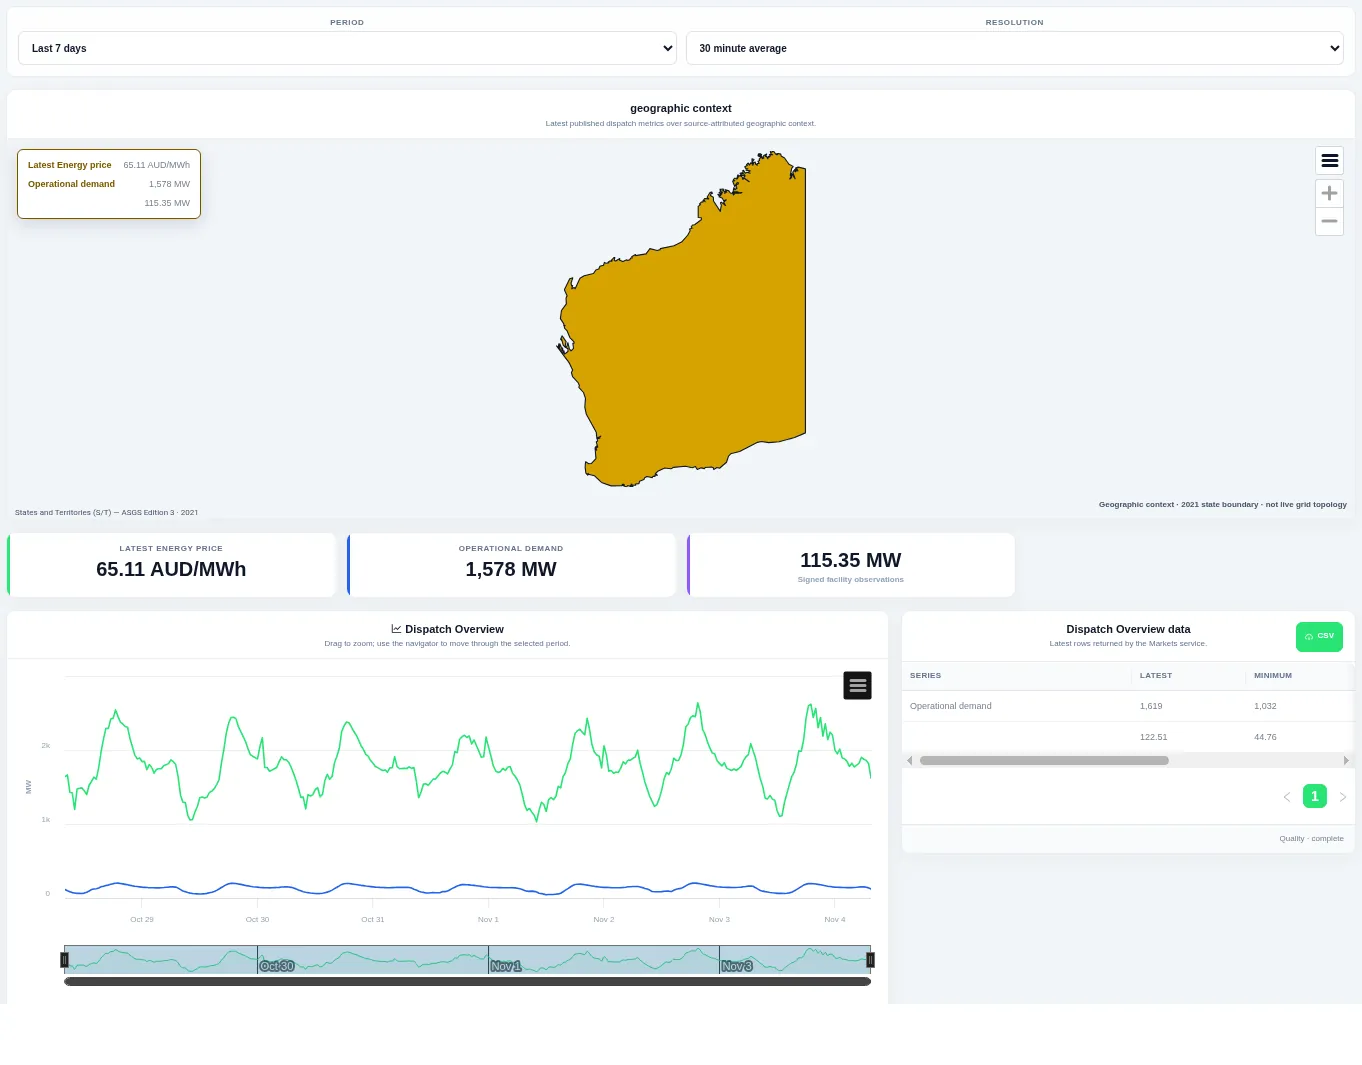
A map with the latest energy price and operational demand, headline cards and a chart of operational demand and facility output over the window. Change the period and resolution; the table on the right gives the latest and minimum values.
Market Snapshot
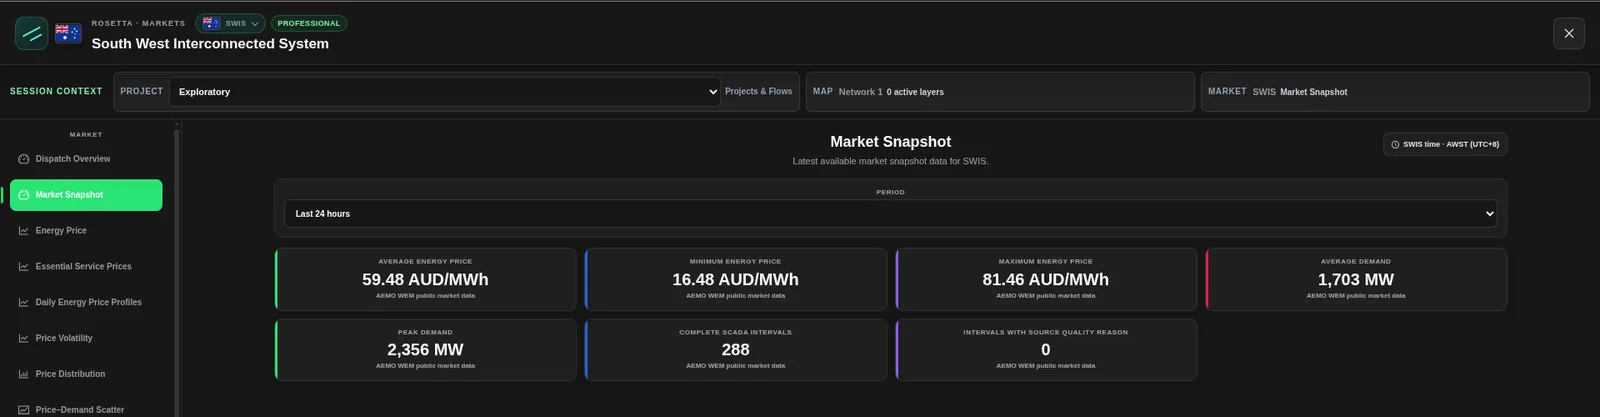
Cards with the latest available snapshot for SWIS over the chosen Period, for example Last 24 hours: average, minimum and maximum energy price, average and peak demand, the number of complete SCADA intervals and the number of intervals with a source quality reason. Each card is labelled AEMO WEM public market data. Times are SWIS time (AWST, UTC+8).
Energy Price
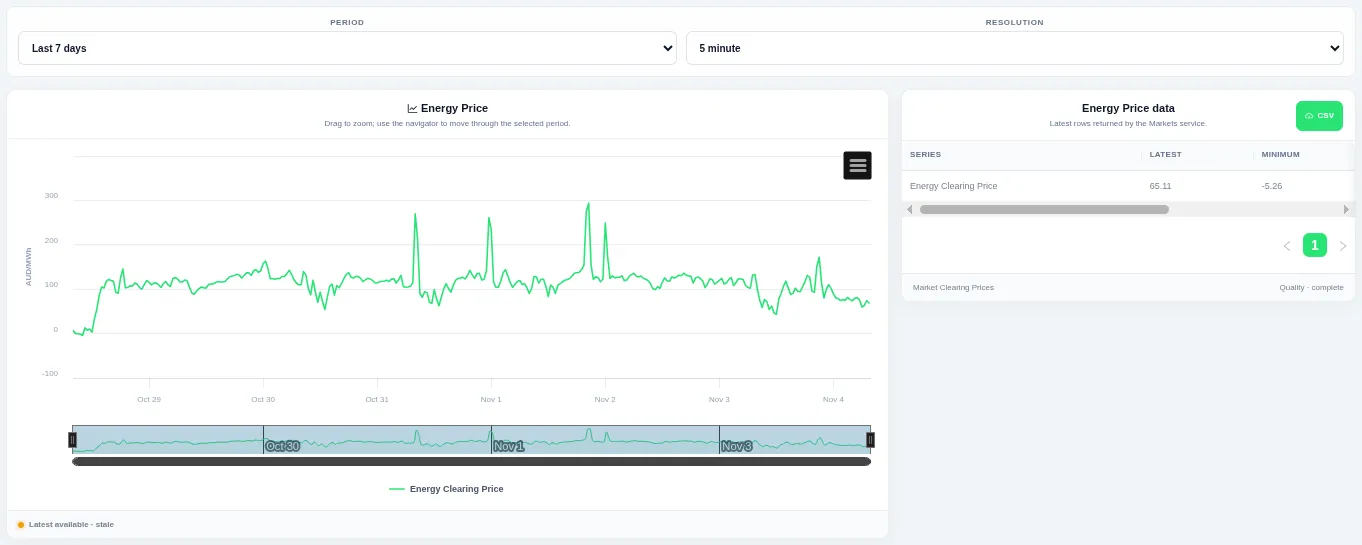
A line chart of the energy clearing price with a data table on the right. Change the period and resolution; drag to zoom or use the navigator.
Essential Service Prices
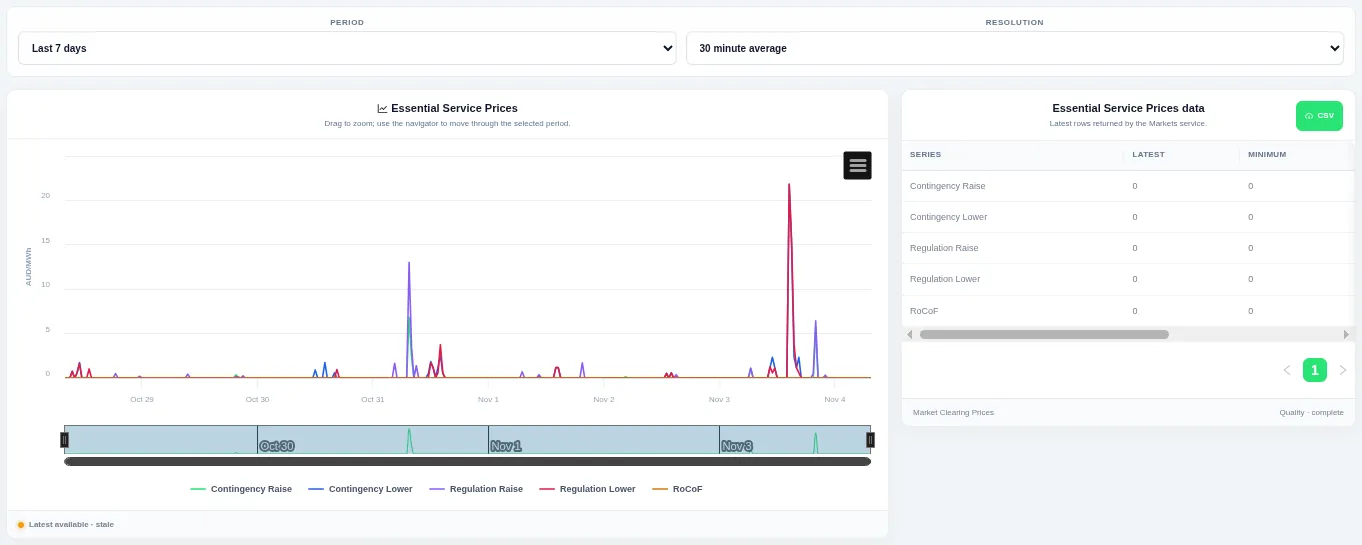
One line per essential system service shows its clearing price over the window, with a data table on the right. Change the period and resolution.
Daily Energy Price Profiles
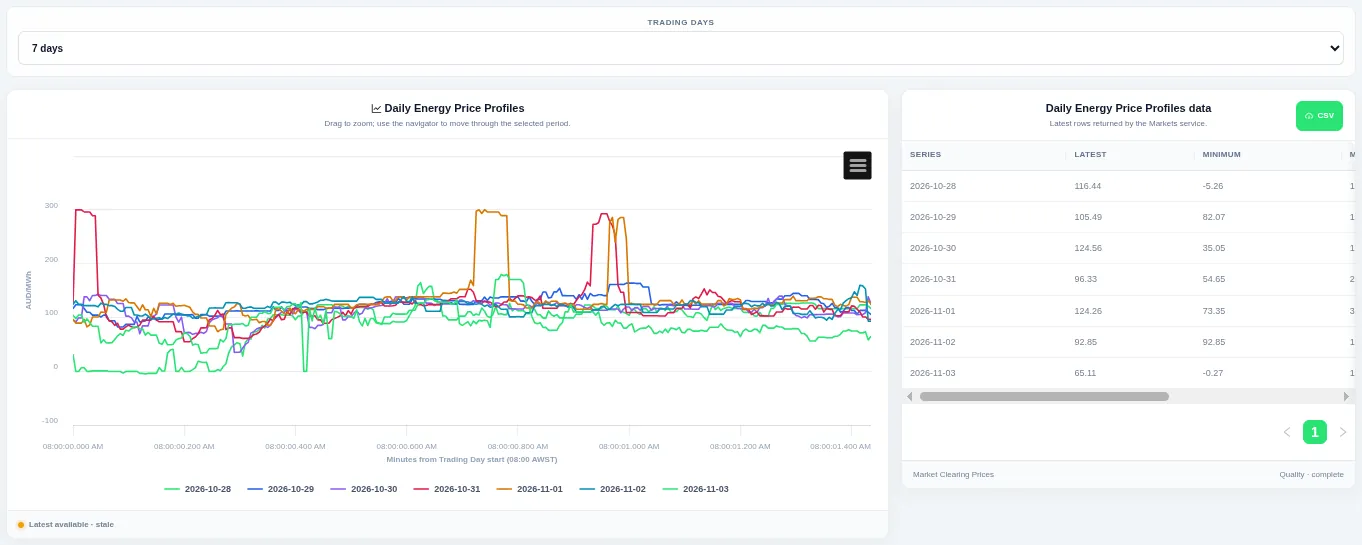
Each line is one trading day of energy price laid over the same time-of-day axis. Change the number of days.
Price Volatility
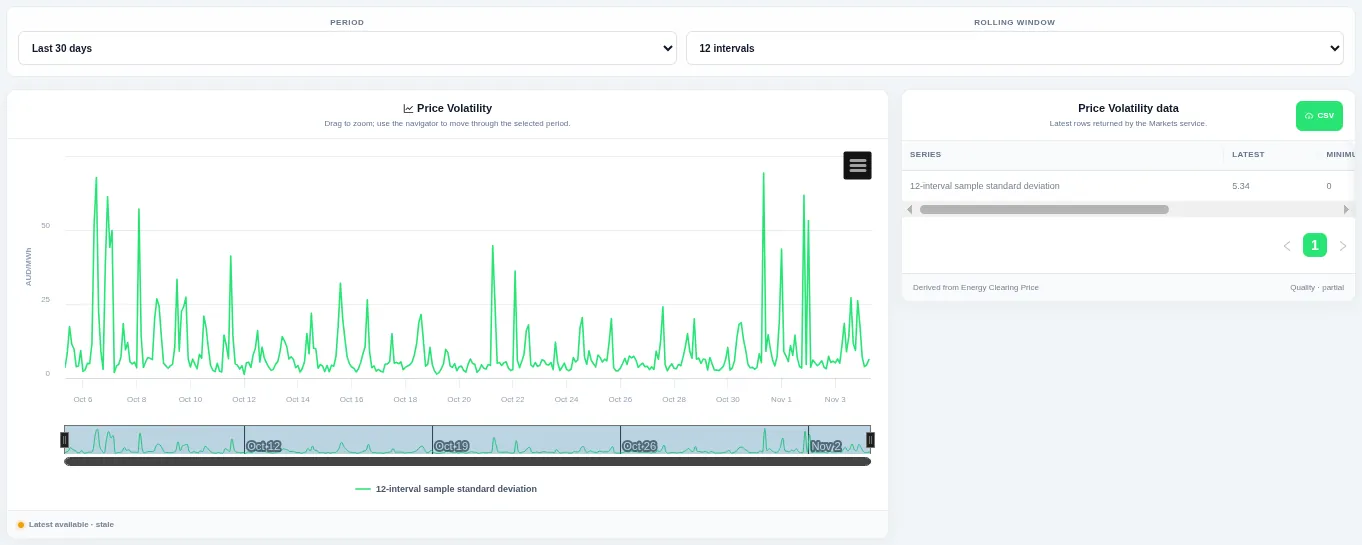
The chart shows the rolling standard deviation of energy price over the chosen window length. Change the period and window.
Price Distribution
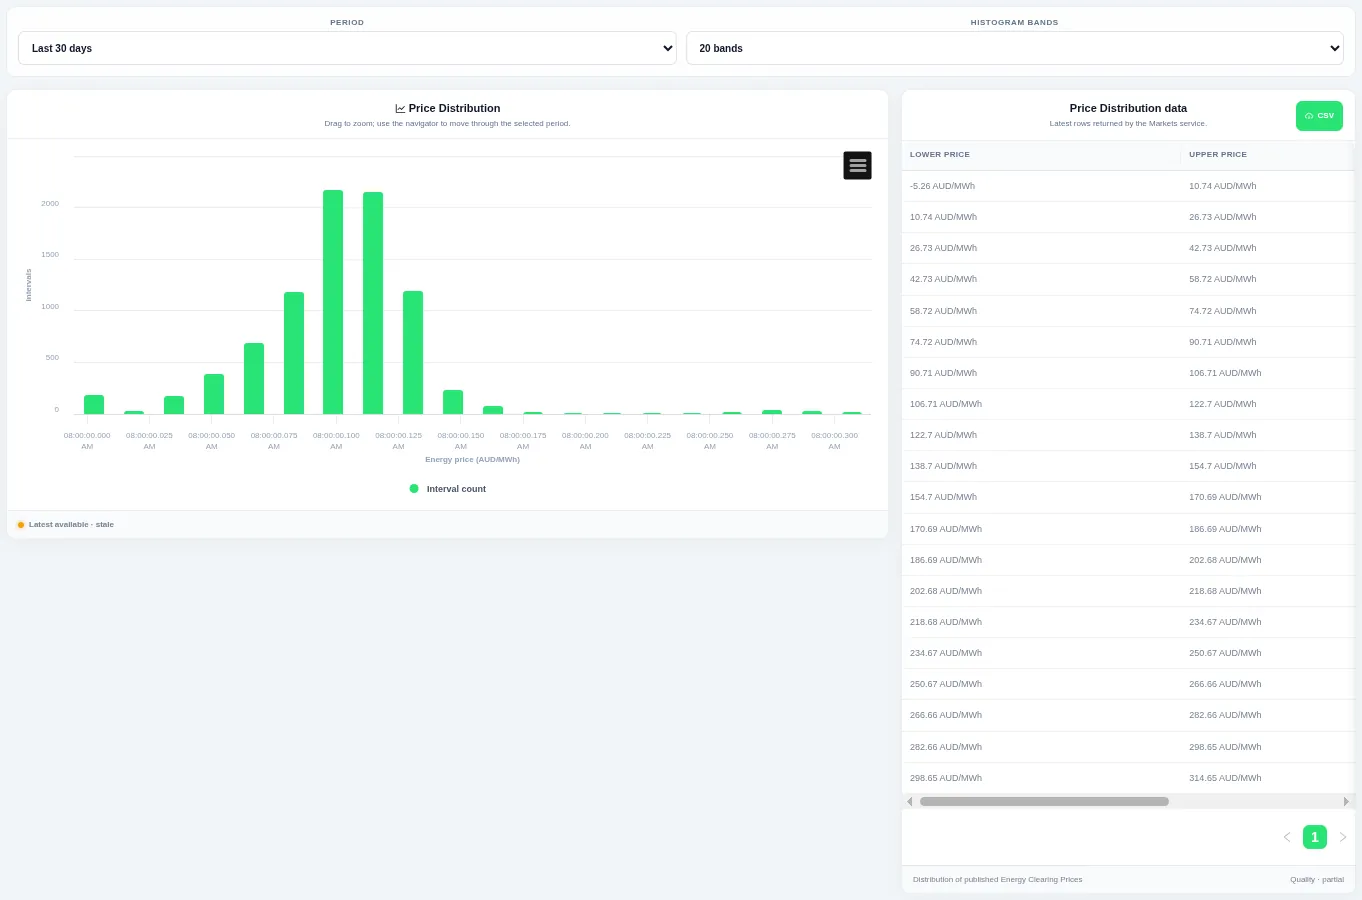
Energy prices are counted into equal-width bands, and the table lists the lower and upper price of each band. Change the period and number of bands.
Price–Demand Scatter
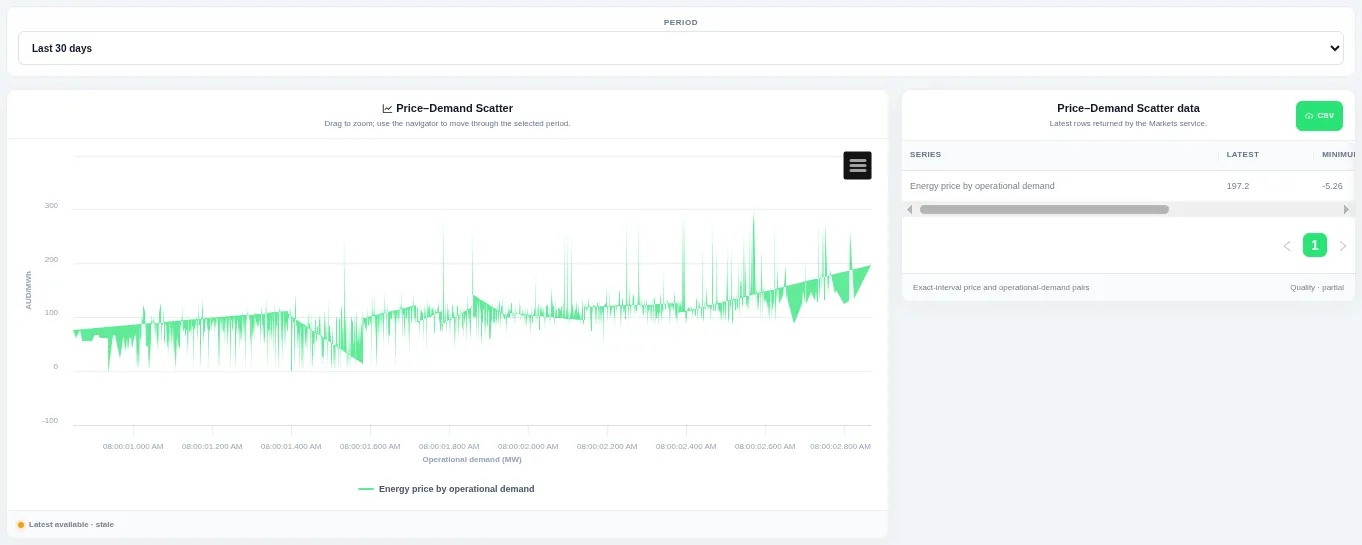
Each point is one interval placed by operational demand and energy price. Change the period.
Reference Trading Price
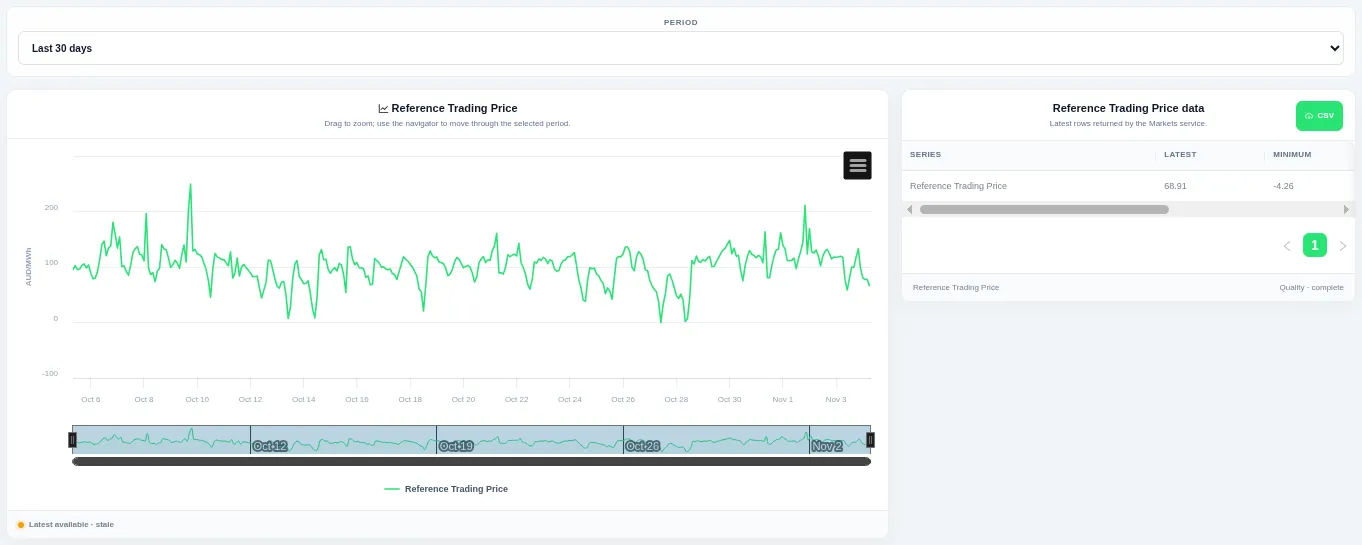
A line chart of the reference trading price with a data table. Change the period.
System Operations
Demand & Net Facility Output
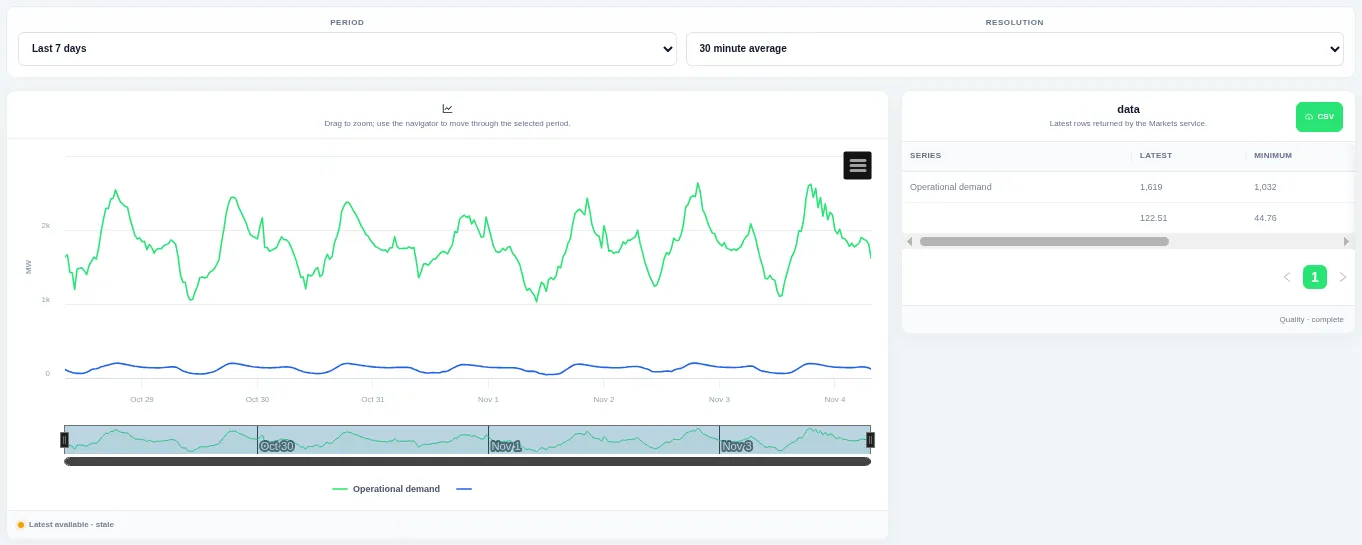
Lines show operational demand and the total net output of facilities on the same chart. Change the period and resolution.
Operational Demand & Withdrawal
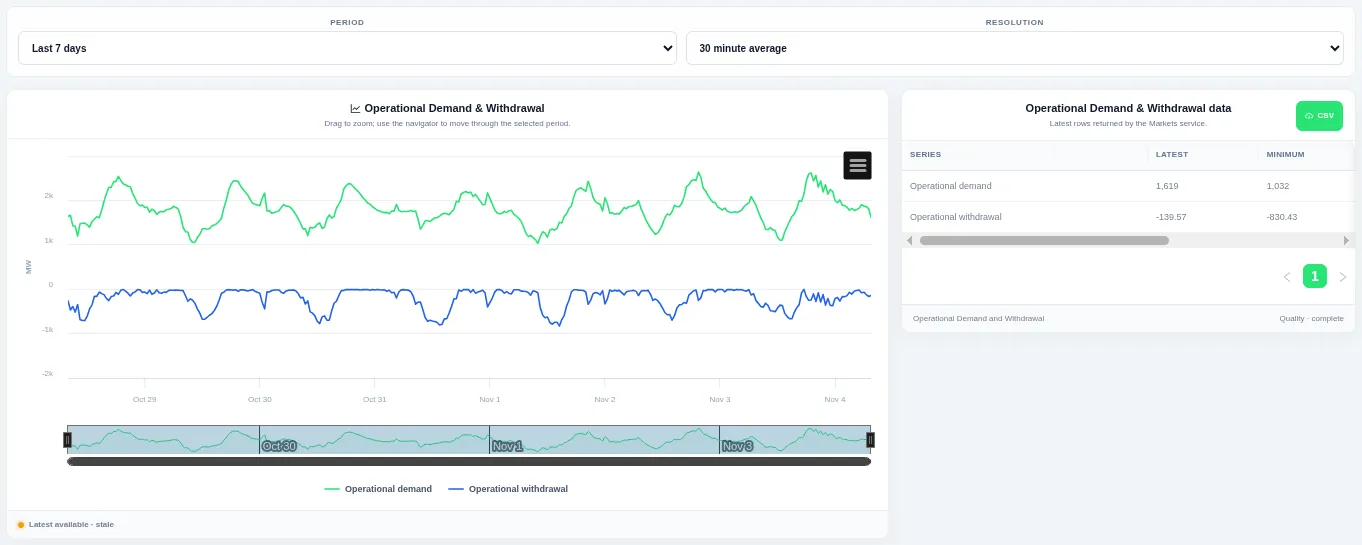
Lines show operational demand and withdrawal over the window, with a data table. Change the period and resolution.
Net Facility Output
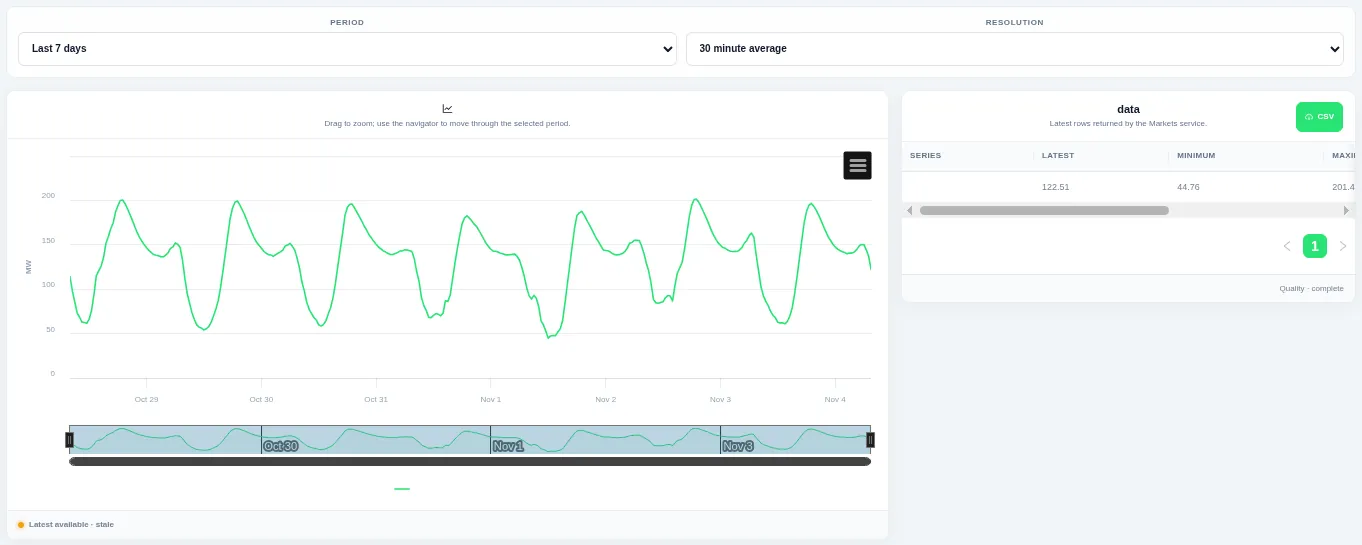
A line chart of total net facility output with a data table. Change the period and resolution.
Market Requirements
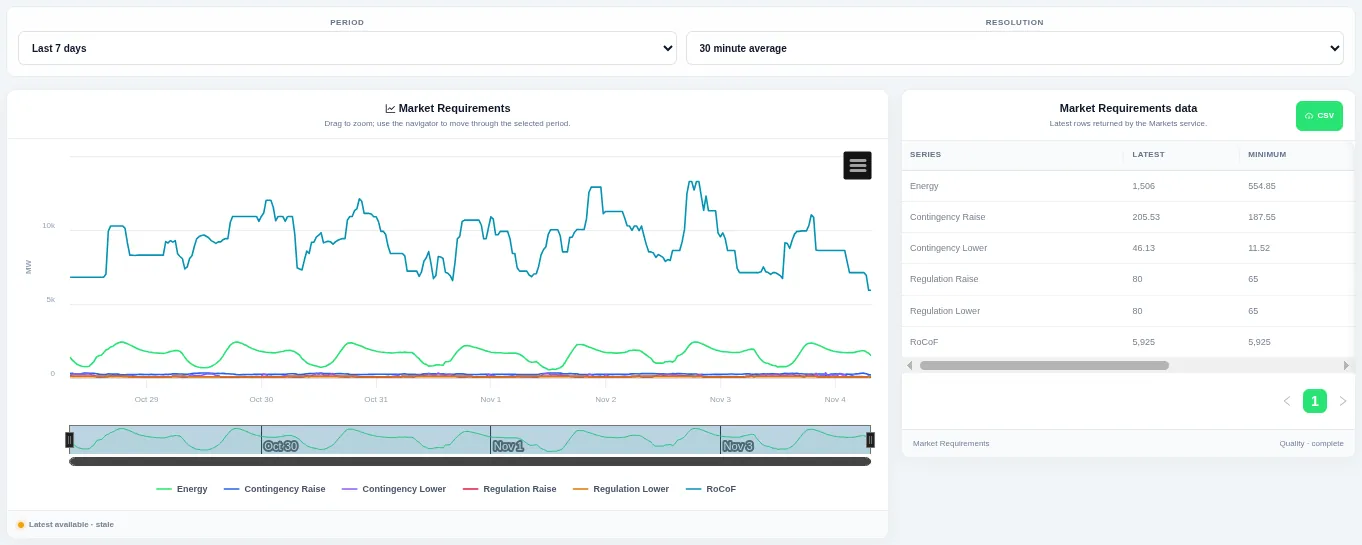
One line per requirement shows the quantity needed in each interval. Change the period and resolution.
Facilities & Participants
Facility Output
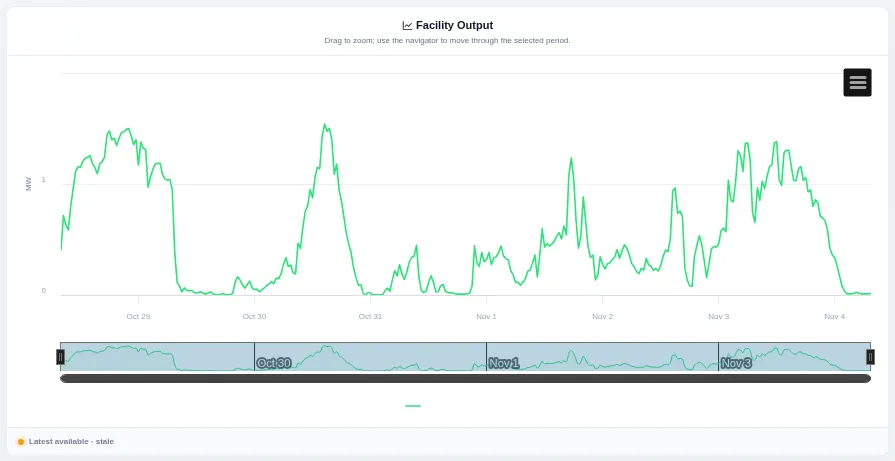
A line chart of one facility's output across the window. Choose the facility, period and resolution.
Facility Output Changes
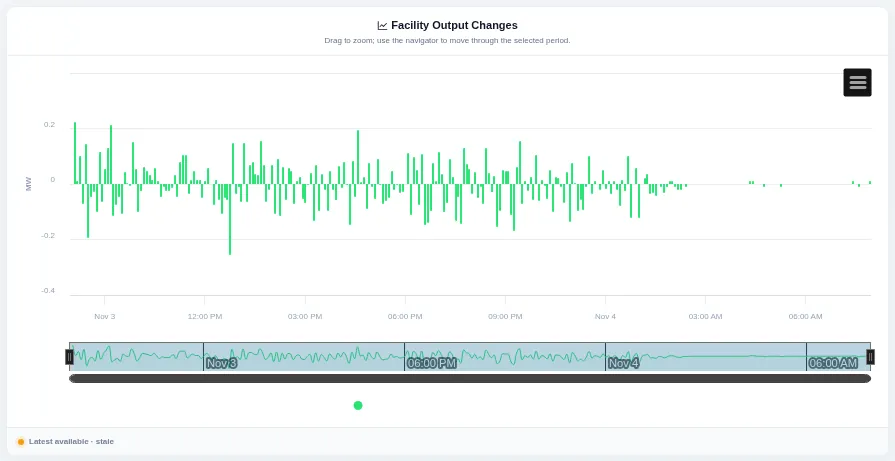
Columns show how much the selected facility's output changed from one interval to the next. Choose the facility and period.
Fleet Status
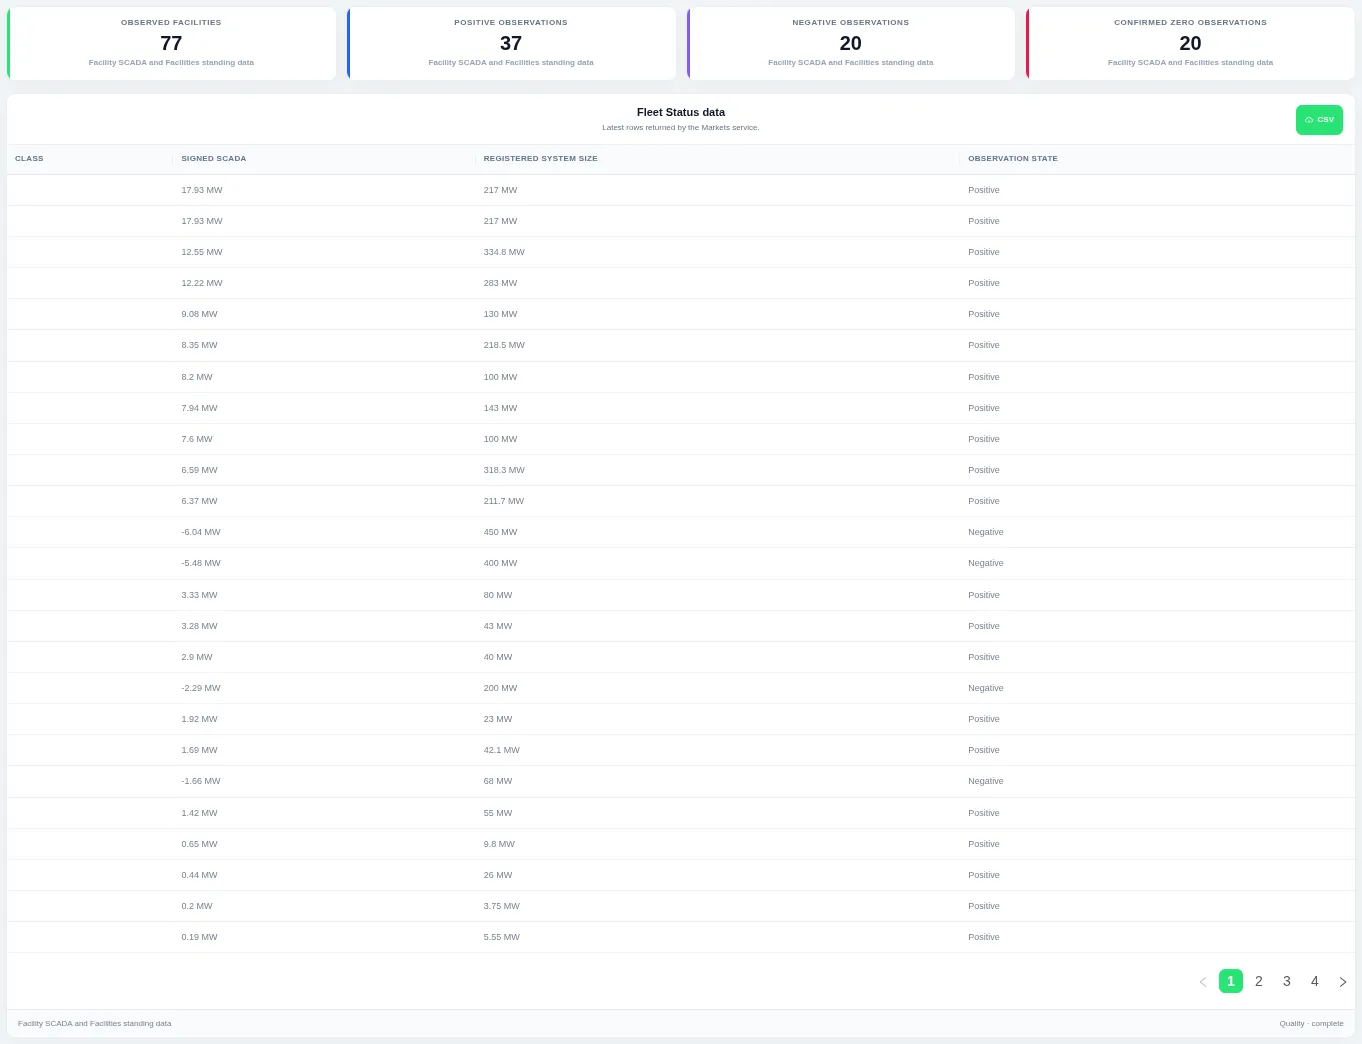
Cards count facilities with positive, negative and zero output, and the table lists each facility's signed output, registered size and observation state. Page through the table or export it as CSV.
Participant Operations
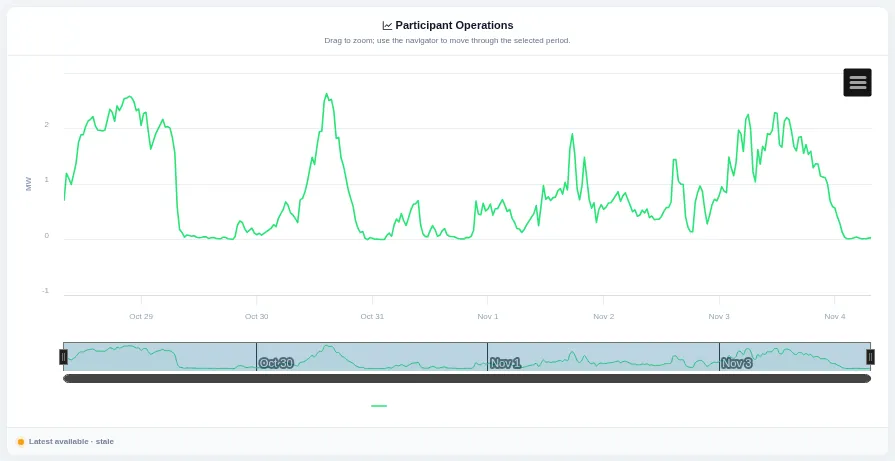
A line chart of the total output of the chosen participant's facilities. Choose the participant, period and resolution.
Market Information
Market Advisories
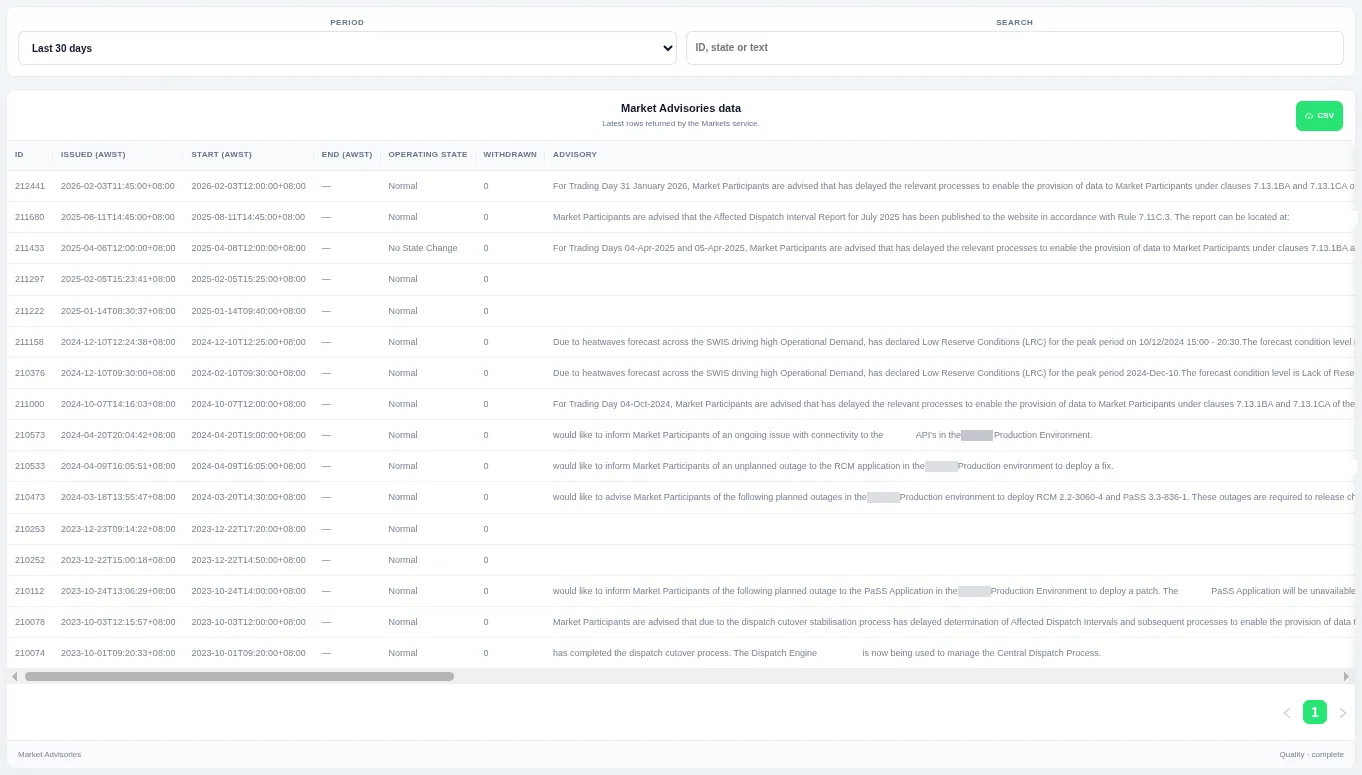
A table of market advisories with issue time, start and end, operating state and text. Change the period or search by ID, state or text.


