

Every Network, Site and Layer on One Map
Find power for any site in minutes. Transmission and distribution networks, substations, generators, projects and land layers in 225 countries, with spatial tools that measure, rank and map catchments right next to the grid.
Built on network operator and government data • ISO/IEC 27001 certified • Cancel anytime
Built for Developers · Data Center Teams · Engineers · Investors
Every Network on One Map, in 225 Countries
Transmission, sub-transmission and distribution networks, substations, power stations and renewable projects sit on one live map, with gas, water, telecommunications and data centers alongside where they are published.
- Layers organised by country, region and network business
- Detailed layers you can click for each asset’s attributes
- Network data refreshed daily
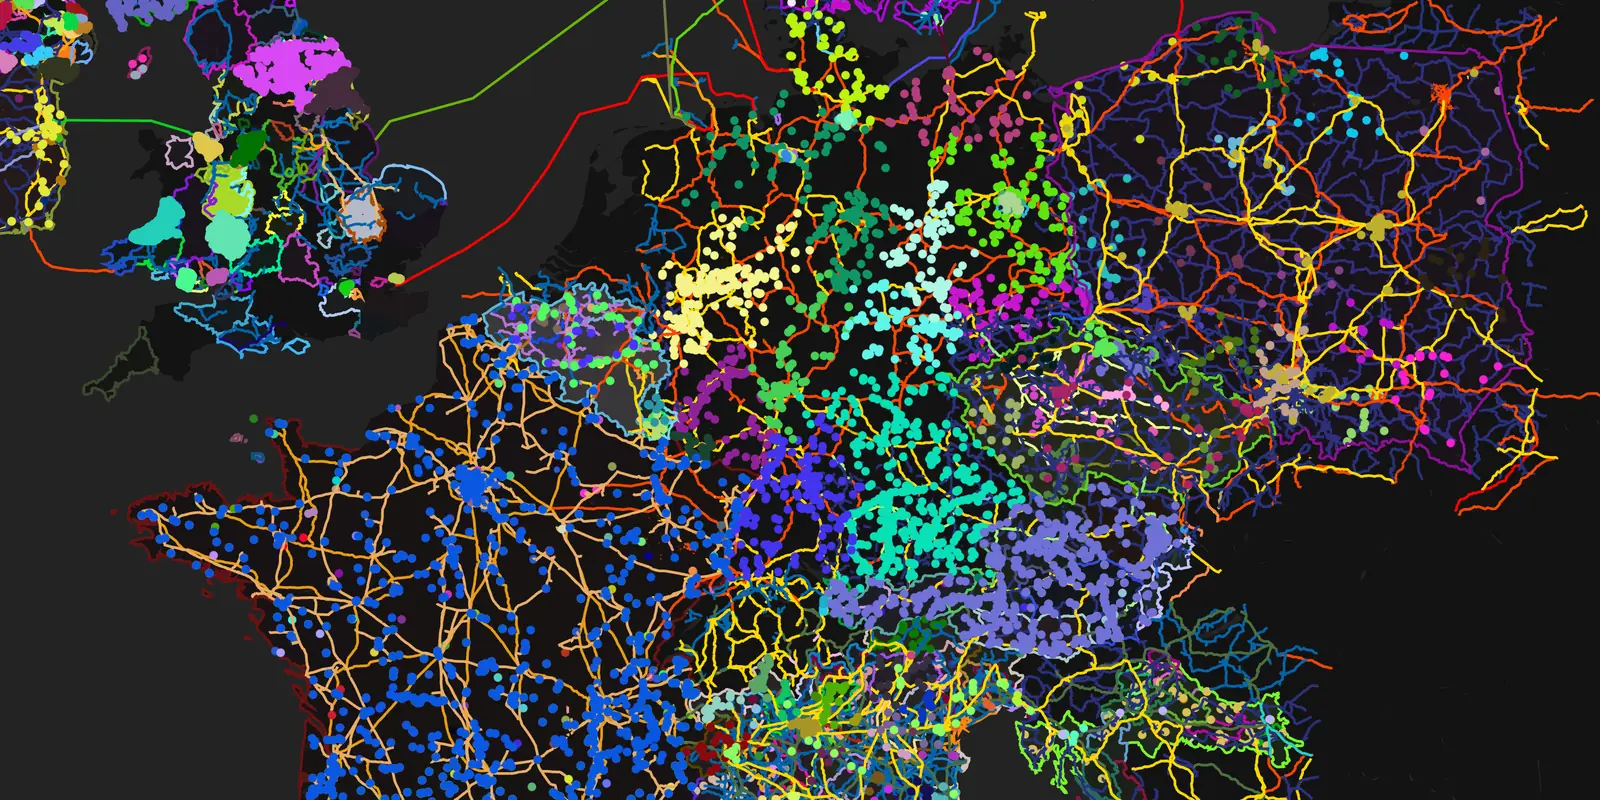
- Dark full-screen map, wide view of one continent with transmission layers on
- Slow eased push-in to a dense metro network
- Hold as substations and lines resolve
Smart Spatial Search and Layer Control
One search box finds places, networks, layers and named assets together. Pick a substation by name and its layer switches on. Right-click anywhere to see every network layer within about 5 km and turn it on in one click.
- Places, networks, layers and assets in one result list
- Search by latitude and longitude
- Network Filter, Recently Viewed and Pinned Networks
- Autoload Layers and Autoload Details as you move the map
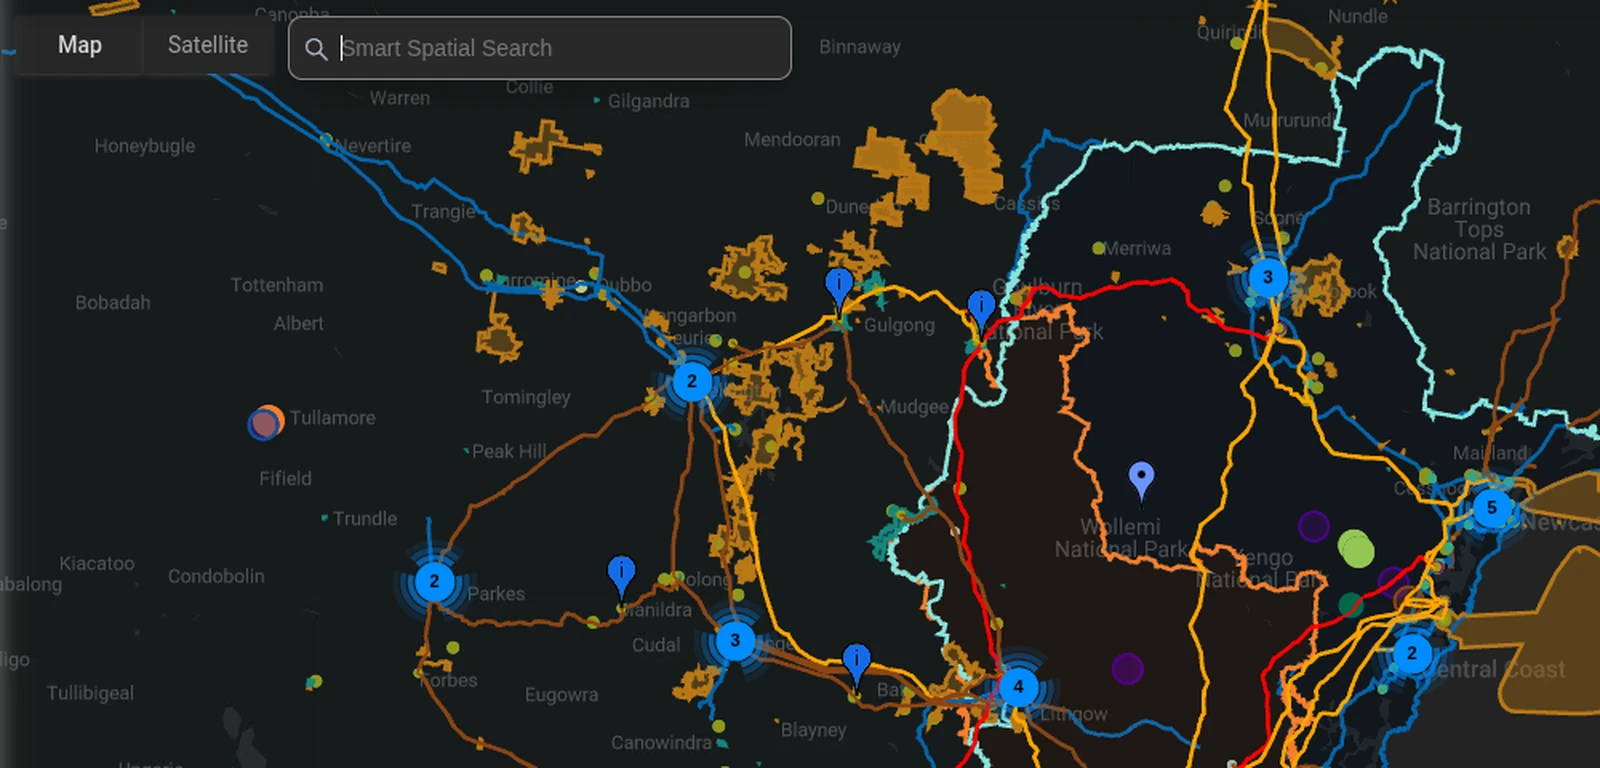
- Type a substation name into Smart Spatial Search; results show Network and Places tags
- Choose the asset; the map flies to it and its layer switches on
- Right-click nearby: the Nearby Layers menu lists the networks around the point
Saved Views, Favourites and Portfolios
Save the map exactly as you set it up: camera, layers and filters under a name. Keep favourite networks, stations, data centers, regions and Grid Constraints one click away, and group the assets you track into portfolios.
- Named saved views, applied in one click
- Favourite networks, stations, data centers, regions and constraints
- Favourite portfolios kept with your account on every device
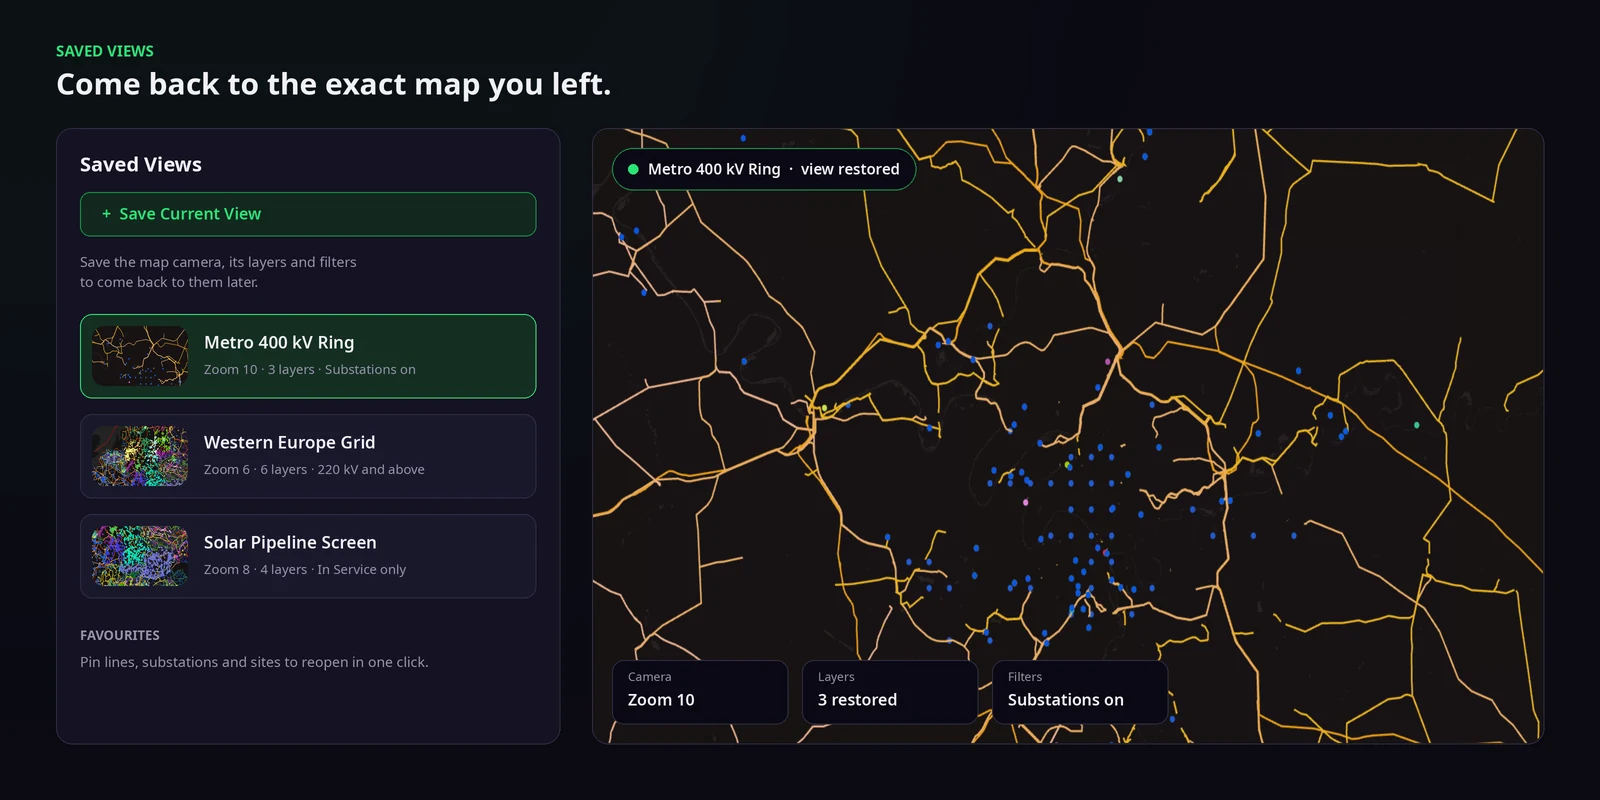
- Sidebar Saved Views open on the dark map (names generic, no personal data)
- Click a saved view: the camera and layers change to it
- Open a favourite; the map flies to it
Measure, Draw and Read the Land
Measure the distance from a site to the nearest line, draw the outline of a parcel and read its area, drop a pin for an address and load the land parcel at any point where parcel data is published.
- Measure Distance in kilometres and miles, along the earth’s surface
- Measure Area and Measure Polygon with the length of each edge
- Address pins and Land Parcel details
- Map screenshots saved as PNG
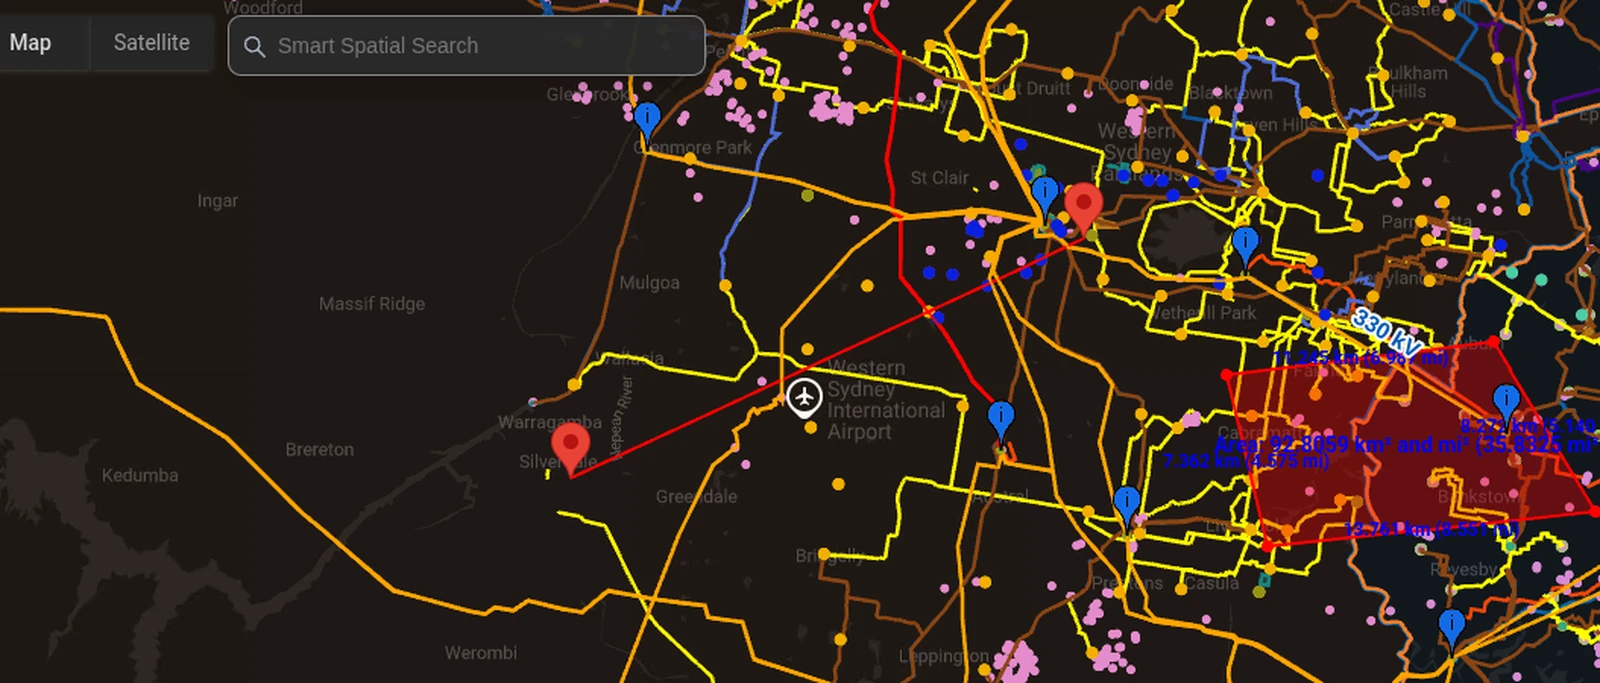
- Dark map over a candidate site next to a transmission line
- Measure Distance: click the site, then the line; the label shows km and miles
- Measure Polygon around the site; the area label updates as corners move
Nearest Neighbour and Voronoi Catchments
Click a site to highlight the ten nearest substations, poles or power stations with their distances. Draw a Voronoi diagram to see which substation is nearest to every part of a region.
- The ten nearest point assets to any location, with distances
- Voronoi catchments for up to 500 points in view
- Works on any loaded point layer, including your own
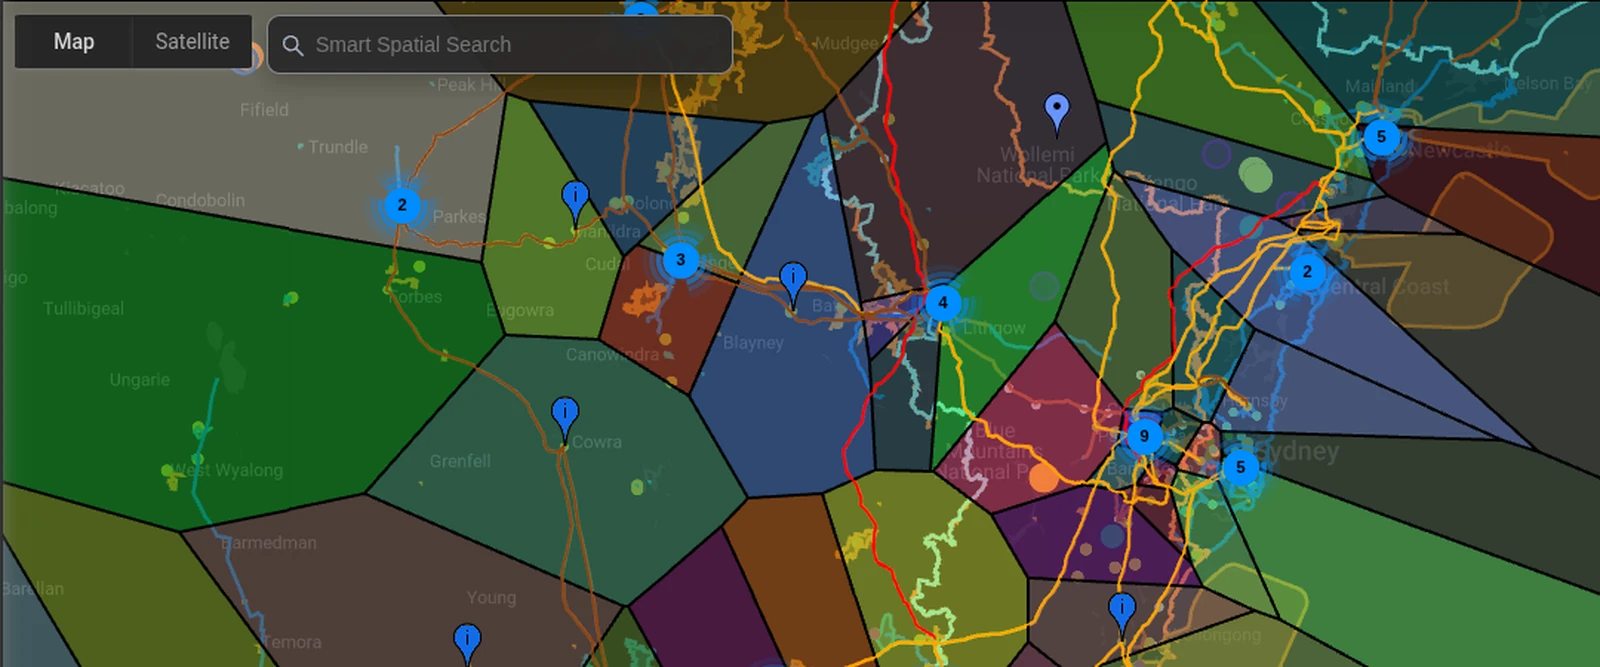
- Dark map with a zone substation layer loaded
- Nearest Neighbour: one click, ten substations highlight with distances
- Voronoi Diagram: catchment cells draw across the region
Photorealistic 3D, Street View and Basemaps
Change what sits under the network: satellite, topographic, terrain, ocean, night lights, Sentinel-2 and active fire data. Switch to photorealistic 3D to read the landform around a site, or drop into Street View to see the poles and substations from the road.
- Satellite, topographic, terrain and ocean basemaps with adjustable opacity
- Photorealistic 3D with the network drawn on top
- Street View at ground level next to any asset
- Default, light and dark map styles
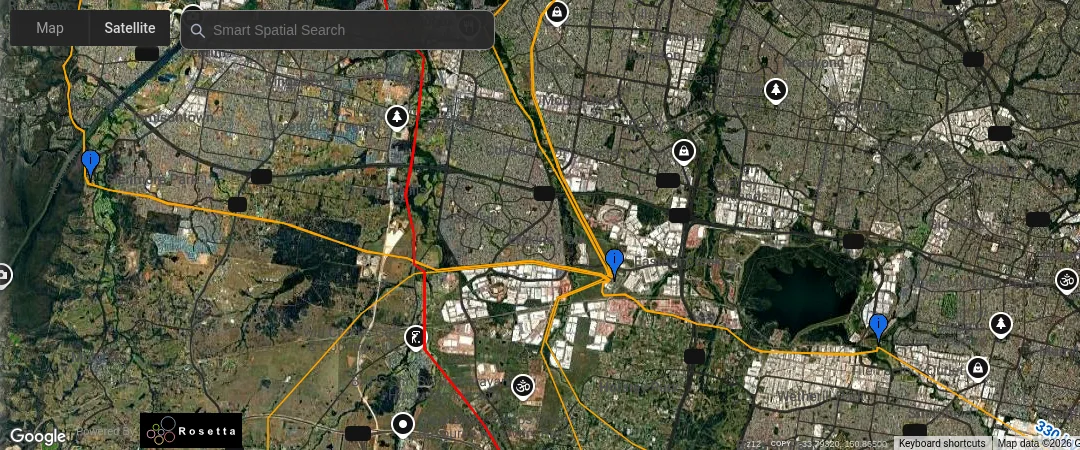
- ESRI Terrain basemap under a transmission corridor
- Switch to 3D; slow tilt and rotate along the line route over the hills
- Cut to Street View at a substation fence
Site Selection for Data Centers and Projects
Build a long list of sites near high-voltage transmission, check the distance to the nearest substations, read the land and compare candidate markets. The global Data Centers layer shows existing clusters and neighbours.
- Existing data centers worldwide on the same map as the grid
- Transmission, substations, power stations and renewable projects nearby
- Upload your candidate sites as SHP, GeoJSON or KML
- Wholesale prices and demand compared in Network Map Markets (Pro)
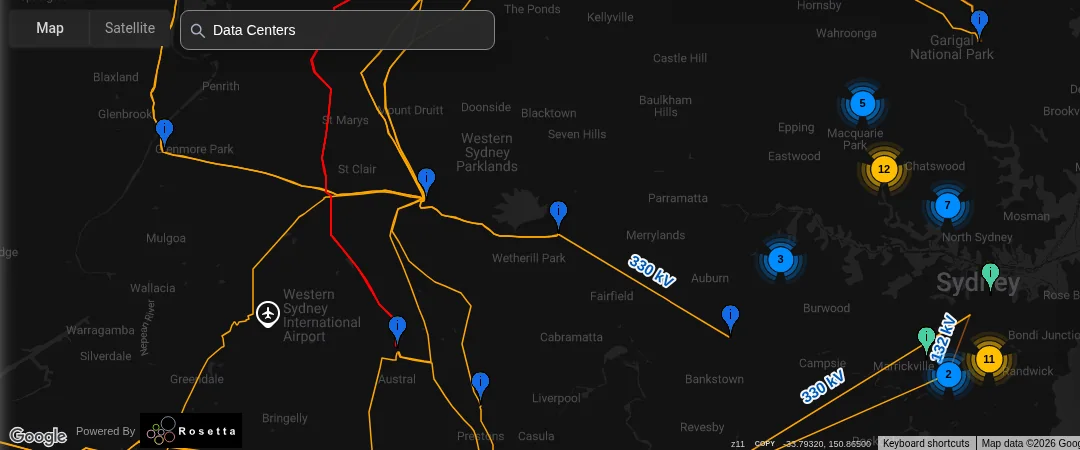
- Data Centers layer on the dark map over a metro area
- Pan to a corridor where high-voltage lines run near open land
- Uploaded candidate sites appear against the network
Single-Line Diagrams, Studies and Exports
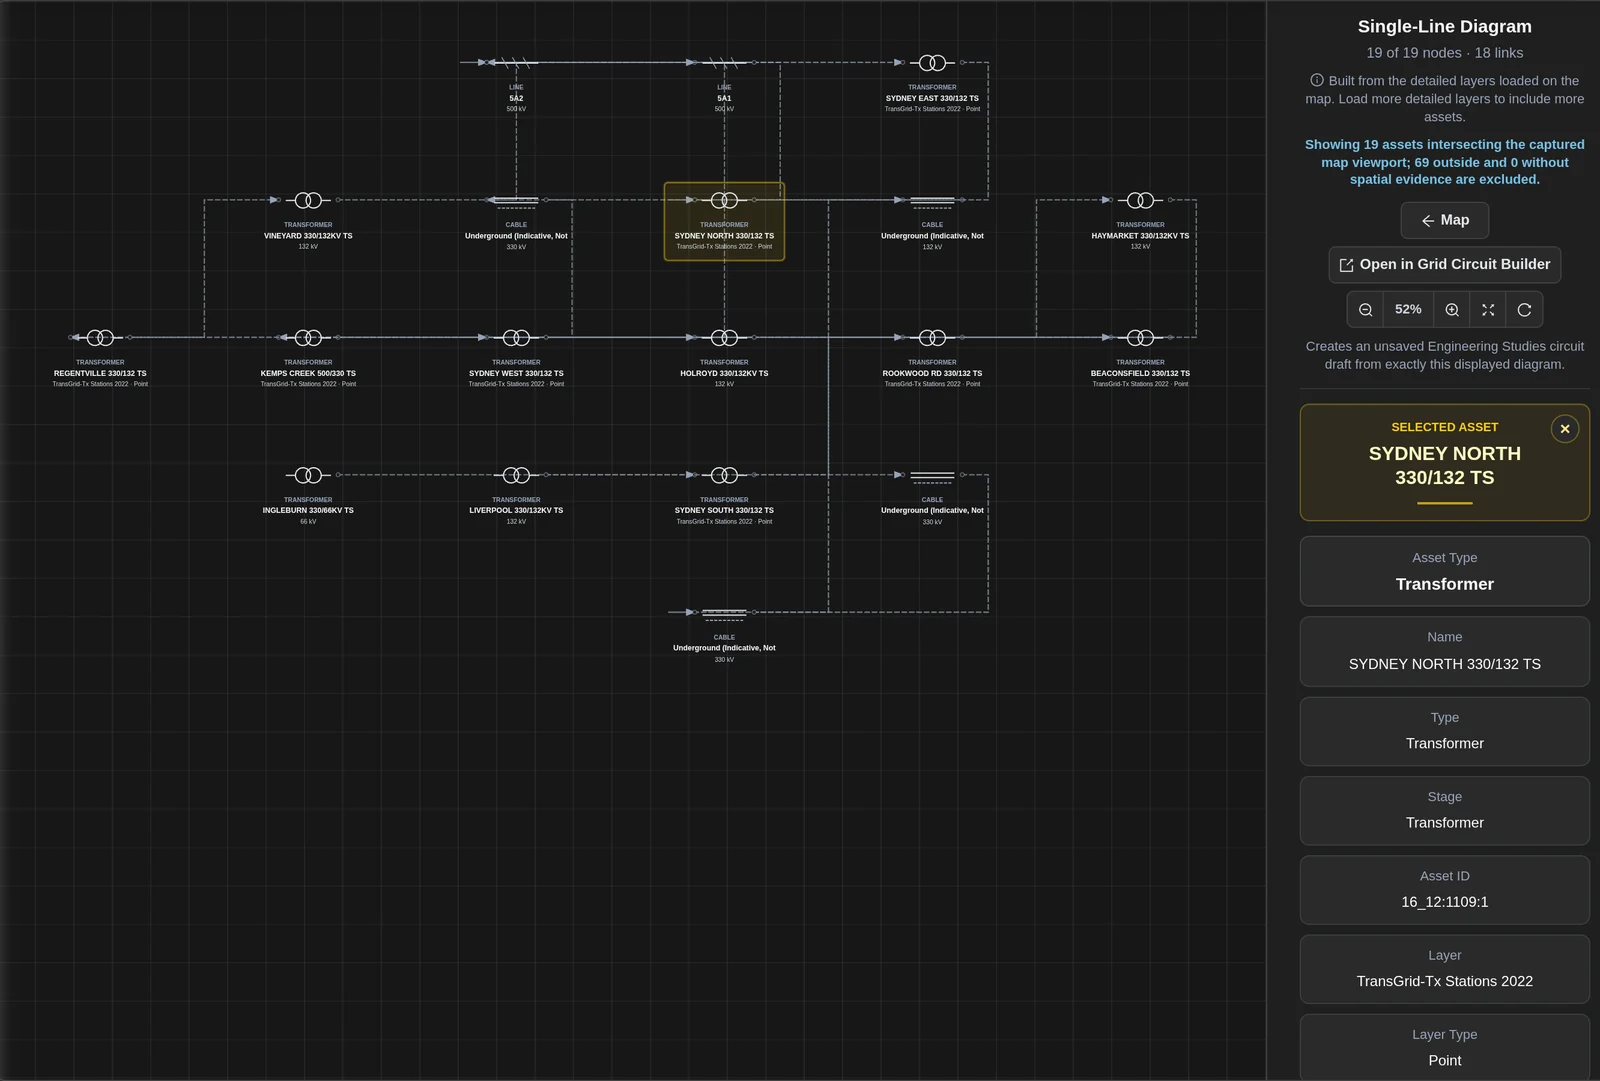
Turn the network in view into a single-line diagram, open it in Grid Circuit Builder and run power-flow, hosting capacity and contingency studies. Export the network as PSS®E, asset tables as CSV and study packages for the tools your engineers use.
- Single-line diagrams built from the detailed layers on the map
- Engineering Studies with 11 study types and a choice of engines
- Quick PSS®E export of the network in view
- Study packages for six engineering and planning tools, plus a Python analysis pack
- Dark map with detailed lines and substations loaded
- Choose Single-Line Diagram; the diagram builds from the network in view
- Open in Grid Circuit Builder; cut to the study results
Public API and Integrations
Take the data wherever your team works. The free public API serves the project register and five-minute unit output with no key. Load it into QGIS, ArcGIS, Power BI or Excel, and connect AI assistants to Network Map over MCP on Pro.
- Free public API in GeoJSON, no key needed
- QGIS, ArcGIS, Power BI and Excel
- MCP server for AI assistants with labelled, expiring tokens (Pro)
- SHP and GeoJSON export and the Enterprise API (Enterprise)
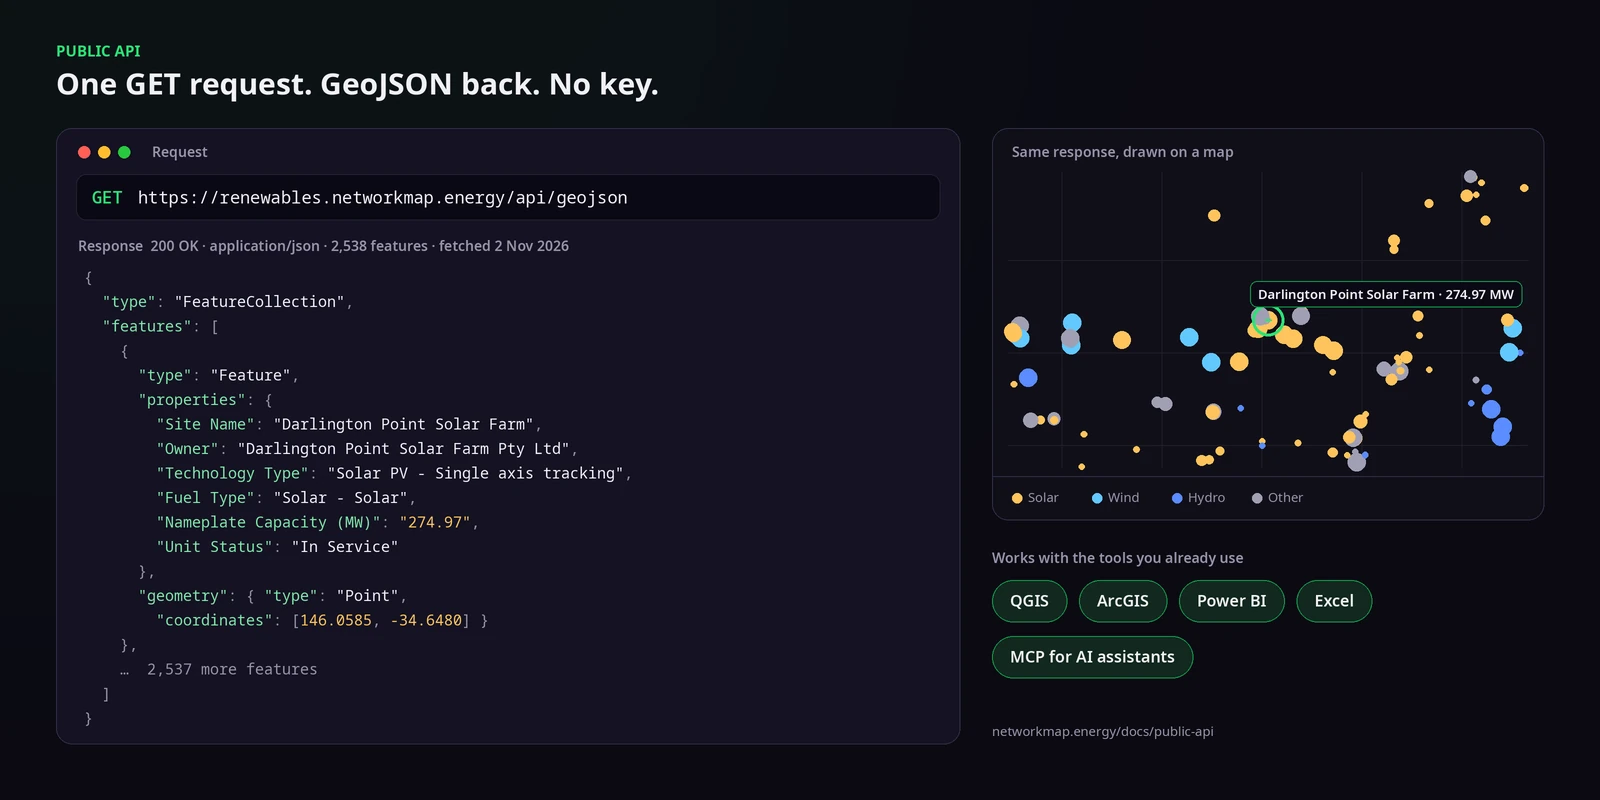
- GeoJSON from the public API drawn as a layer on the dark map
- Cut to the same data in a spreadsheet
- Hold on the map with the projects coloured by technology
Grid Operations on the Same Map
Switch on headroom colouring and every Grid Constraints path takes the colour of its tightest constraint. Line Flow colours key transmission lines from loose to binding, right next to the sites you are screening.
- 1,055 transmission paths mapped to Grid Constraints
- Headroom colouring from binding to loose
- Measured line flow and ratings on the same map
- See Grid Operations
- Wide view of the network coloured by headroom
- Eased zoom from a candidate site to the nearest tight line
- Hold on the line and the site together
More From the Map
Tools that sit on the same map and the same account.
Upload Custom Layers
Bring candidate sites, project boundaries and land holdings onto the map as SHP, GeoJSON or KML and see them against every network.
Building-Level Solar Analysis
Click a rooftop for system size, panel count, roof area, annual output and CO₂ offset, right next to the network that would connect it.
Network Profiles and Country Pages
A public profile for every network operator, with headline figures and key assets that open straight on the live map.
Current Project and Shared Workspaces
Choose a Current Project and your map scope, market context and studies stay together. Share workspaces with viewer and editor access.
Weather and Context Layers
Temperature, rainfall, wind and cloud load like any other layer, next to terrain and satellite basemaps.
Mobile App
Network Map on iOS and Android. Use Locate me in the field to see the nearest lines, poles and substations around you.
Built on Network Operator and Government Data
Every figure below comes from our own documentation and the live portal. Each one is dated.
Who It’s For
Renewable Developers
Rule sites in or out before the studies start.
- Nearest substations with distances
- Voronoi catchments across a region
- Headroom on Grid Constraints paths nearby
- Network Map for Developers
Data Center Teams
Find power, land and fibre for every candidate site.
- Global Data Centers layer next to the grid
- Distance to high-voltage transmission
- Terrain, 3D and Street View checks
- Network Map for Data Centers
Engineers and Consultants
Go from the map to a model in one place.
- Single-line diagrams from the network in view
- Quick PSS®E export and CSV tables
- Study packages for your engineering tools
- Network Map for Consultants
Investors and Analysts
Read a portfolio against the grid around it.
- Favourite portfolios and saved views
- Public profiles for every network operator on the map
- Power stations and renewable projects on one map
- Network Map for Investors
Included with Pro
Nearest Neighbour, Voronoi catchments, saved views and favourites, single-line diagrams, Engineering Studies, PSS®E and CSV exports, the MCP server and Grid Operations are part of Pro and Enterprise. Smart Spatial Search and the measuring tools work on a free account.
Frequently Asked Questions
Where does the data come from?
From network operators and government datasets, structured by our own pipeline. The network data is refreshed daily.
Which countries are covered?
225 countries, with a public profile for every electricity network operator on the map.
Which spatial tools are on Pro?
Nearest Neighbour and Voronoi Diagram are Pro tools, along with saved views, single-line diagrams, Engineering Studies and exports. Measure Distance, Measure Area, Measure Polygon, Address and Nearby Layers work on every plan.
Can I bring my own data?
Yes. Upload SHP, GeoJSON or KML files and they appear on the map against every network, stored with your own account.
How do I get the data into my own tools?
Use the free public API in QGIS, ArcGIS, Power BI or Excel, export CSV and PSS®E on Pro, or use SHP, GeoJSON and the Enterprise API on Enterprise.
How does this connect to Grid Operations?
It is the same map. Headroom colouring, Line Flow and Grid Constraints sit next to your sites and spatial results. See Grid Operations.
Do I need a demo to start?
No. Sign up free and upgrade to Pro when you are ready. It is self-serve: pay by card or company invoice.
Learn Each Tool
Step-by-step guides for every view on this page.
Start Free, Upgrade When You Need the Spatial Tools
Self-serve: pay by card or company invoice, no demo needed · Cancel anytime


