

Docs Menu
Comparison and Reports
Compare financial outcomes against engineering gates and export the evidence for the selected case revision and run.
Watch the Video: Plot Studio & Engineering Reports (1:10)
Use a consistent comparison basis
Complete the workflow in Project Modelling. Compare options with the same currency, horizon, price basis, baseline, and network scope unless the changed assumption is the purpose of the comparison.
- Review finance assumptions and asset costs.
- Set the technical option ranges in Options.
- Select Rank feasible solutions by.
- Save and run the current case.
- Open Summary and review the engineering gates before the financial ranking.
- Pin the options that need further review.
- Check the financial and carbon results before exporting.
Detailed assessment supports option sweeps. Quick assessment screens the current design. See Options and Results for sweep fields, run controls, limits, and technical checks.
Financial ranking
The default ranking metric is NPV. The metric orders options within the engineering gate groups; a high NPV does not remove a network constraint.
| Ranking choice | Preferred direction | Read with |
|---|---|---|
| NPV | Higher | Capital costs, discount rate, and annual cash flows. |
| IRR | Higher | Cash-flow signs and the availability of a valid IRR. |
| Discounted payback | Lower | The selected study horizon and whether payback is reached. |
| LCOE / LCOS | Lower | Energy or storage-output denominator and the assessment mode. |
| Carbon reduction | Higher | Emissions assumptions and modelled energy. |
| Connection headroom | Higher | Network limits and the limiting asset. |
LCOE and LCOS have different cost scopes and energy denominators. Check the separate LCOE and LCOS values in the exported option table before comparing generation and storage options. Missing metrics are not zero and are not evidence that an option is better.
The design value chart in Summary uses a different order: it sorts individual designs by NPV alone, highest first. Its colours show solar PV nameplate size, not gate status. Check the gate in Solution gates and ranking before selecting a finalist. The Riverbend cold store example shows why a design can lead on NPV and still require review.
Engineering gates
| Gate or indicator | Meaning | Next step |
|---|---|---|
| pass | The assessed checks pass for the supplied model and limits. | Review the assumptions and financial result. |
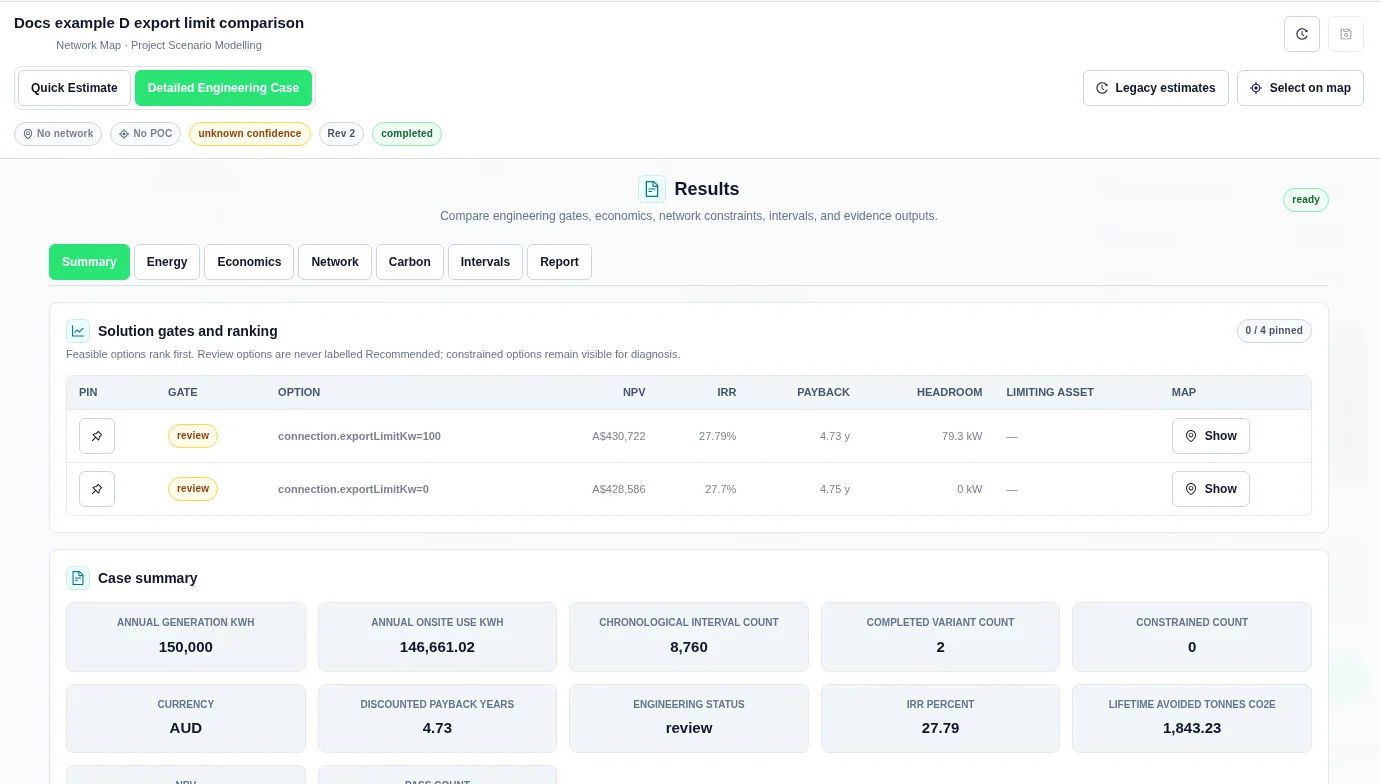
| review | The option needs review because evidence, limits, or checks are incomplete. | Resolve the reported diagnostic or missing input before relying on the result. |
| constrained | At least one assessed constraint is exceeded. | Inspect the limiting asset and revise the design or network assumptions. |
| recommended | The first passing option in the current ranking. | Check its assumptions, data quality, and suitability before choosing it. |
Review and constrained options remain visible. Review options are not recommended. Recheck the ranking after changing the metric or correcting missing values. Confirm that each required check has a usable limit and supporting inputs; missing information is not evidence of a pass.
Read the comparison table and result views
The Solution gates and ranking table contains Pin, Gate, Option, NPV, IRR, Payback, Headroom, Limiting asset, and Map. Pin up to four options. Use Show to inspect an option on the map when that action is available.
| View | Use |
|---|---|
| Summary | Review ranked solutions, gate status, and the case summary. |
| Energy | Check generation, onsite use, imports, exports, storage, and curtailment. |
| Economics | Review capex, first-year savings and costs, NPV, IRR, discounted payback, LCOE, and LCOS. |
| Network | Review network constraints and headroom alongside financial results. |
| Carbon | Review first-year and lifetime avoided emissions and carbon value. |
| Intervals | Inspect the chronological result preview. The table shows up to 50 rows. |
| Report | Download evidence and data or create a presentation. |
Use Open Plot Studio from Intervals to inspect available result series and build charts. The workbench preview is not the full export. For financial metric definitions and cash-flow formulas, see Value and Finance.
Two-option comparison example
Test a financial sensitivity
A technical option sweep changes the selected design variables. To test a finance assumption such as capex, energy value, or discount rate, use a separate saved revision and run.
- Save and run the base assumptions.
- Export the base result and record its case, revision, and run identifiers.
- Change one finance assumption.
- Save a new revision and run it.
- Export that result.
- Compare the same financial metric and cash-flow columns across the two exports.
Keep the other assumptions unchanged when testing one variable. Record deliberate differences when comparing a wider set of scenarios.
Download the engineering report pack
- Complete the run and review its diagnostics.
- Open Report.
- Choose the required download.
- Keep the evidence pack with the files used in your comparison.
| Button | Download and purpose |
|---|---|
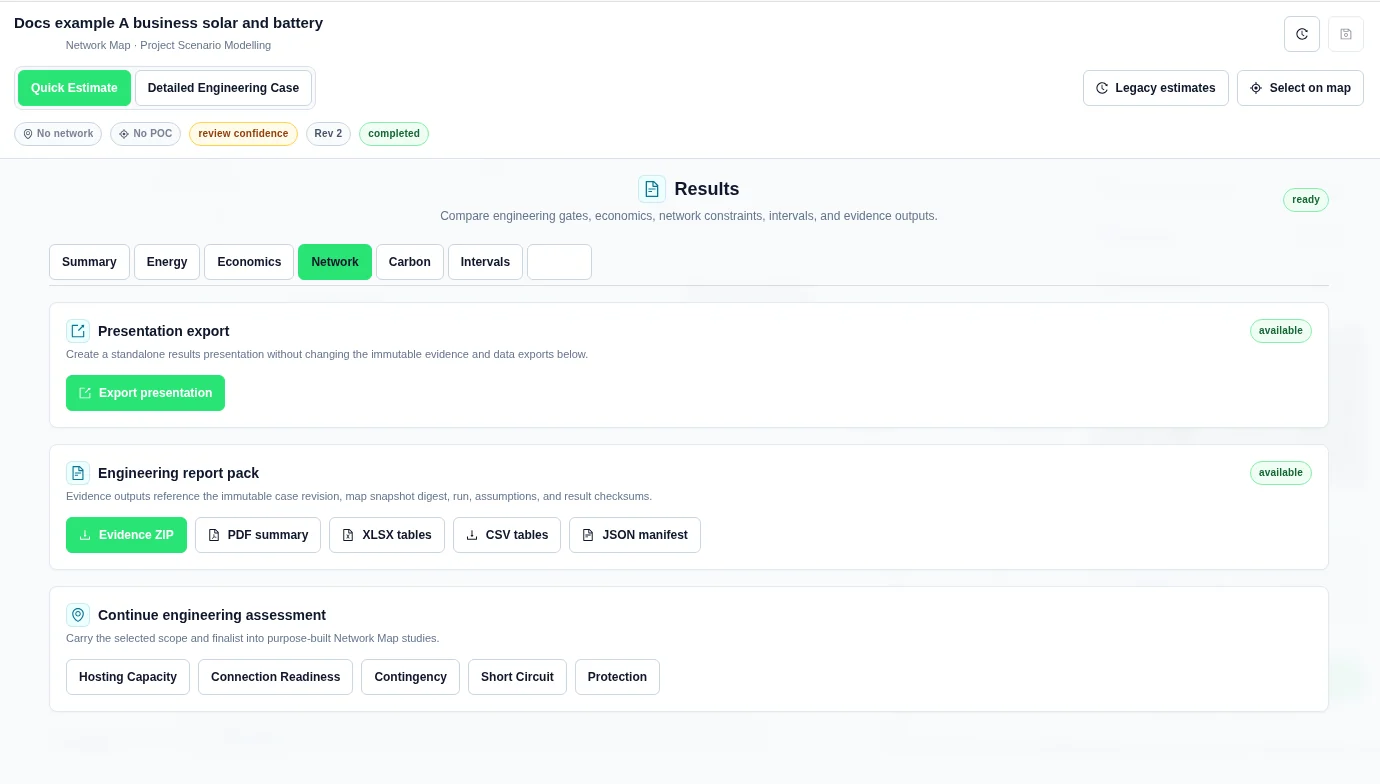
| Evidence ZIP | Evidence archive containing the saved assumptions, result data, run and revision identifiers, source digests, checksums, and recorded limitations. Referenced profiles are included in the resolved assumptions when available. |
| PDF summary | Compact PDF evidence summary. Use the table and evidence exports for detailed financial data. |
| XLSX tables | ZIP archive of result tables in XLSX format. Extract the archive before opening the spreadsheets. |
| CSV tables | ZIP archive of result tables in CSV format. Extract the files for comparison or further analysis. |
| JSON manifest | Structured JSON result data, including the available economics, cash flows, tables, and diagnostics. |
The report pack references the immutable case revision and run. Check its identifiers and limitations before distribution. The run first indicator means no result is available for report generation. available means the report action can use a result.
If report generation fails, read the error, confirm that the run has a result, and try the export again. Download buttons are disabled while an export request is in progress.
Report controls
Create a presentation
Presentation export is separate from the evidence pack. It creates files in your browser from a completed, current result with reportable content. A result can still contain warnings; review those warnings before sharing it.
- In Report, select Export presentation.
- Enter Presentation title.
- Optionally enter Client or audience and Prepared by.
- Select Confidentiality.
- Select Export format.
- Choose the required Presentation sections.
- Choose whether to Include current map, if map capture is available.
- Select Export presentation and wait for the files to download.
| Setting | Choices or limit |
|---|---|
| Presentation title | Required; up to 160 characters. |
| Client or audience | Optional; up to 120 characters. |
| Prepared by | Optional; up to 120 characters. |
| Confidentiality | Confidential, Internal, Client confidential, or Public. The default is Confidential. |
| Export format | PowerPoint (.pptx), PDF (.pdf), or PowerPoint and PDF. |
| Presentation sections | Key results, Scope and study basis, Assumptions and inputs, Charts and Plot Book, Recommendations and narrative, and Appendix tables. |
| Include current map | Available only when map capture is supplied and the map is not in 3D mode. |
Use Cancel export to stop generation. Use Close to leave the dialog when generation is not running. If map capture fails, select Retry map capture or Continue without map.
current run required means the selected result is missing, incomplete, stale, or has no reportable presentation content. Complete or rerun the assessment before exporting.
Legacy comparison and finance charts
The legacy Rank Solutions By choices are NPV, IRR, Payback, and Carbon offset. See Legacy Estimates for its technical ranges and apply controls.
After Calculate, the legacy Scenario Charts include:
- NPV Sensitivity: NPV recalculated at discount rates of 3%, 4%, 5%, 6%, and 7% using the same cash flows.
- Cumulative Cash Flow: undiscounted cumulative cash flow, including initial investment at year zero.
- Annual Cash Flow: undiscounted annual cash flow from year one onward.
The legacy cumulative chart is not the discounted cash-flow series used for payback. Recalculate after changing assumptions. A legacy estimate must be upgraded to a versioned Engineering Case before creating a presentation.
Continue the assessment and share results
The Report view also offers Hosting Capacity, Connection Readiness, Contingency, Short Circuit, and Protection follow-on actions when connected to the study workspace. Carry the case context into these follow-on studies to assess the selected alternatives.
For saved-project access and team sharing, see Workspace Collaboration and Sharing. For executable project workflows, see Projects and Flows.
Saved report history and private templates
In Results → Report → Saved reports, create reports from immutable runs, preview supported artifacts, and reuse or regenerate saved configurations. Private DOCX templates have exact version selections.
See Saved Reports and Templates for the full workflow. Filters select result cells, not confidential information: each delivery includes an evidence ZIP with full saved input assumptions.
Related Guides
- Project Modelling
- Value and Finance
- Network Tariffs
- Options and Results
- Workspace Collaboration and Sharing
- Projects and Flows
- Worked Examples


