

Revenue You Can Reconcile
Realised revenue for any unit with the published loss factor applied by effective date, beside the figure without it, so the number lines up with how energy is actually settled.
Operator data, never estimated • ISO/IEC 27001 certified • Cancel anytime
Revenue Truth at the Connection Point
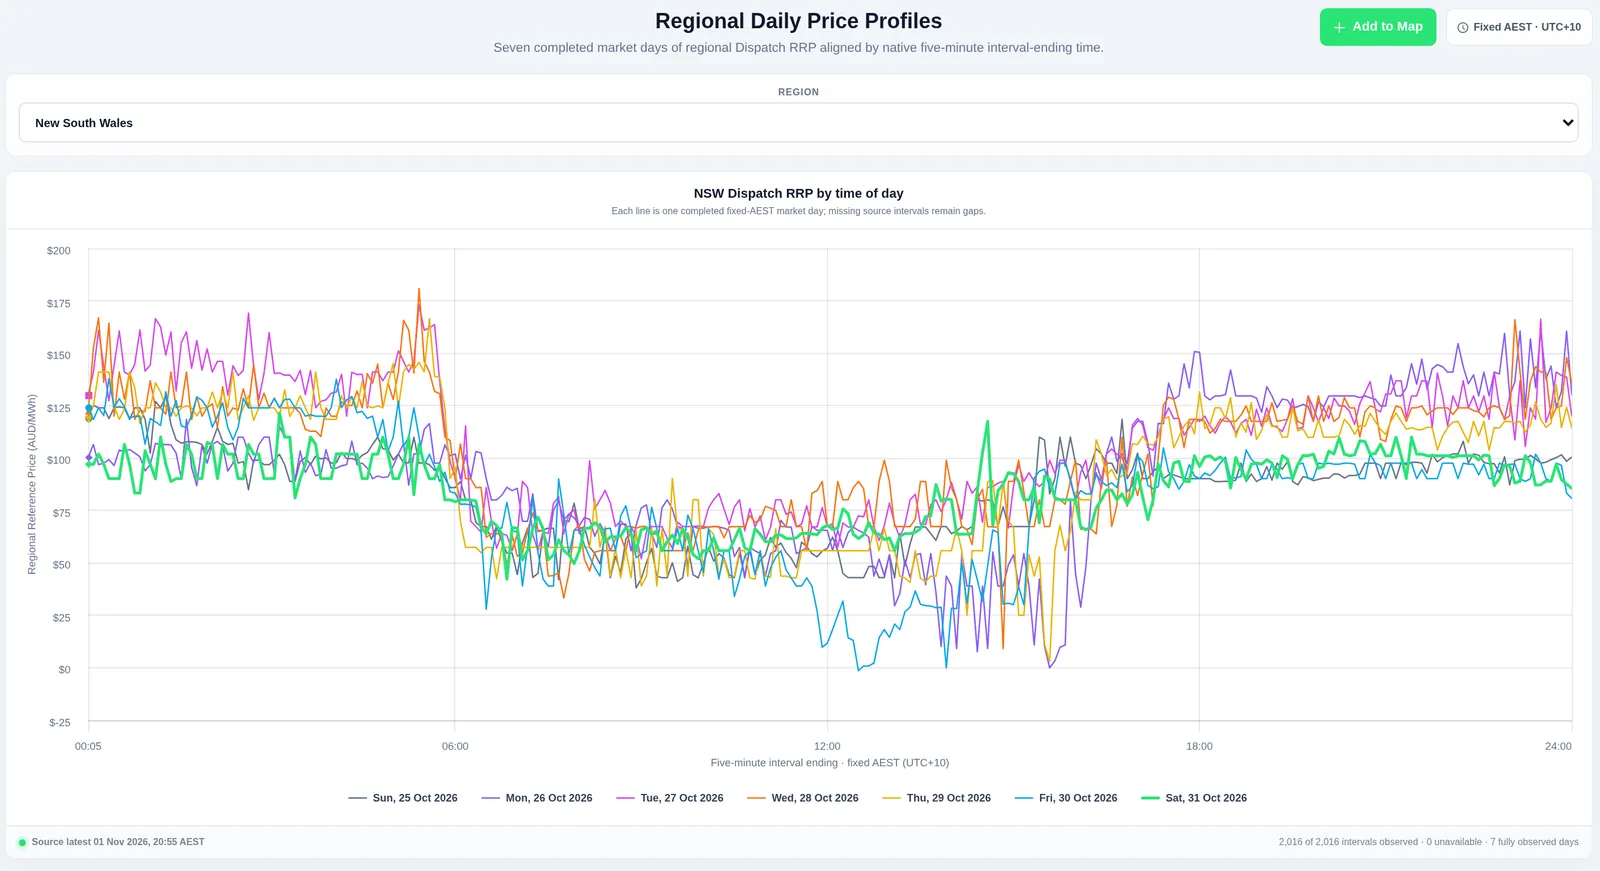
What a unit earned at its own connection point: energy valued at the regional spot price for every 5-minute dispatch interval and scaled by the published loss factor.
The Same Arithmetic Settlement Uses
Energy is settled at the regional price scaled by the connection point's loss factor. Network Map applies the market operator's published factor for each interval, using the determination in force on that market date, and never averages, carries forward or invents one.
Unit revenue is delivered through the Network Map platform API. The figures and chart below are rendered from live API responses. Access is through the Network Map platform API for Pro and Enterprise accounts; contact us to set it up.
Worked Example: Broken Hill Solar Farm (BROKENH1)
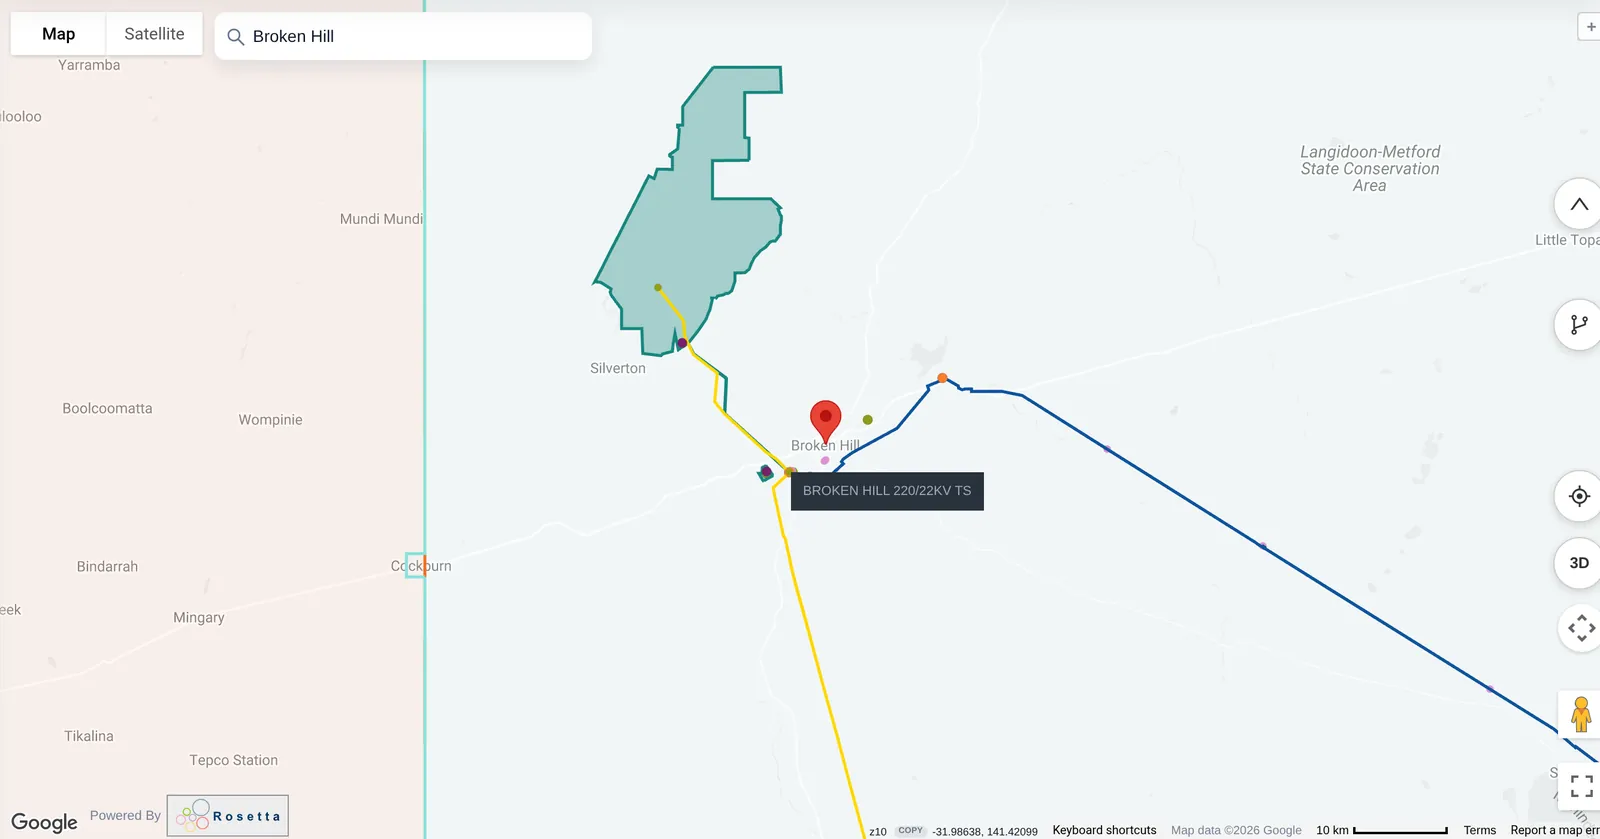
Connection point NBK11B, NSW1 region. Published loss factor 0.8436 from the market operator's 2026-27 NSW1 determination (set lf_mlf_NSW1_2027:v1), effective 1 July 2026.
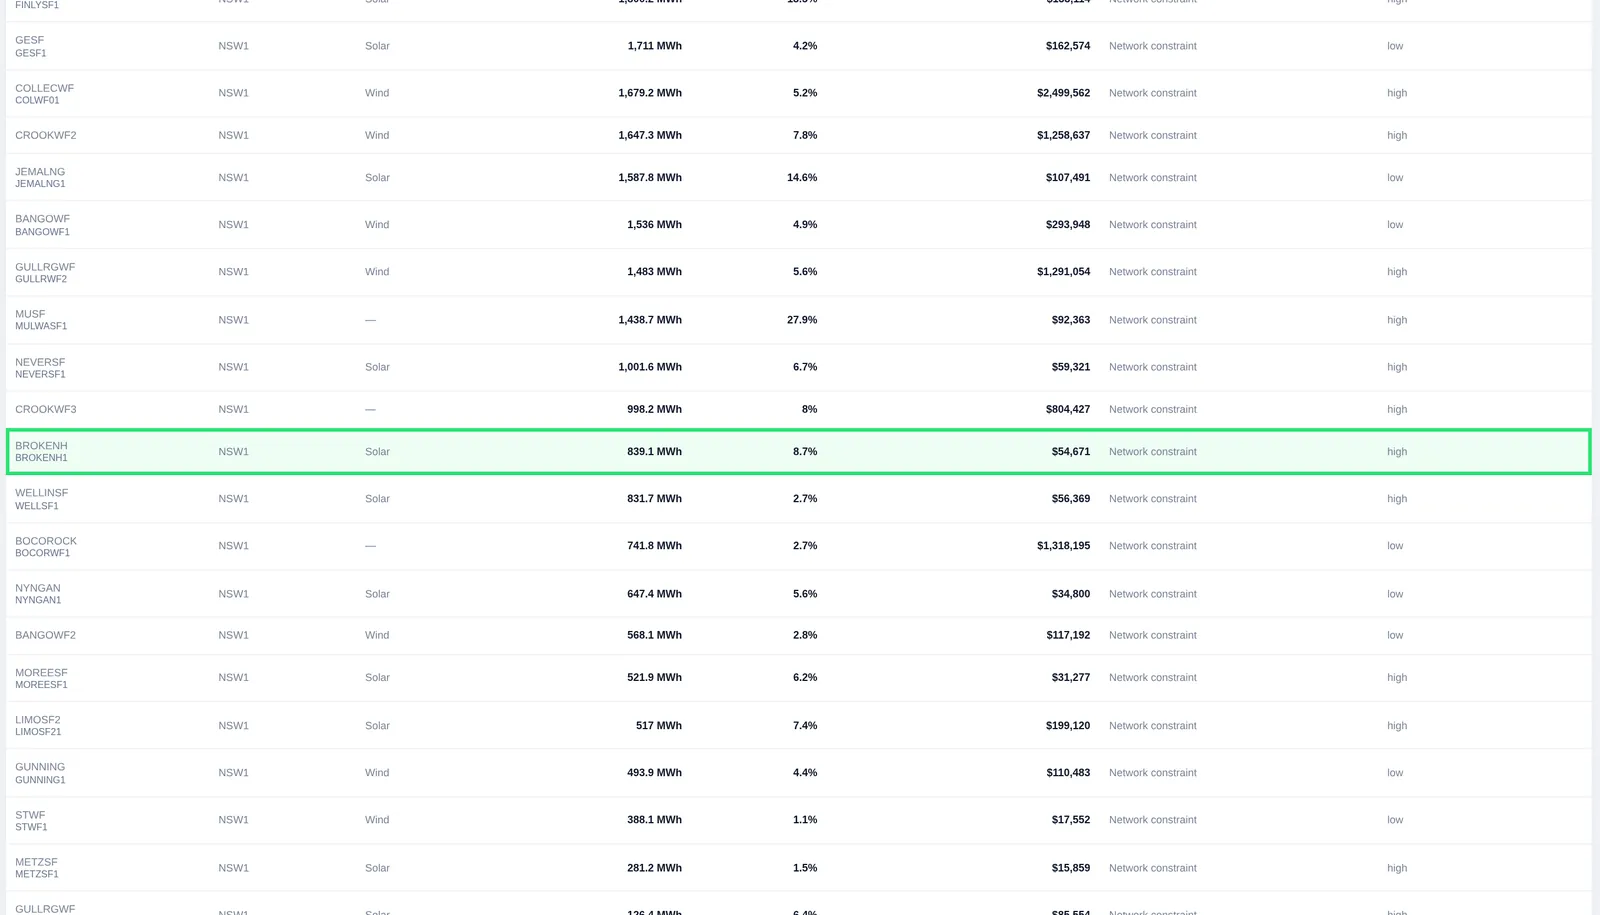
Broken Hill Solar Farm (BROKENH1), daily energy revenue, October 2026
With and without the published 2026-27 loss factor (0.8436).
| Unit (October 2026) | Energy | Loss factor 2026-27 | Without loss factor | With loss factor | Difference |
|---|---|---|---|---|---|
| Broken Hill Solar Farm (BROKENH1) | 9,054.8 MWh | 0.8436 | A$670,588.78 | A$565,708.70 | −A$104,880.08 |
| Silverton Wind Farm (STWF1) | 37,679.2 MWh | 0.8960 | A$3,995,651.78 | A$3,580,103.99 | −A$415,547.79 |
Energy is valued per 5-minute dispatch interval: dispatched MW × interval length × regional price × loss factor. Source: the market operator's daily loss factor publication and next-day dispatch; GET /v1/markets/nem/units/revenue, read 1 Nov 2026 10:38 UTC.
What the Revenue Record Gives You
With and Without the Loss Factor
Both figures on every unit and every stream, side by side.
Effective-Dated Factors
Each interval uses the determination in force on its own market date, including mid-year connections and re-publications.
Signed Streams
Energy delivered, energy charge cost and ancillary service streams with explicit signs, up to 40 units per request, never blended.
Daily to Financial Year
Interval, day, month, quarter or financial-year buckets in market time (UTC+10).
Who It's for
Asset Owners and Operators
Check realised revenue against your settlement statement, with the loss factor shown.
Developers and Consultants
See what a low loss factor actually costs an existing unit near your site.
Investors and Advisers
Compare units on a like-for-like, published-factor basis.
Pro, Available Via API
Per-unit loss-factor revenue is part of Pro and Enterprise and is never free. Available via API, set up on request; volume API access is Enterprise.
Know How the Grid Treats a Site
More of the observed record behind a connection point.
Start Free, Upgrade When You Need the Evidence
Analyst US$75 a month · Pro US$150 a month · Annual plans 15% off: US$765 and US$1,530 a year.
Self-serve: pay by card or company invoice, no demo needed · Cancel anytime


