

Docs Menu
East Coast Live Market
These views show the market as it runs: five-minute prices, demand and generation, carbon intensity and the flows between regions.
Watch the Video: East Coast Market & Constraints (1:03)
"Live" here means the latest 5-minute dispatch interval that the market operator has published. Each interval appears about 2 to 3 minutes after it ends. It is not a real-time measurement.
Open any view from Markets in the product switcher, then pick the market and the view from the left-hand menu. See the Network Map Markets Guide for the common controls and plan access.
Views
Dispatch Overview
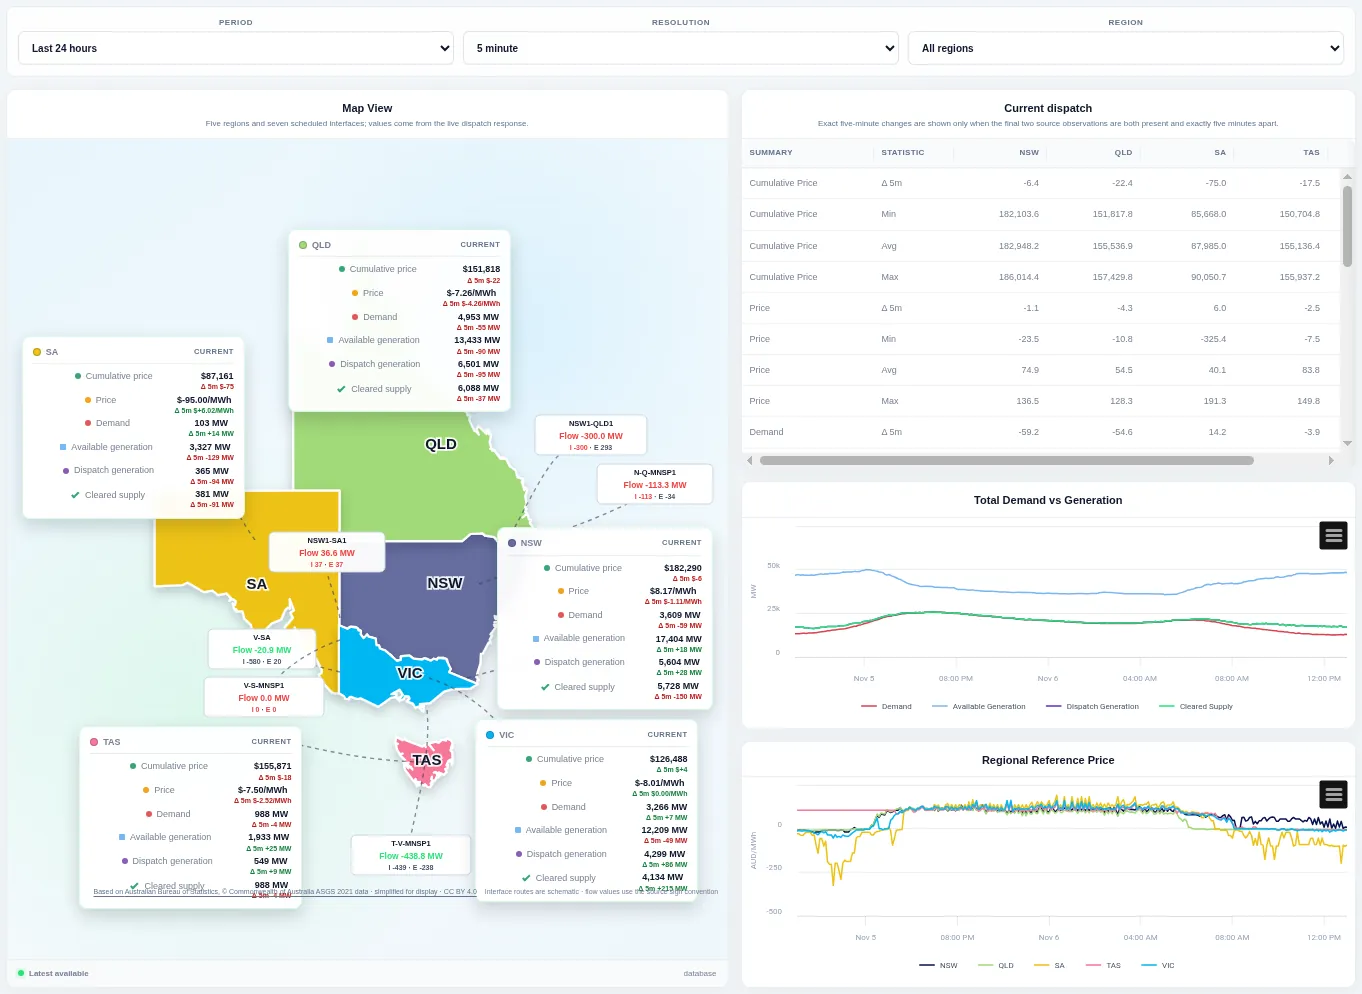
A map of each region with its latest price, demand and generation, the flow on every interconnector, a regional summary table and demand and price charts. Change the period, resolution and region at the top; each region card shows the latest value and its five-minute change.
Market Snapshot
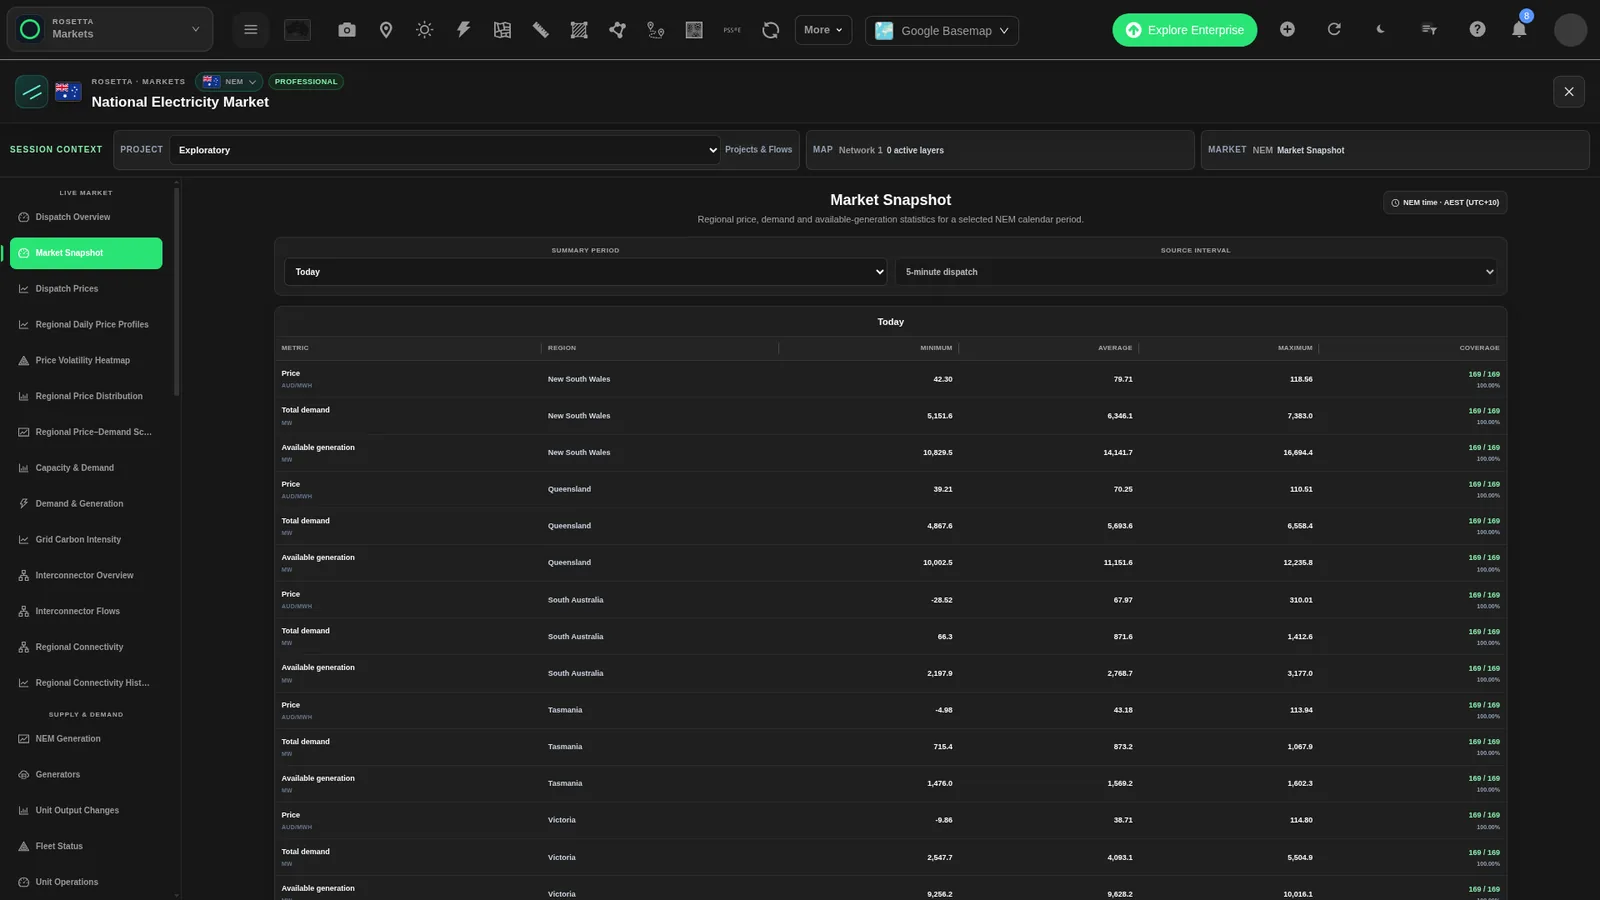
A table of regional price, total demand and available generation for a NEM calendar period. Each row gives the minimum, average and maximum. Choose the Summary period (for example Today) and the Source interval (for example 5-minute dispatch). The Coverage column shows how many intervals are in each value. Times are NEM time (AEST, UTC+10).
Dispatch Prices
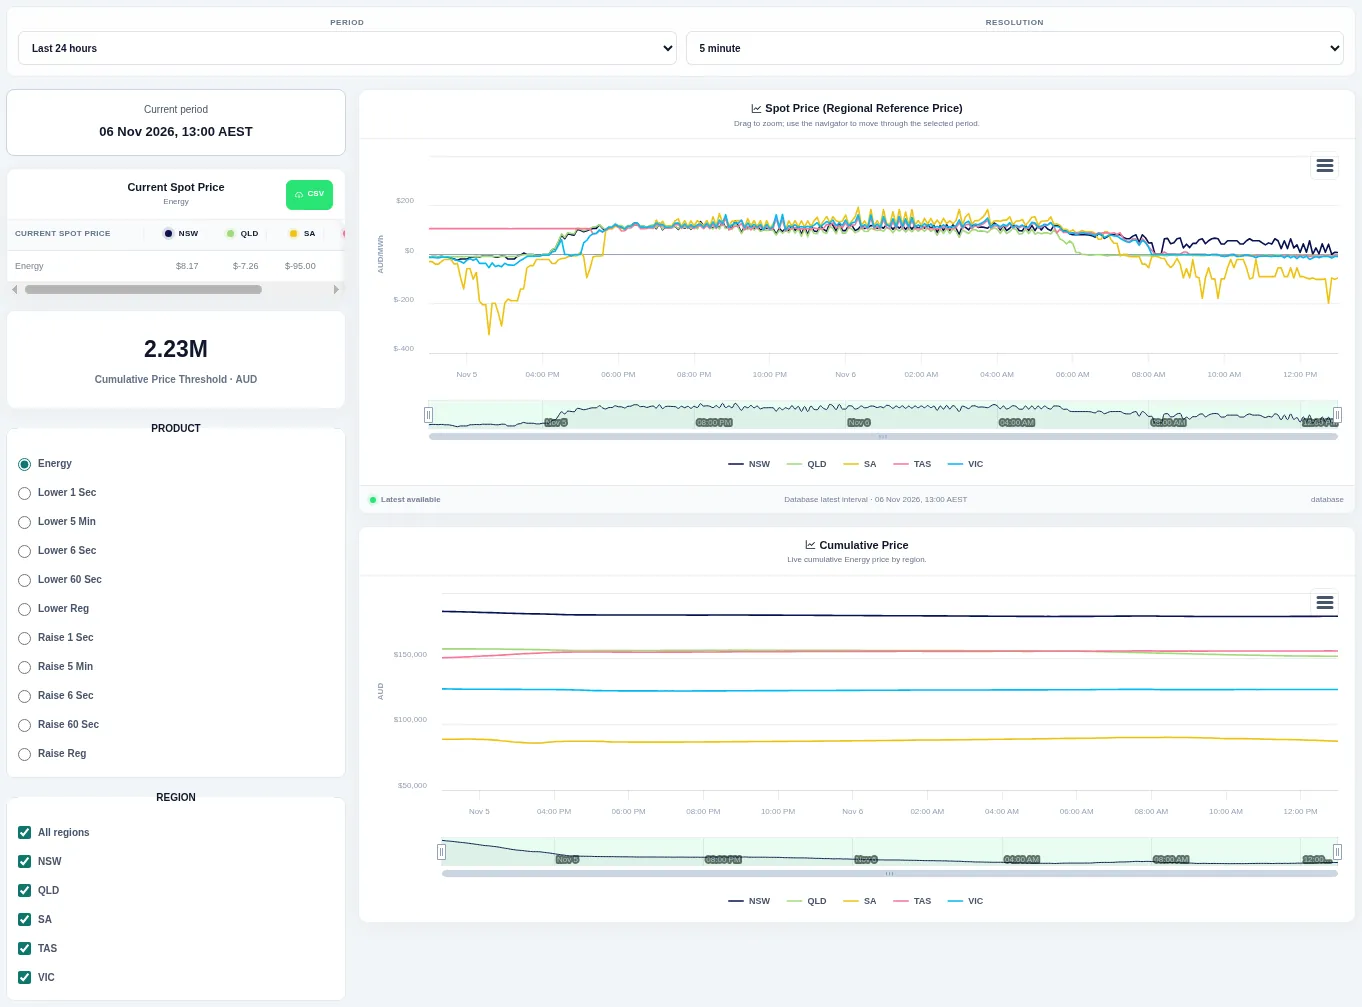
Five-minute regional spot prices for energy or any frequency control ancillary service product, with current-price cards and a cumulative price chart below. Pick the product and regions on the left and change the period and resolution at the top; drag on the chart or use the navigator to zoom.
Regional Daily Price Profiles
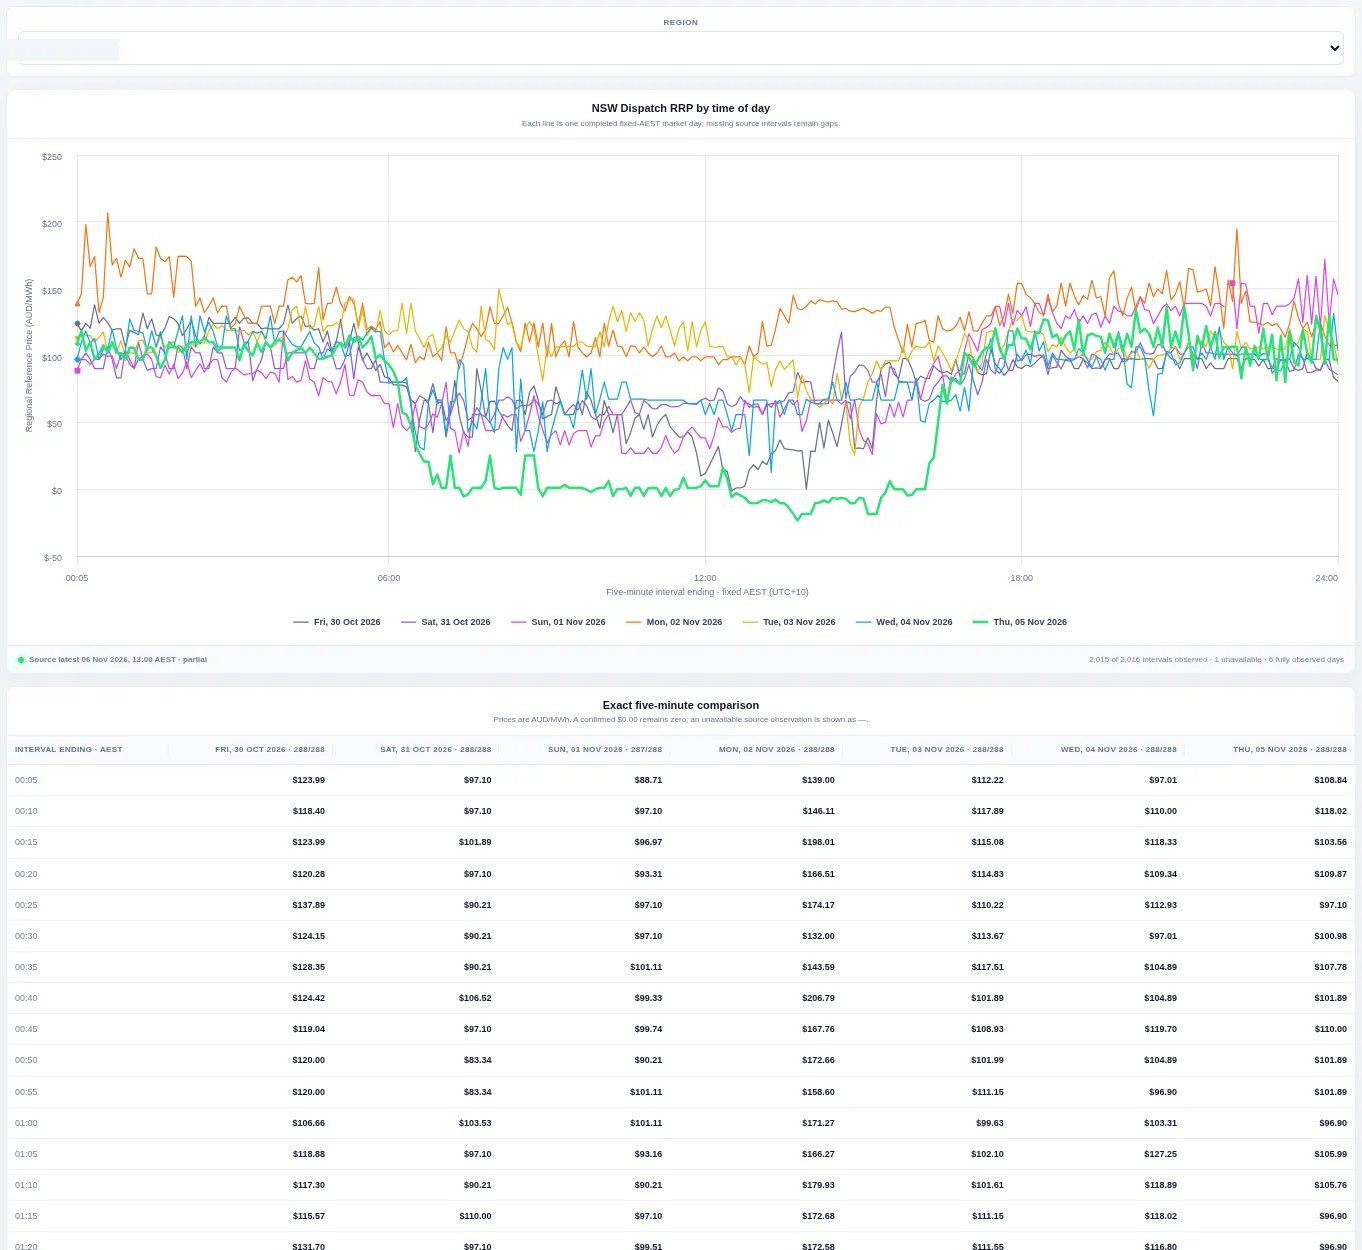
Each line is one completed market day of dispatch price, laid over the same time-of-day axis so daily shapes can be compared. Choose the region; the table below lists the values for every interval.
Price Volatility Heatmap
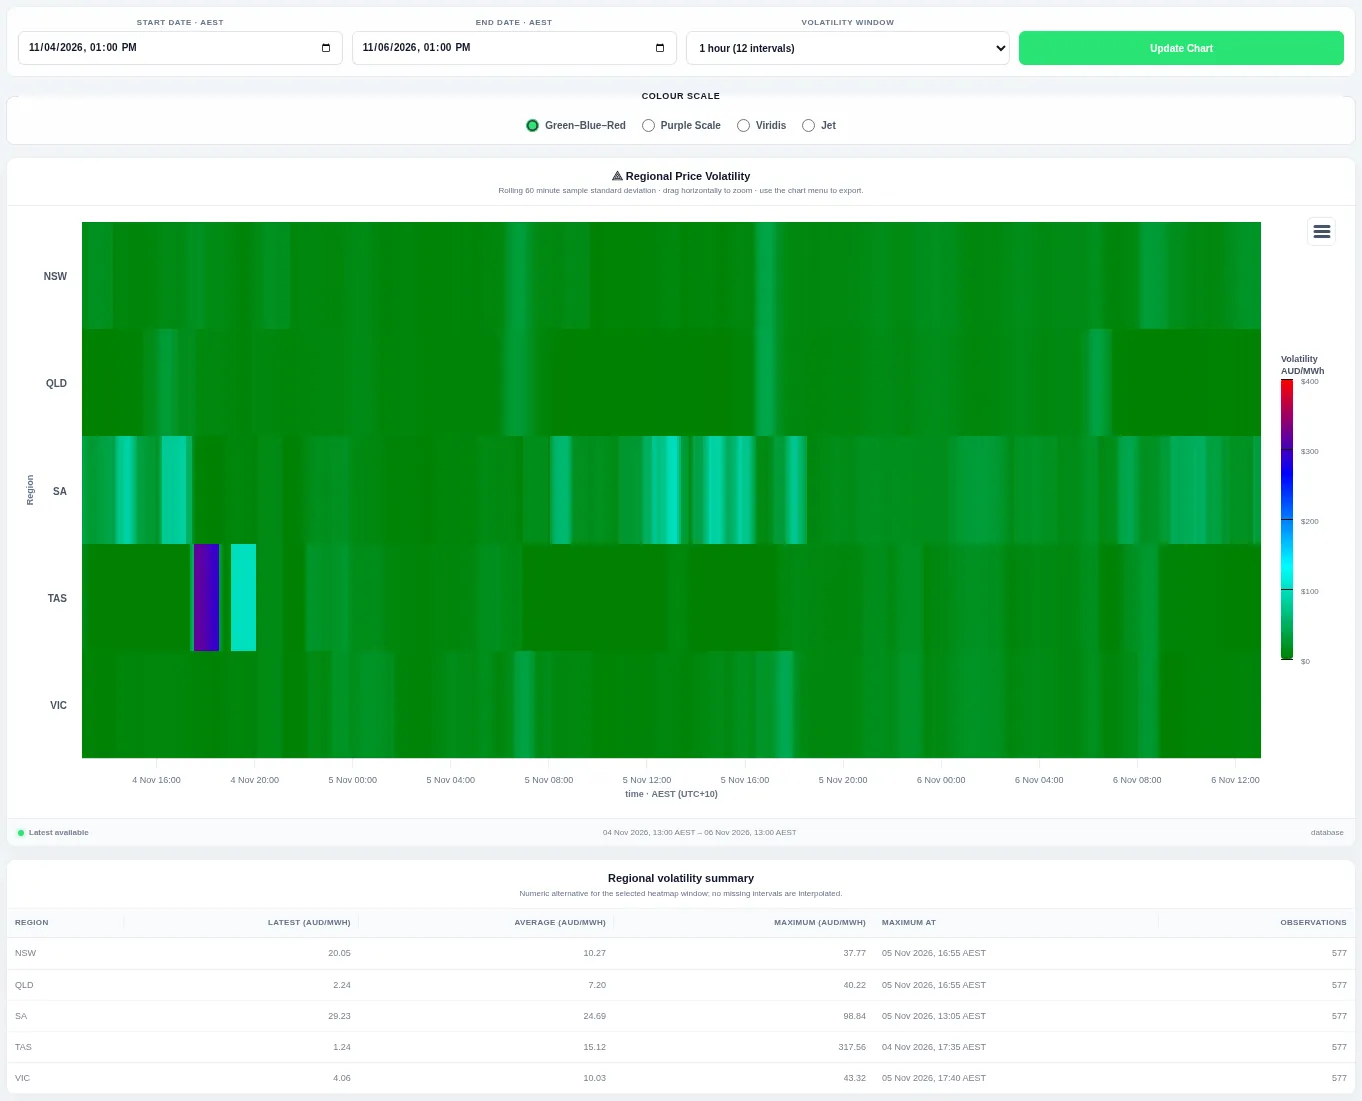
Each cell is the rolling standard deviation of a region's price over the chosen window; brighter colours mean more volatile prices. Set the start and end dates and the window length, then press Update Chart; a summary table lists the latest, average and maximum volatility per region.
Regional Price Distribution
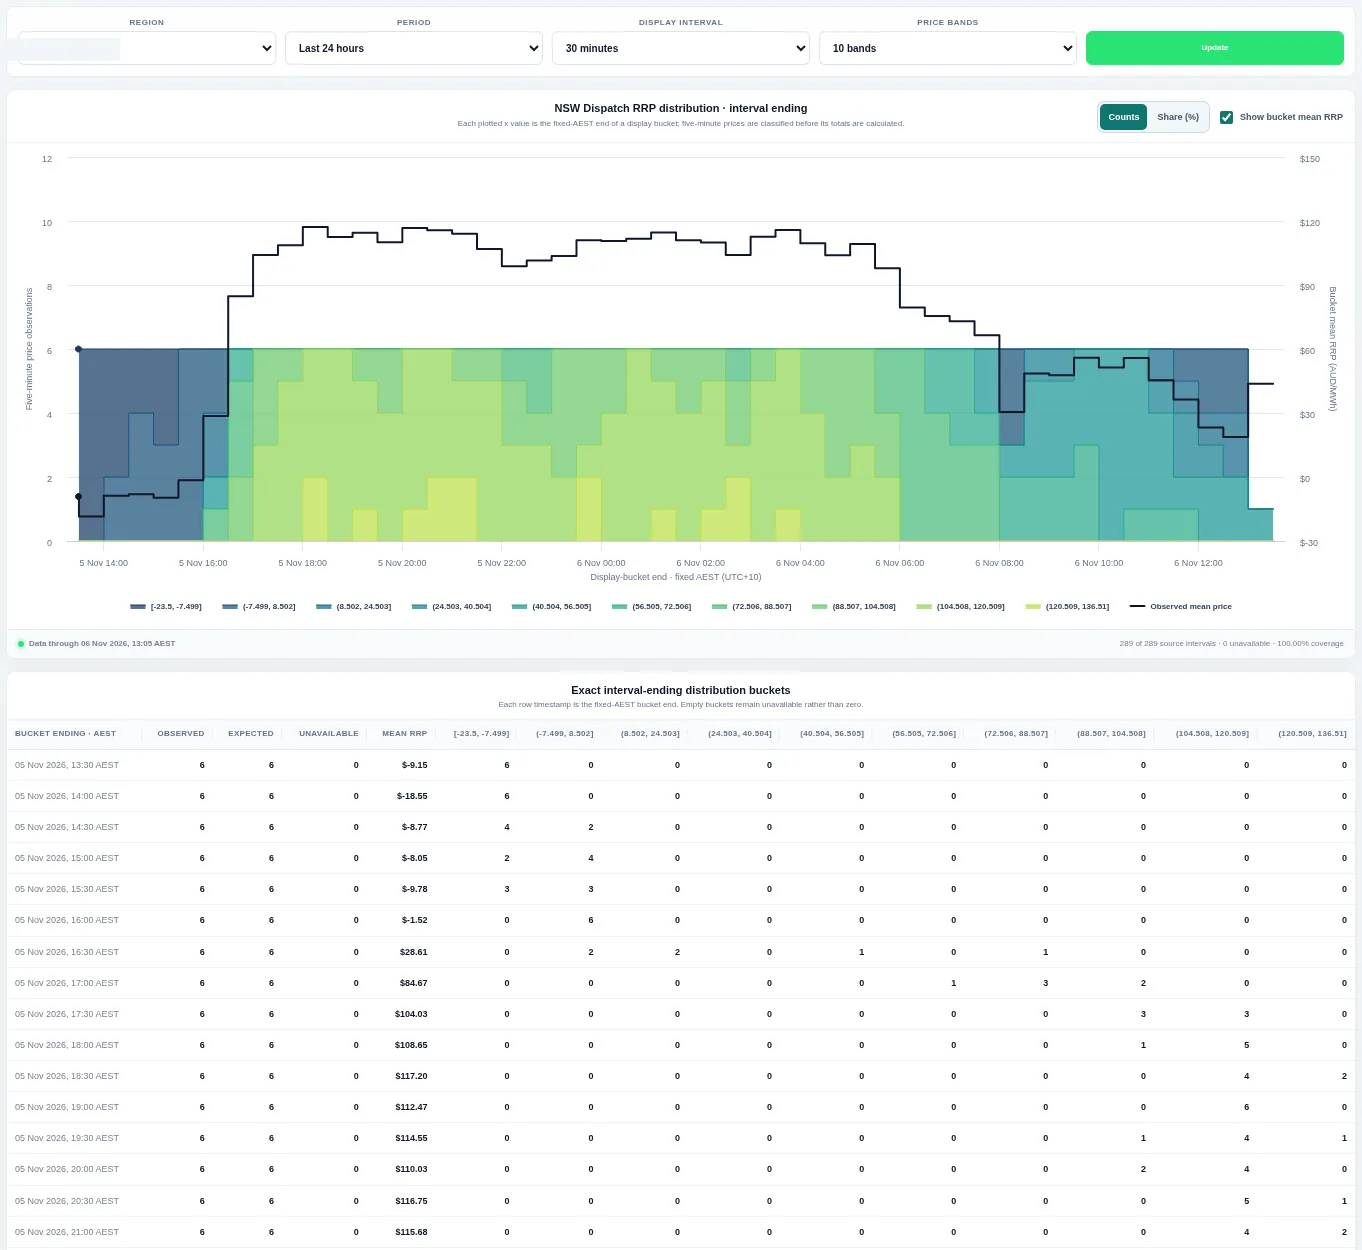
Dispatch prices are counted into equal-width price bands so you can see how often prices fall in each range. Change the region, period, resolution and number of bands; the table below gives the count in each band.
Regional Price–Demand Scatter
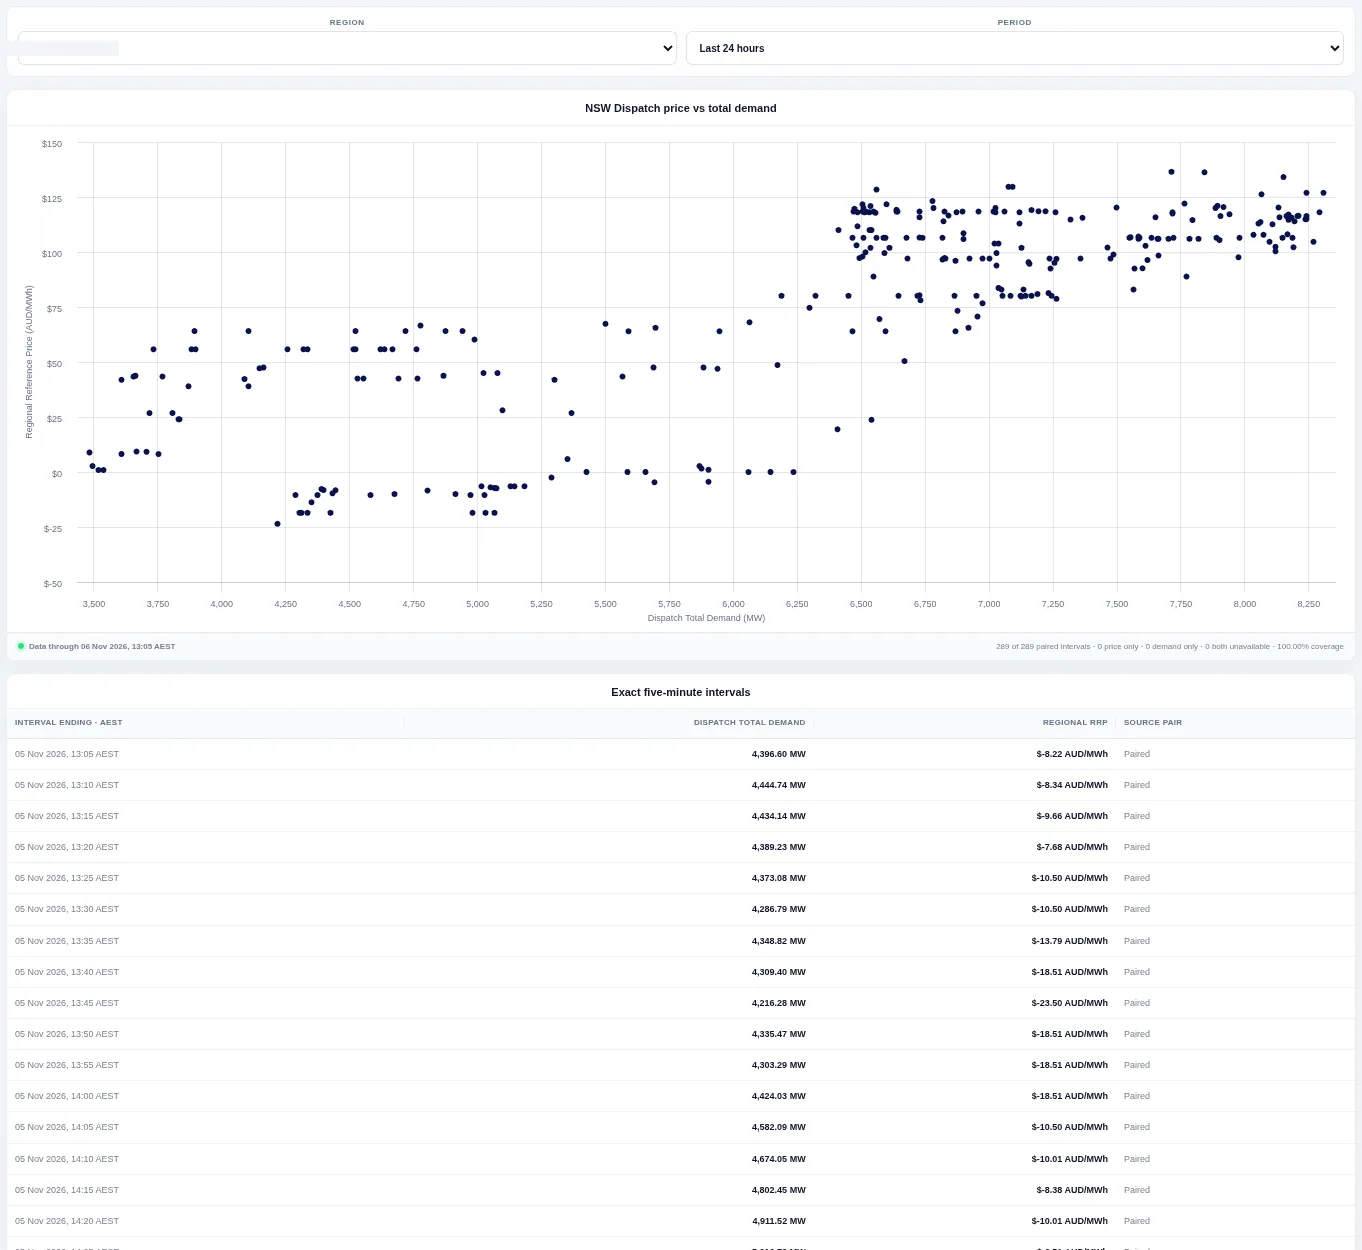
Each dot is one five-minute interval, placed by total demand on the horizontal axis and price on the vertical axis. Choose the region and period; the table lists each paired interval.
Capacity & Demand
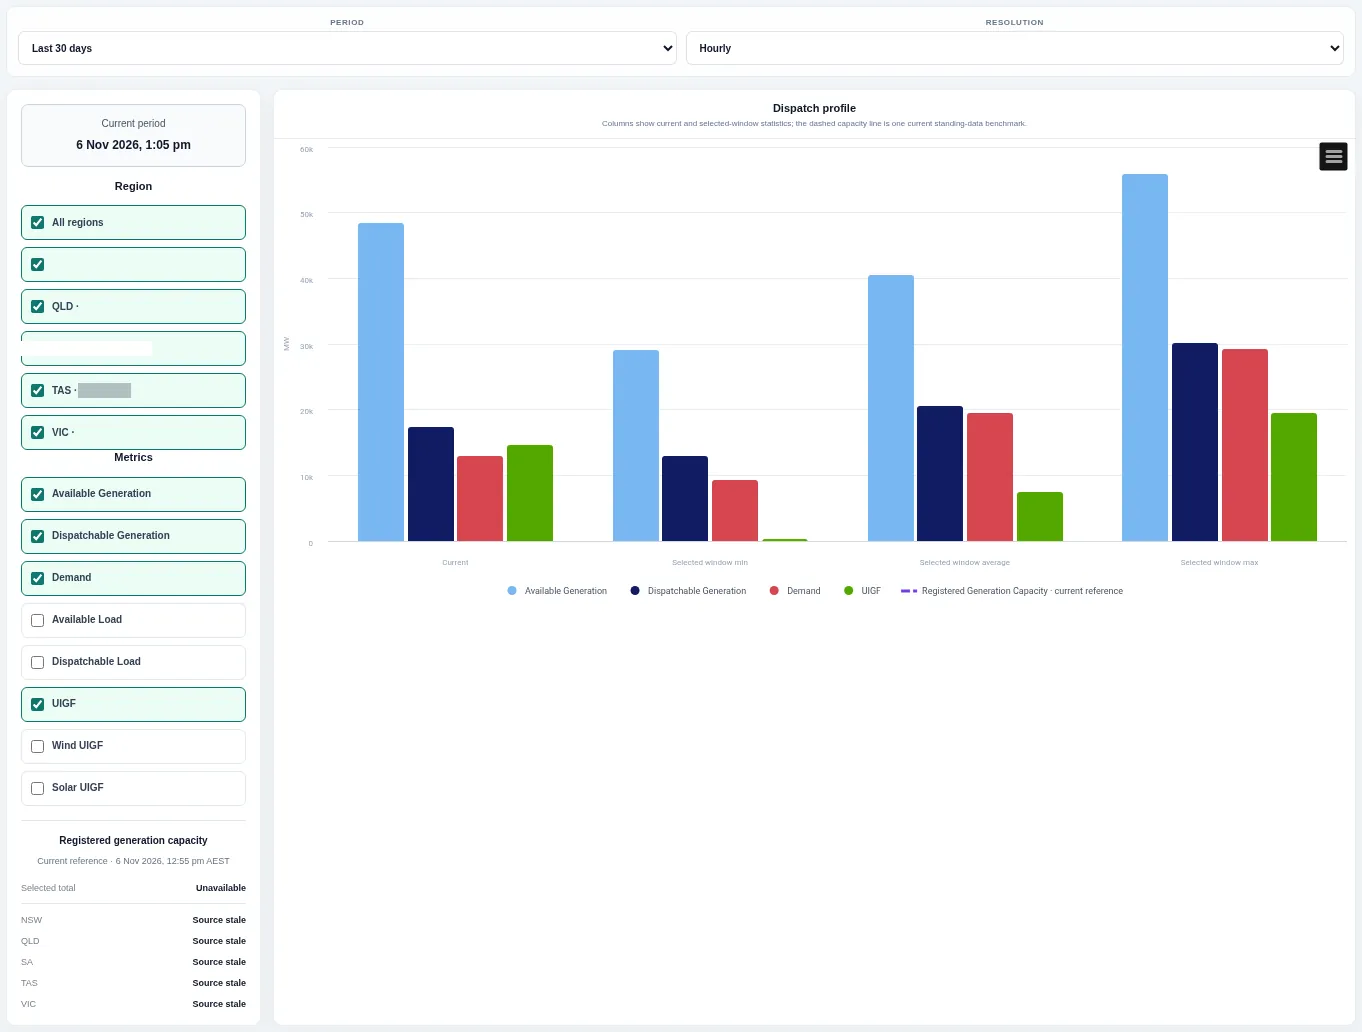
Columns compare available generation, dispatchable generation, demand and other metrics for the current interval and for the minimum, average and maximum of the selected window. Tick regions and metrics on the left and change the period and resolution at the top.
Demand & Generation
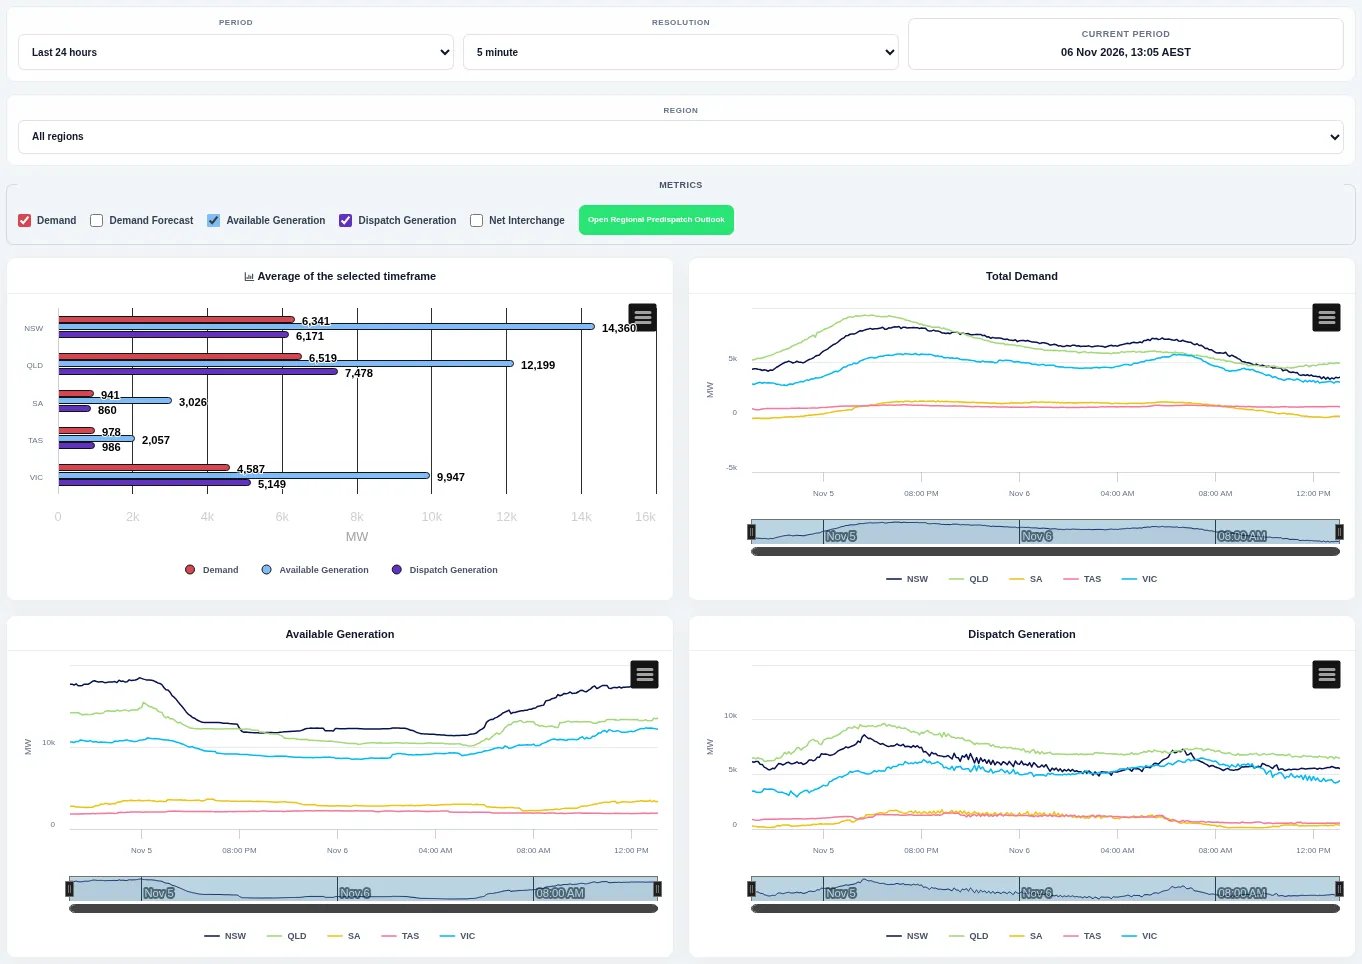
Separate charts show total demand, available generation and dispatch generation by region over the chosen window. Change the period, resolution and region; missing observations stay as gaps.
Grid Carbon Intensity
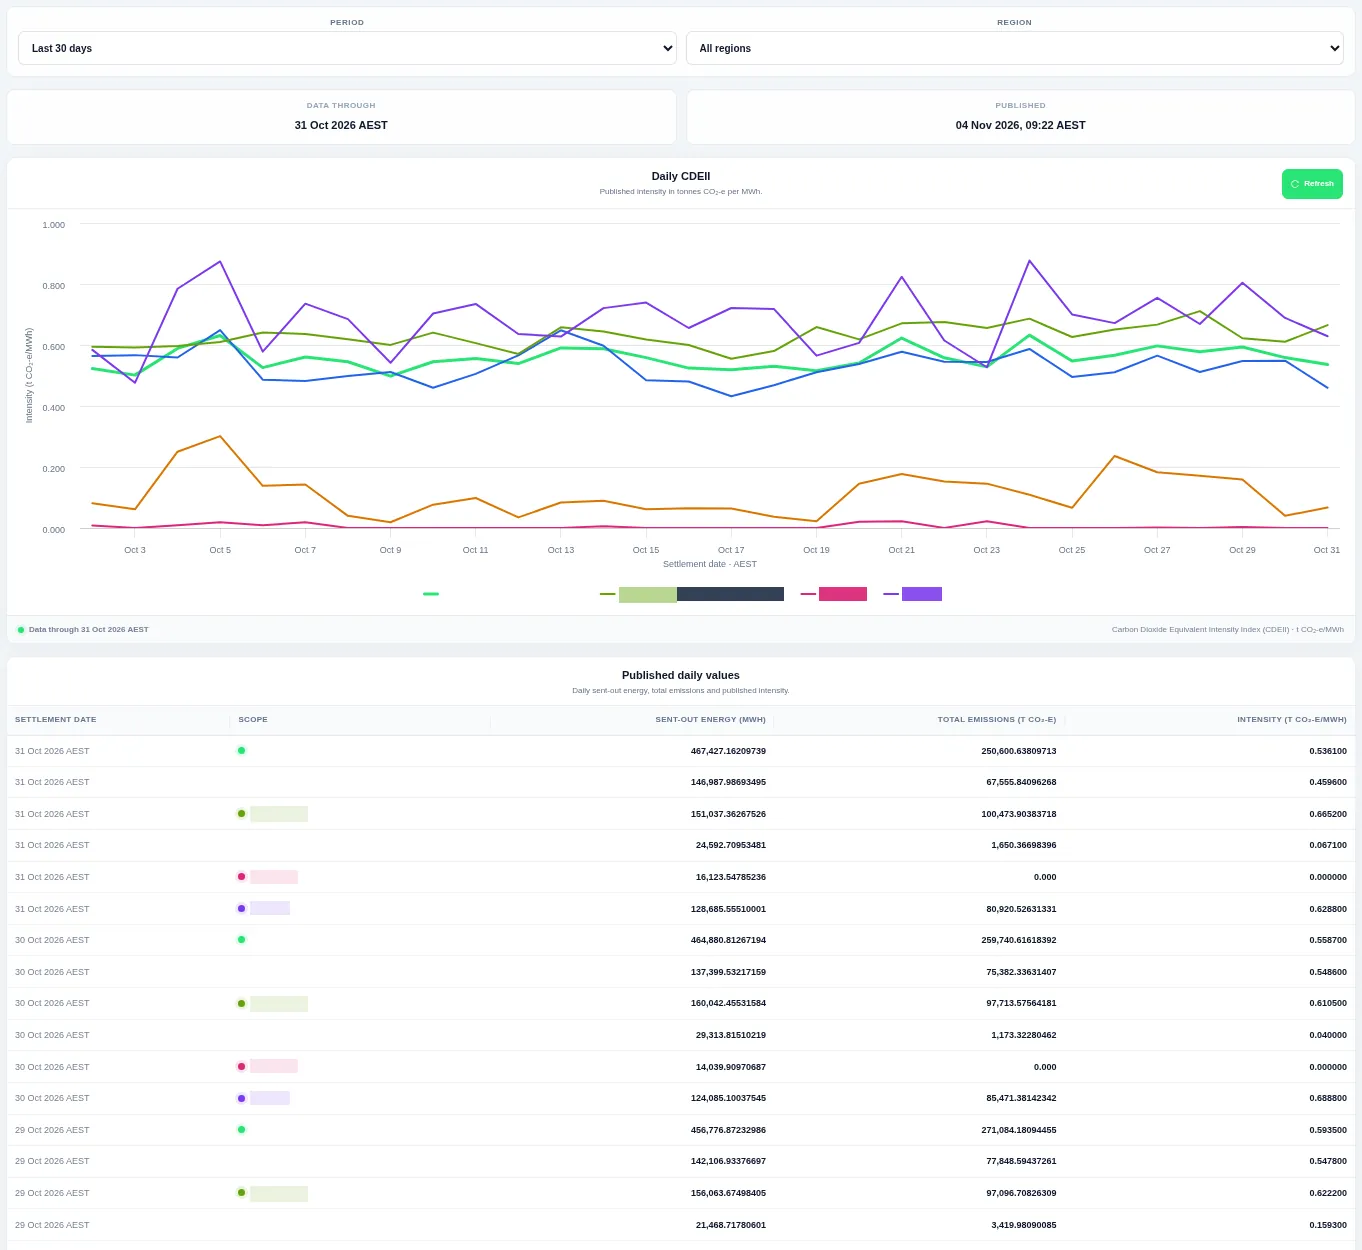
Lines show the published daily carbon dioxide equivalent intensity in tonnes per megawatt hour, with a table of sent-out energy, total emissions and intensity per day. Change the period and region.
Interconnector Overview
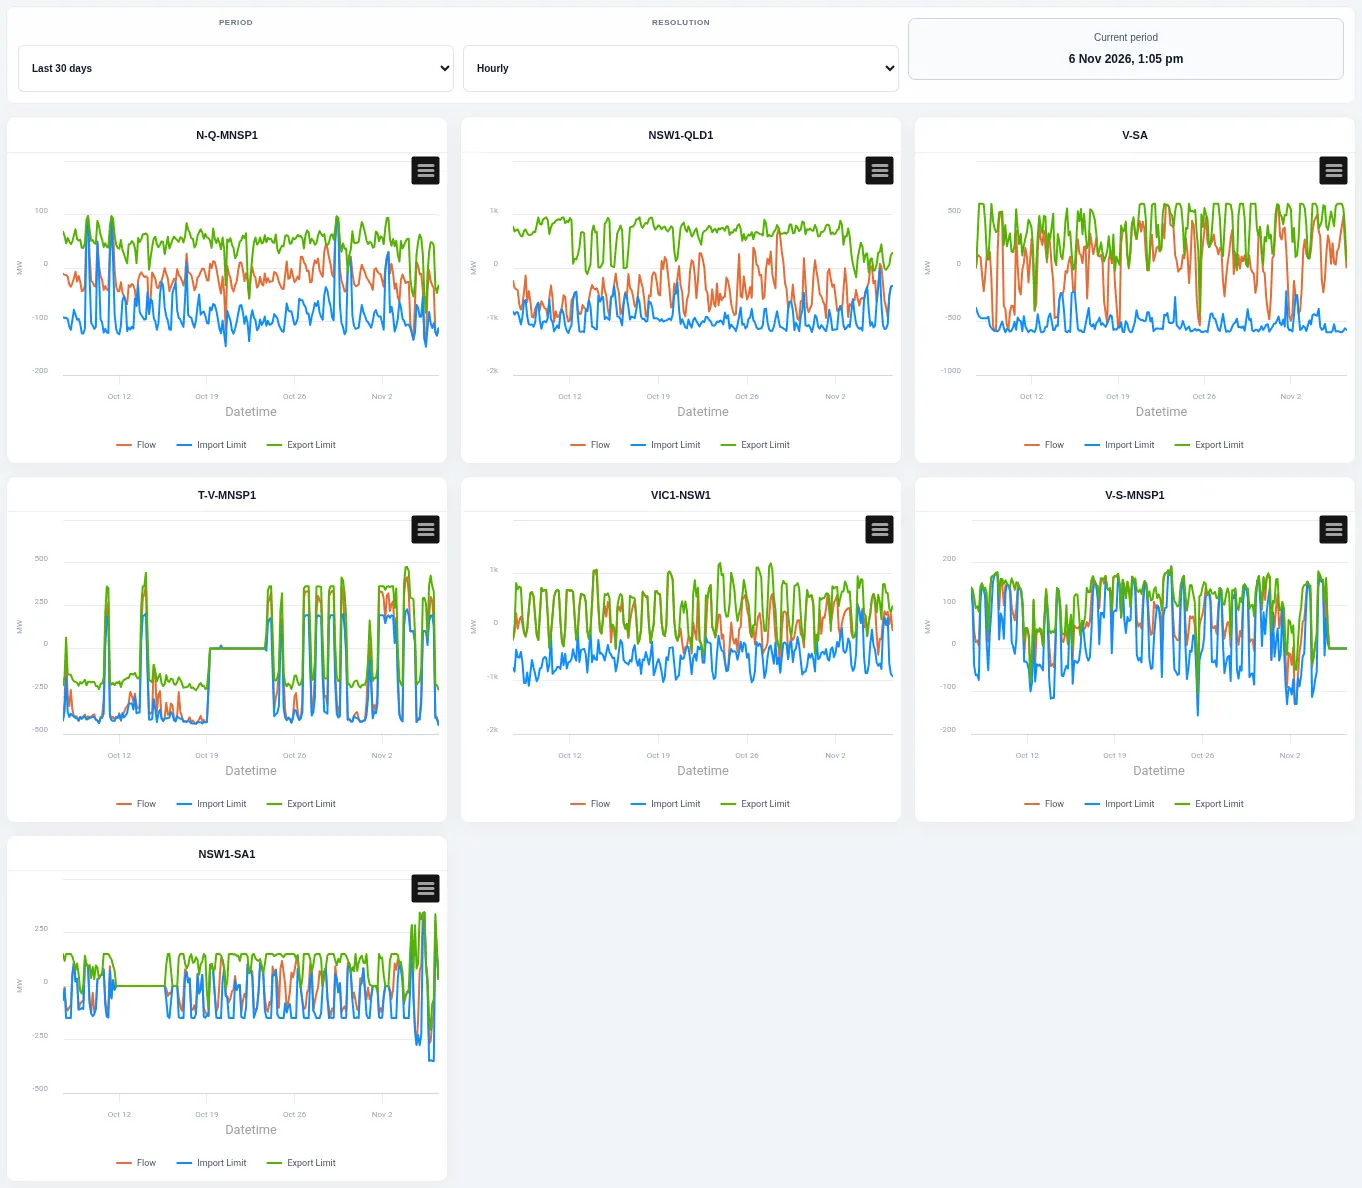
One small chart per interconnector shows its dispatch flow between its import and export limits over the window. Change the period and resolution; a line that touches a limit means the interconnector was at its limit.
Interconnector Flows
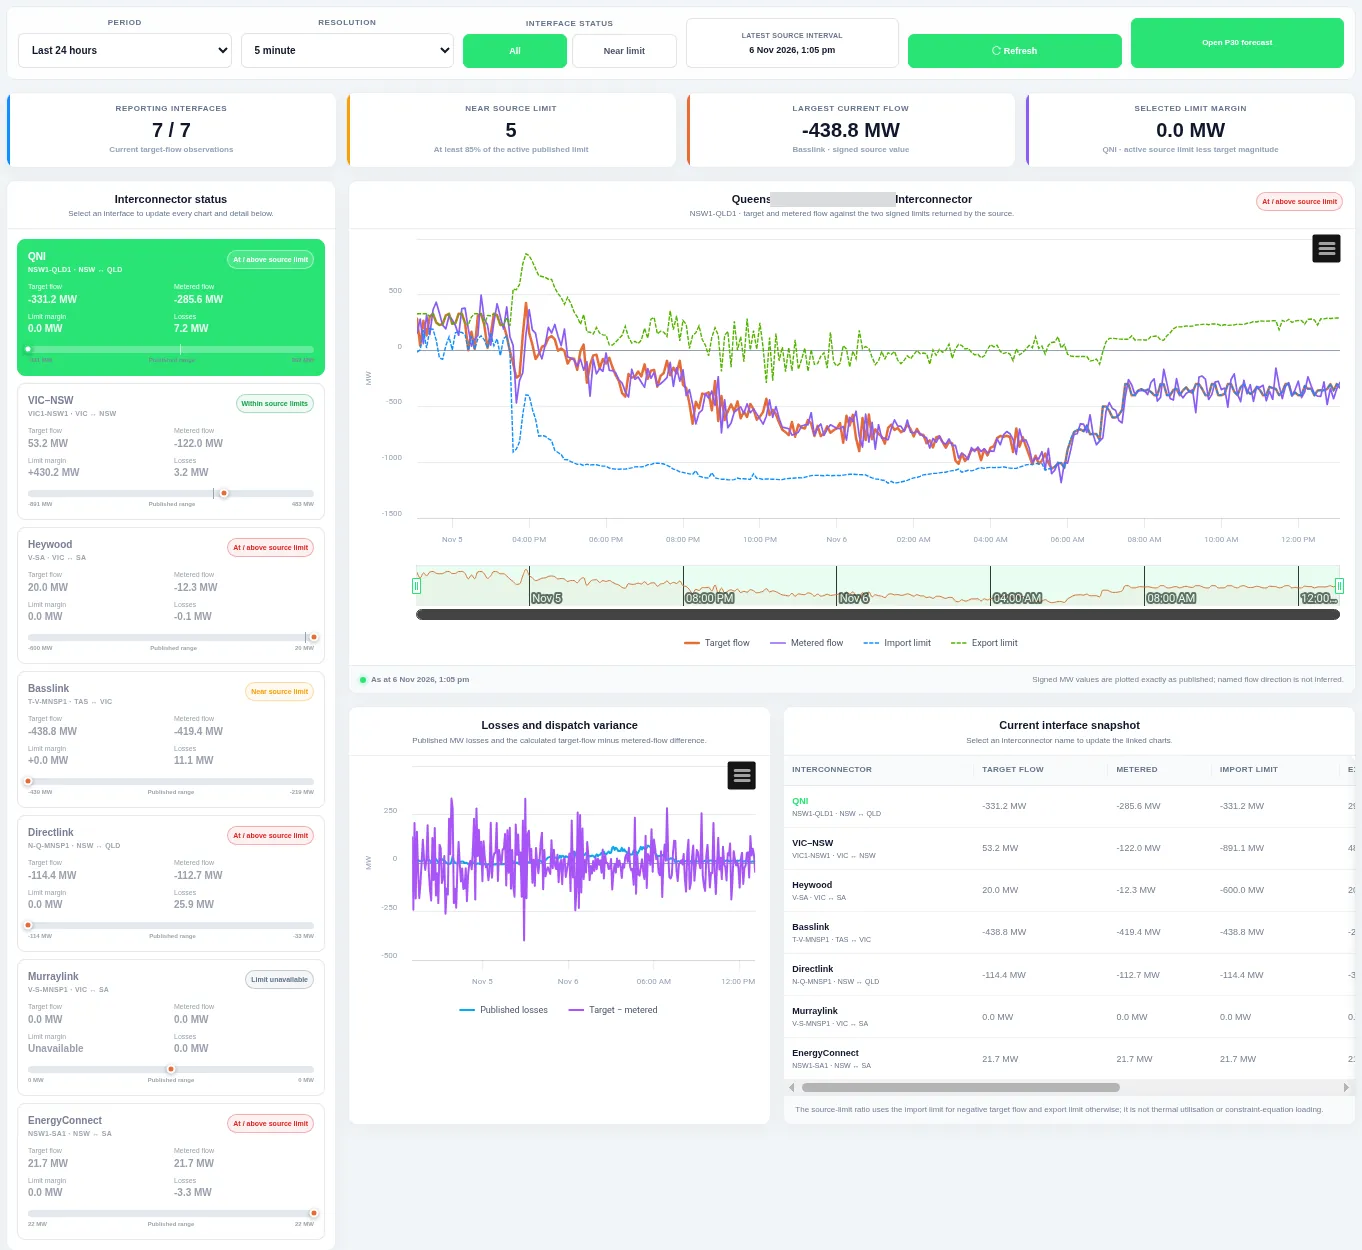
Cards on the left show each interconnector's target flow, metered flow, limit margin and losses; select one to update the main chart of target and metered flow against its limits. Below are losses and a snapshot table; filter to interconnectors near a limit with the status buttons.
Regional Connectivity
Shows the current NEM regional connectivity after regulated interconnectors at a dispatch limit are removed. Regions that stay joined form one group.
Regional Connectivity History
Shows the NEM regional topology and the bound regulated interfaces across retained dispatch intervals. Choose the Period, for example 24 hours. Times are fixed AEST (UTC+10).


