

NEM Constraints and Dispatch, on the Map
25 dashboards for the National Electricity Market, from binding constraints and marginal values to bids, FCAS and outlook, alongside the network itself.
225 countries • Updated daily • ISO/IEC 27001 certified • GDPR compliant • Cancel anytime
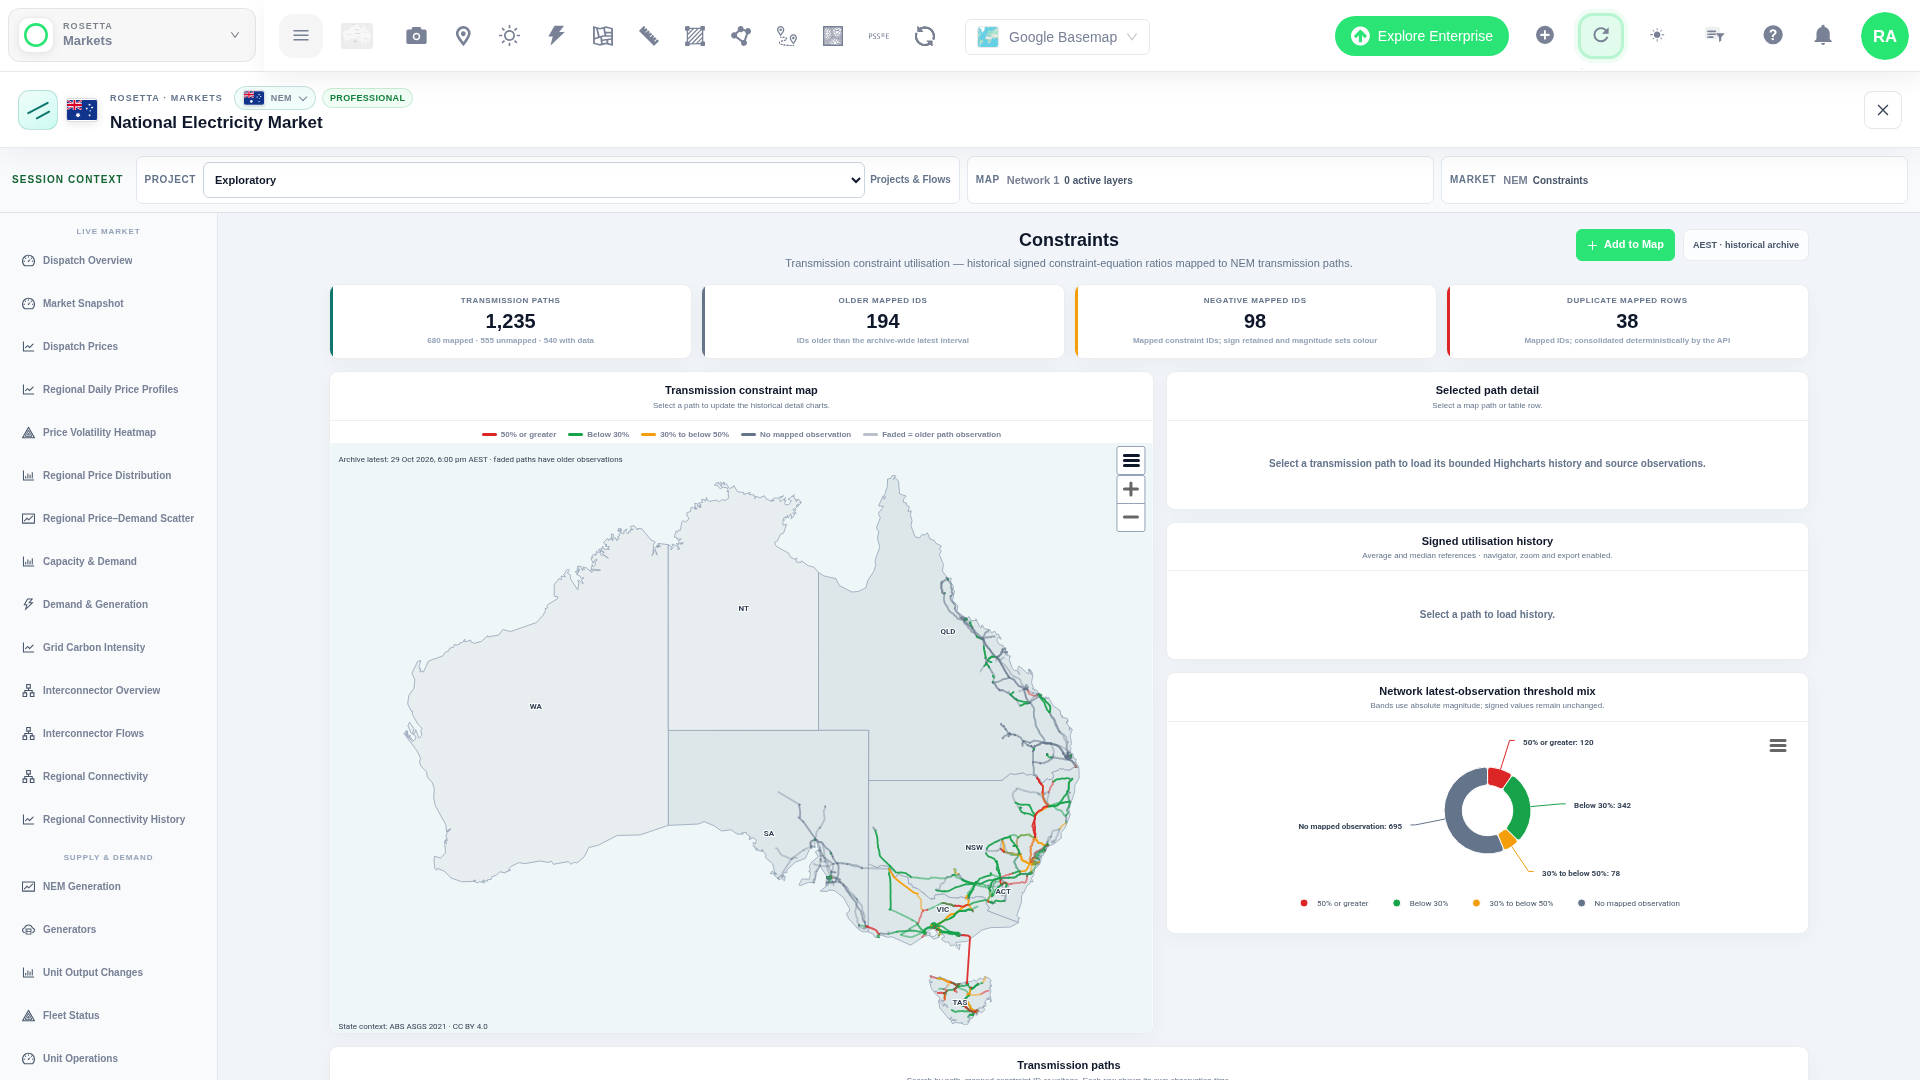
Constraints map: binding constraints across the NEM, with utilisation history.
Constraint Analysis
See where the network binds, why, and what it costs.
Constraints Map
Binding transmission constraints across the NEM on the map, with utilisation and history.
Constraint Set Analysis
Which constraint sets are invoked, when, and for which outages.
Constraint Equation Analysis
Left-hand and right-hand side history for individual constraint equations.
Dispatch Constraint Marginal Values
The cost of each binding constraint in dispatch, ranked.
Constraint Investigation
Trace an interval back to the constraints and units that set the outcome.
Generator Output Heatmap
See when units were held back, interval by interval, to spot curtailment patterns.
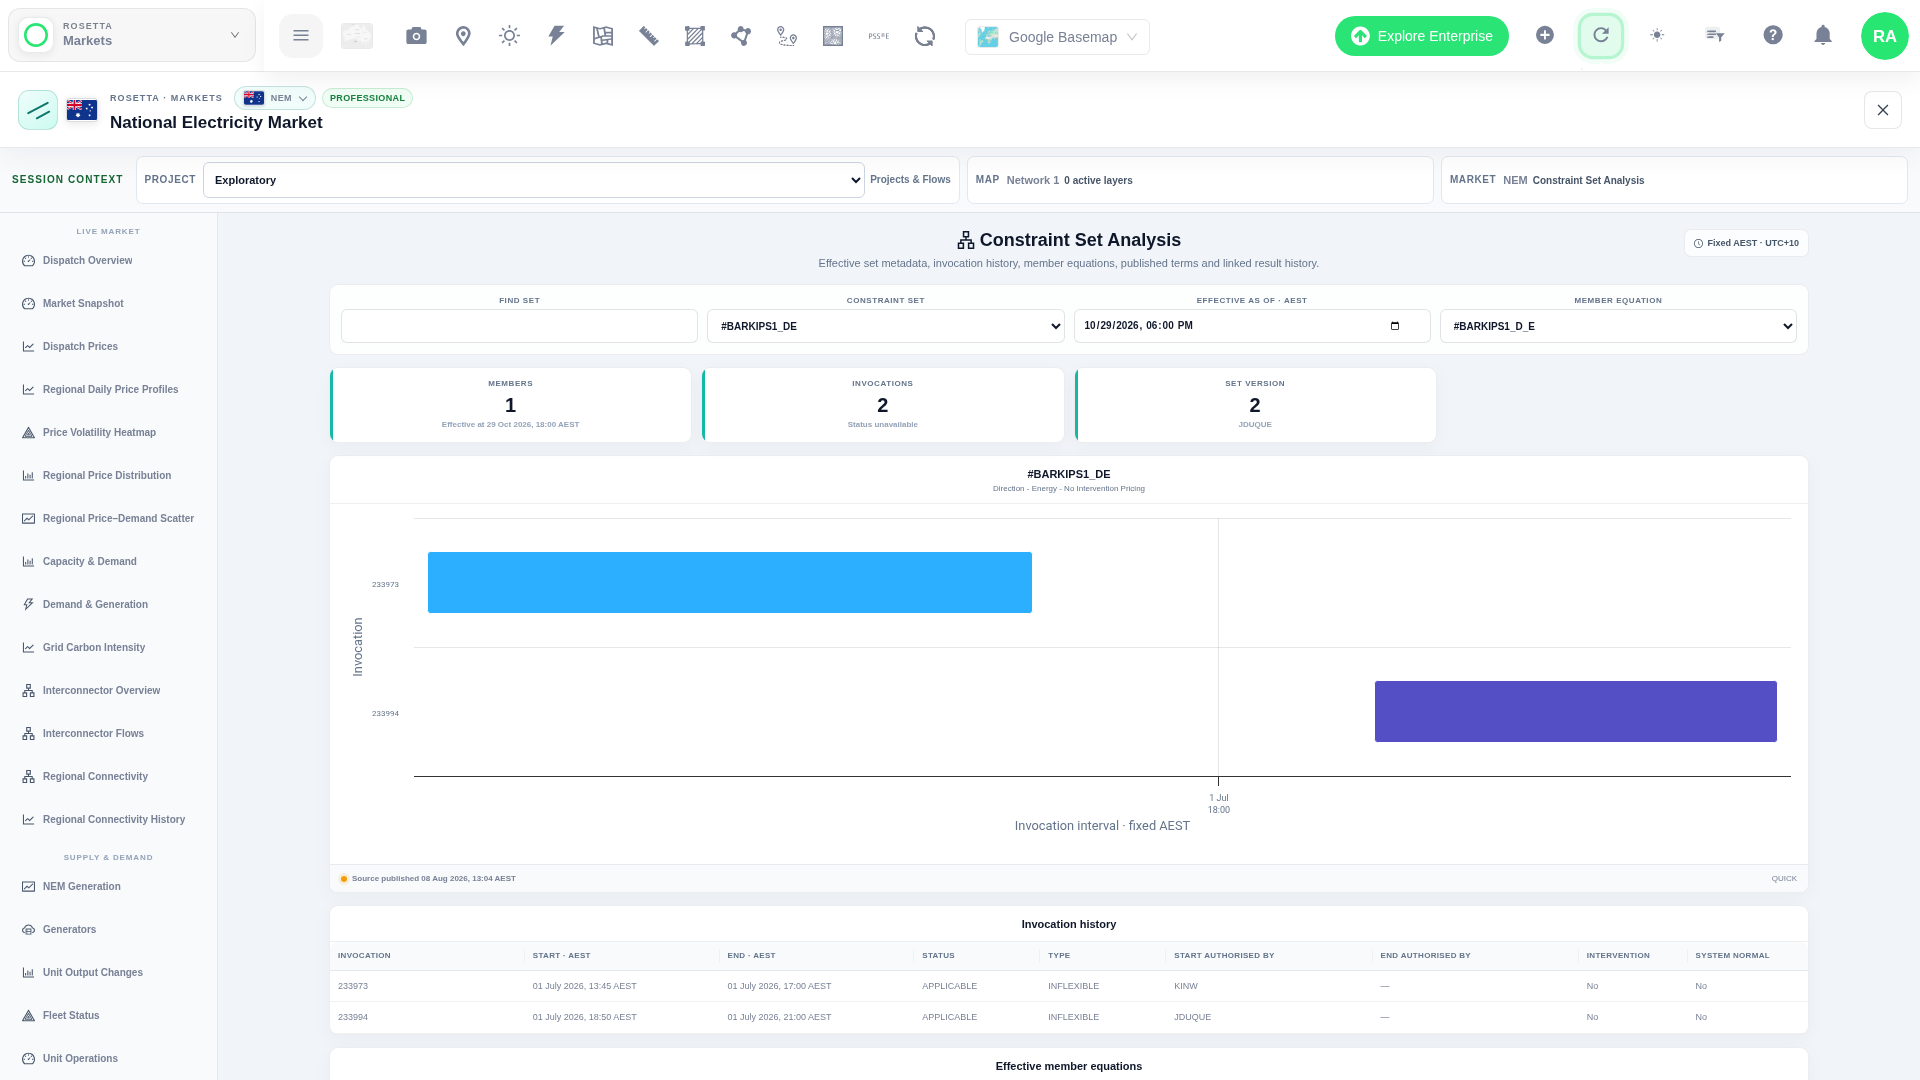
Constraint Set Analysis
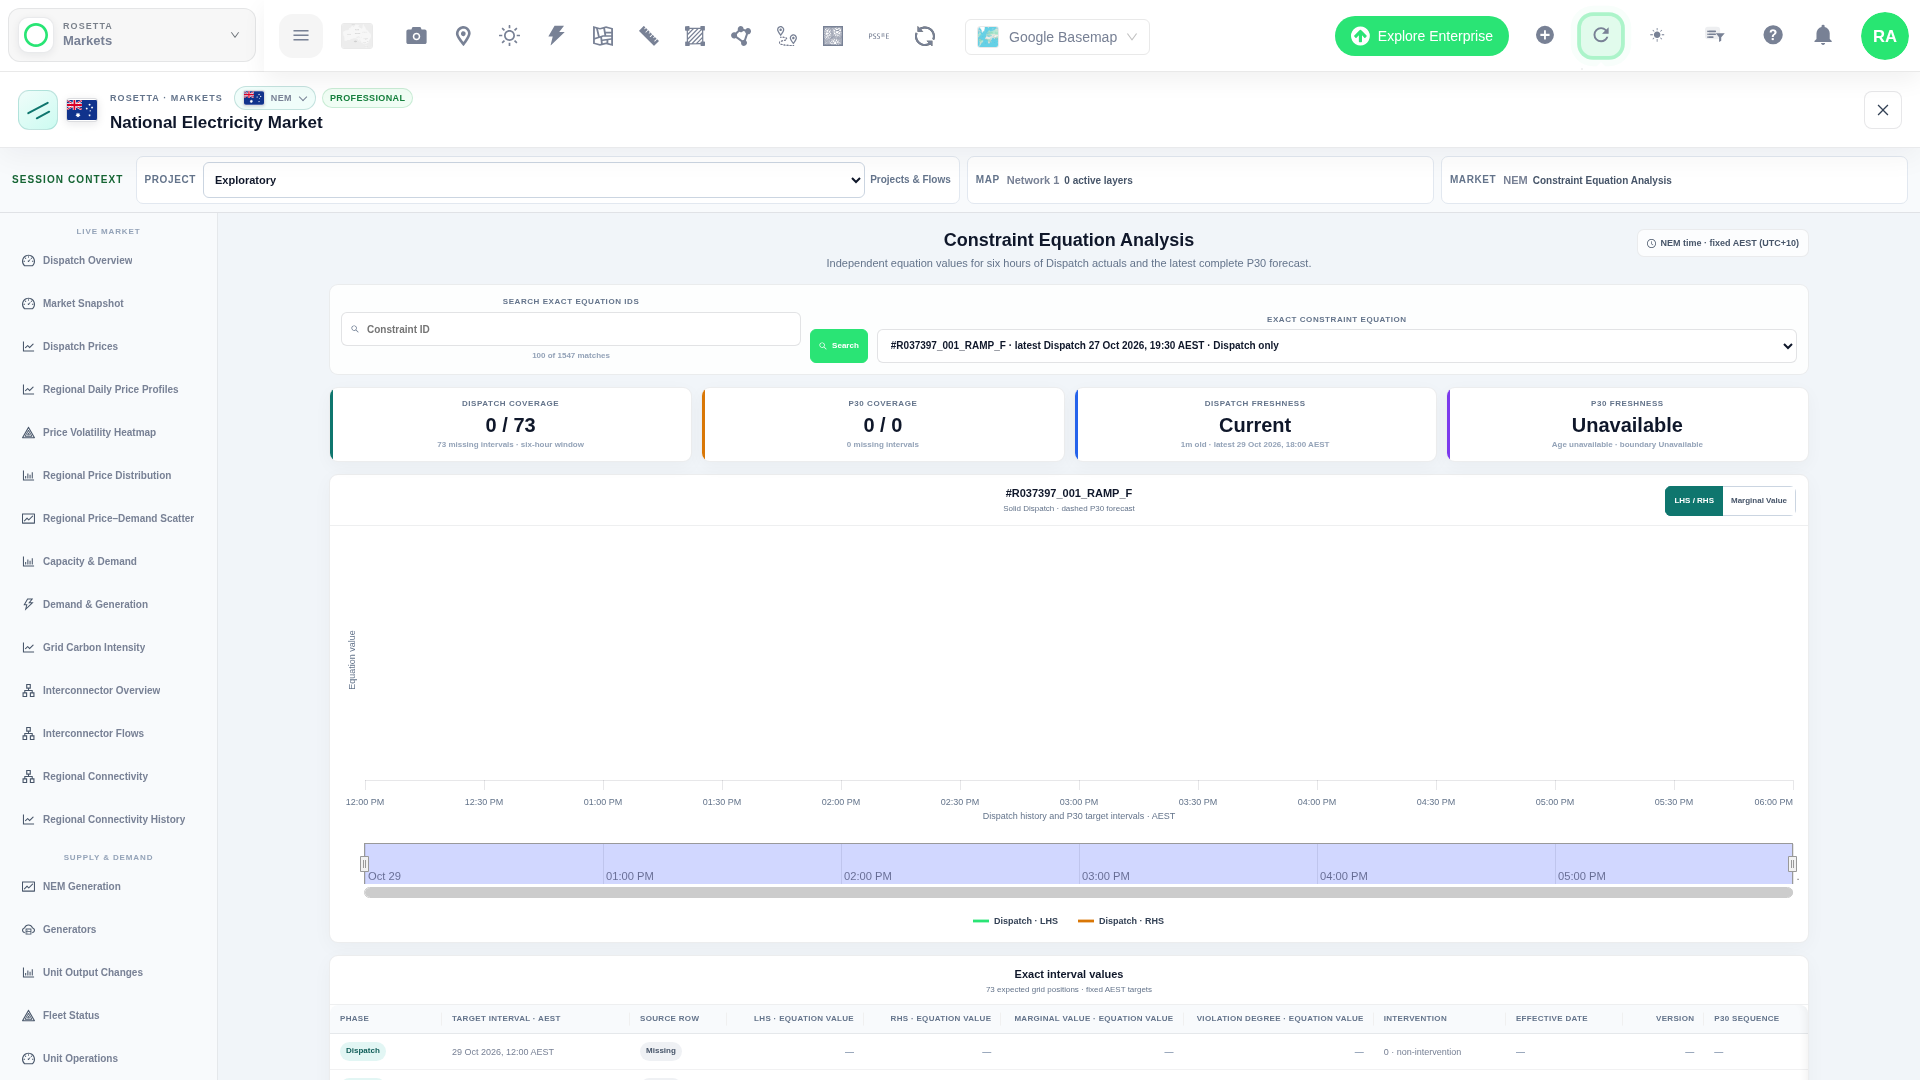
Constraint Equation Analysis
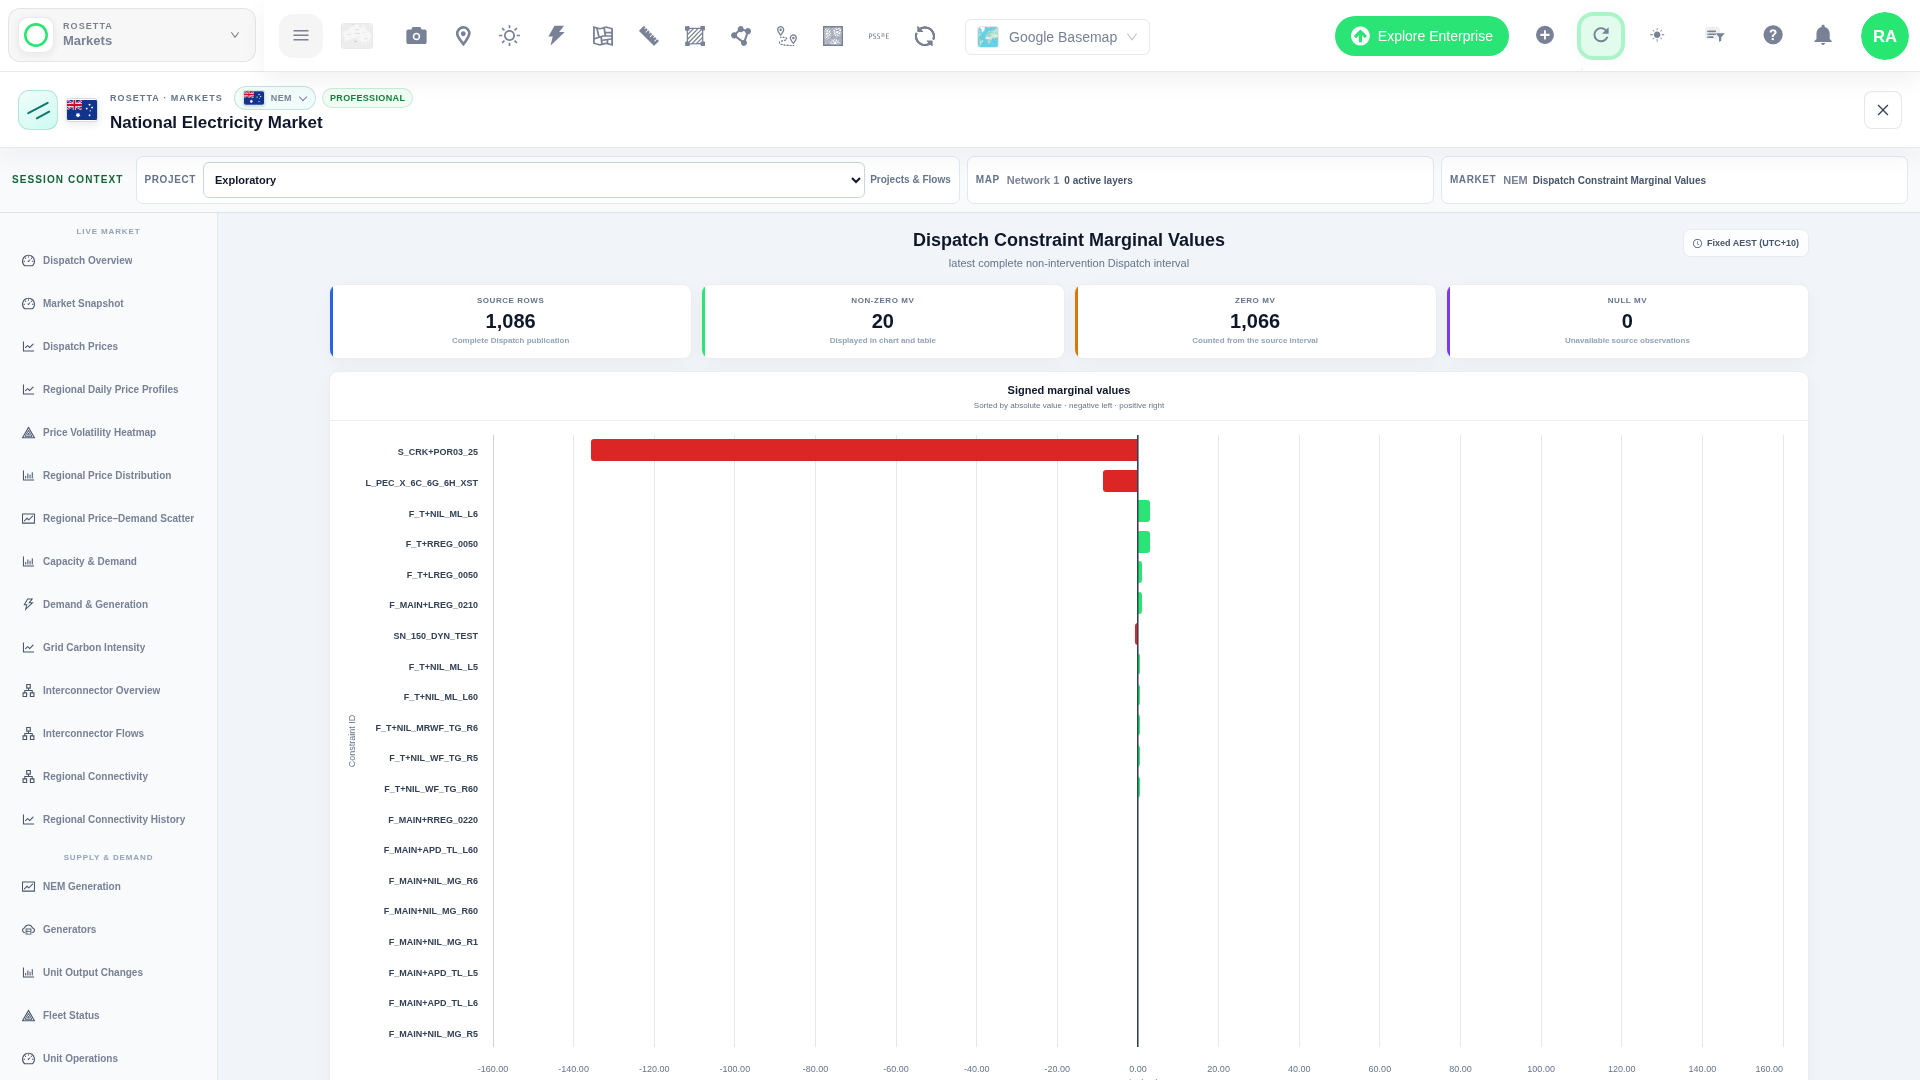
Dispatch Constraint Marginal Values
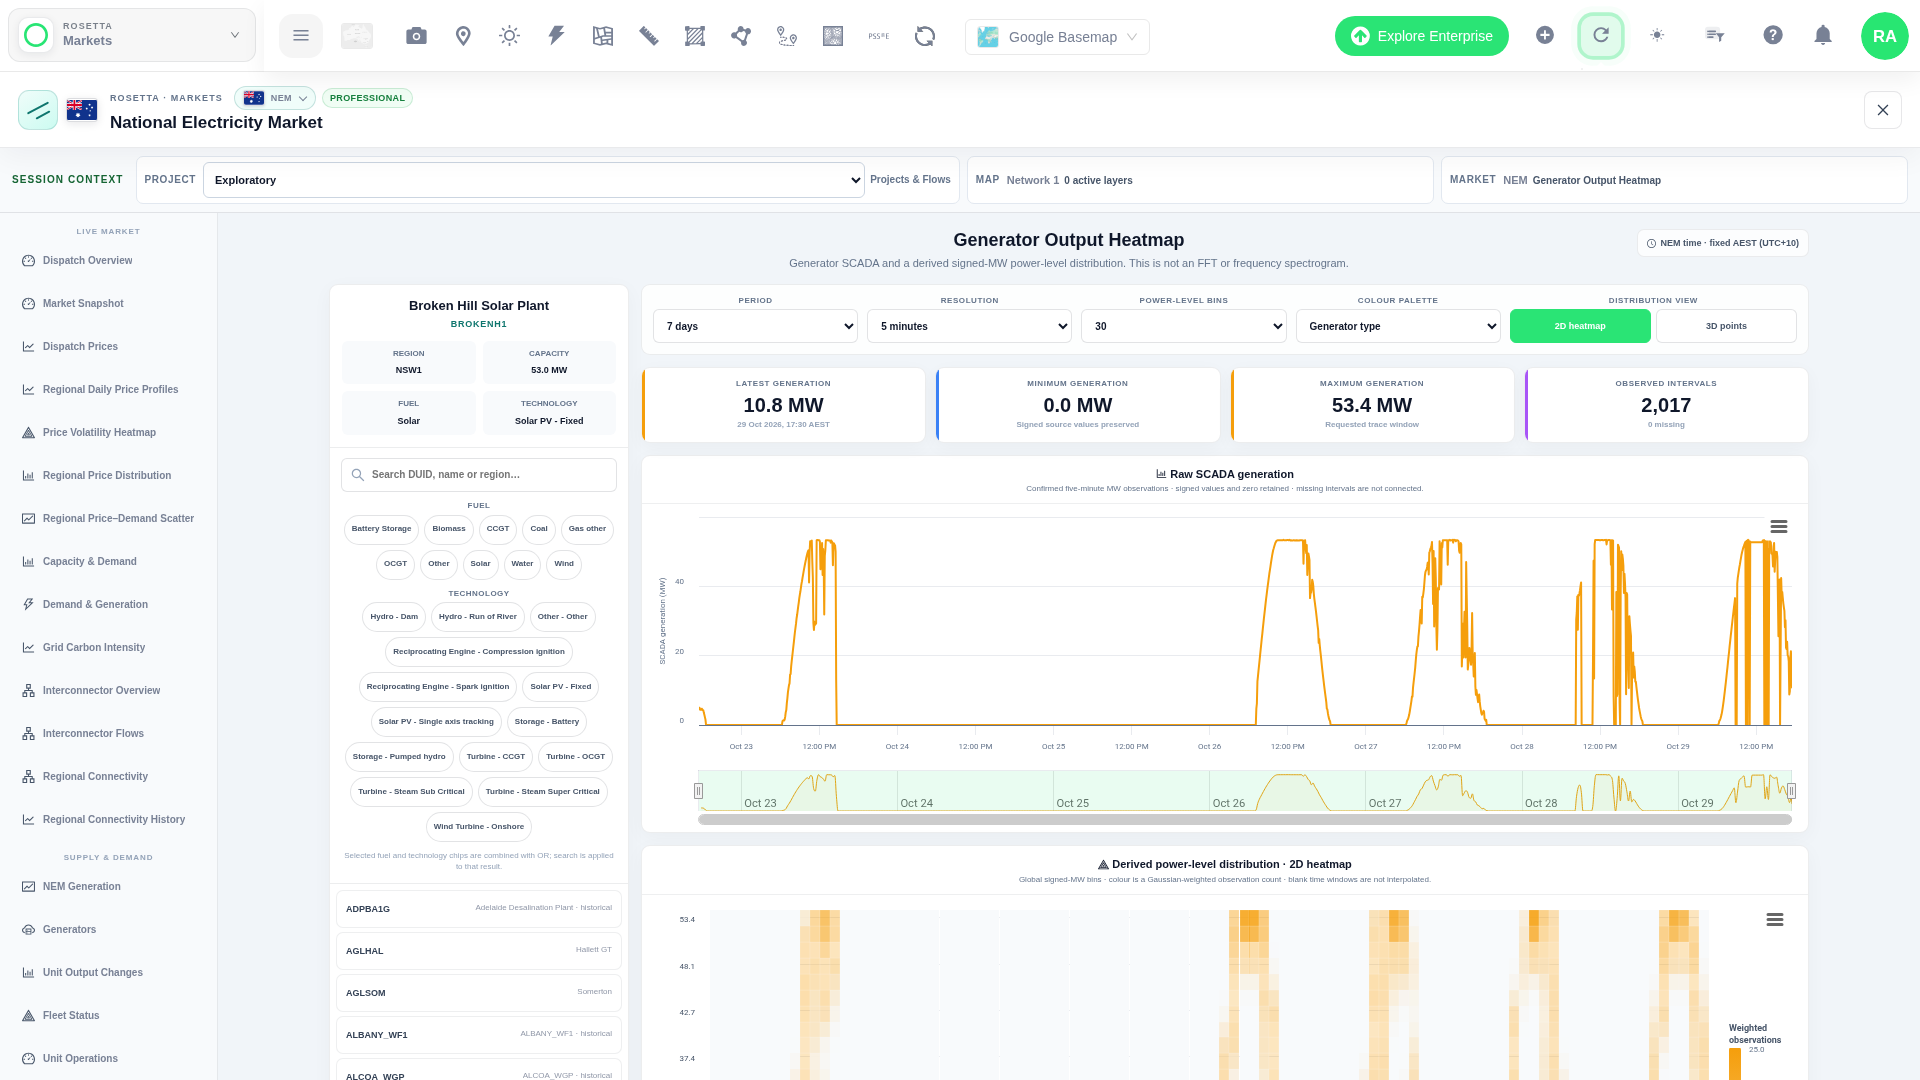
Generator Output Heatmap
Dispatch, Bids and Outlook
Everything around the constraint, in the same workspace.
Dispatch & Prices
Dispatch Overview, Market Snapshot, Dispatch Prices and Price Volatility Heatmap by region.
Interconnectors
Interconnector overview, flows and predispatch forecasts.
Generation & Fleet
NEM generation mix, grid carbon intensity and fleet status.
Bids
Bid history and applied bid progression for every unit.
FCAS
FCAS prices and FCAS offer progression.
Outlook & Notices
Medium-Term Adequacy (PASA), electricity futures, NEM outages and AEMO notices.
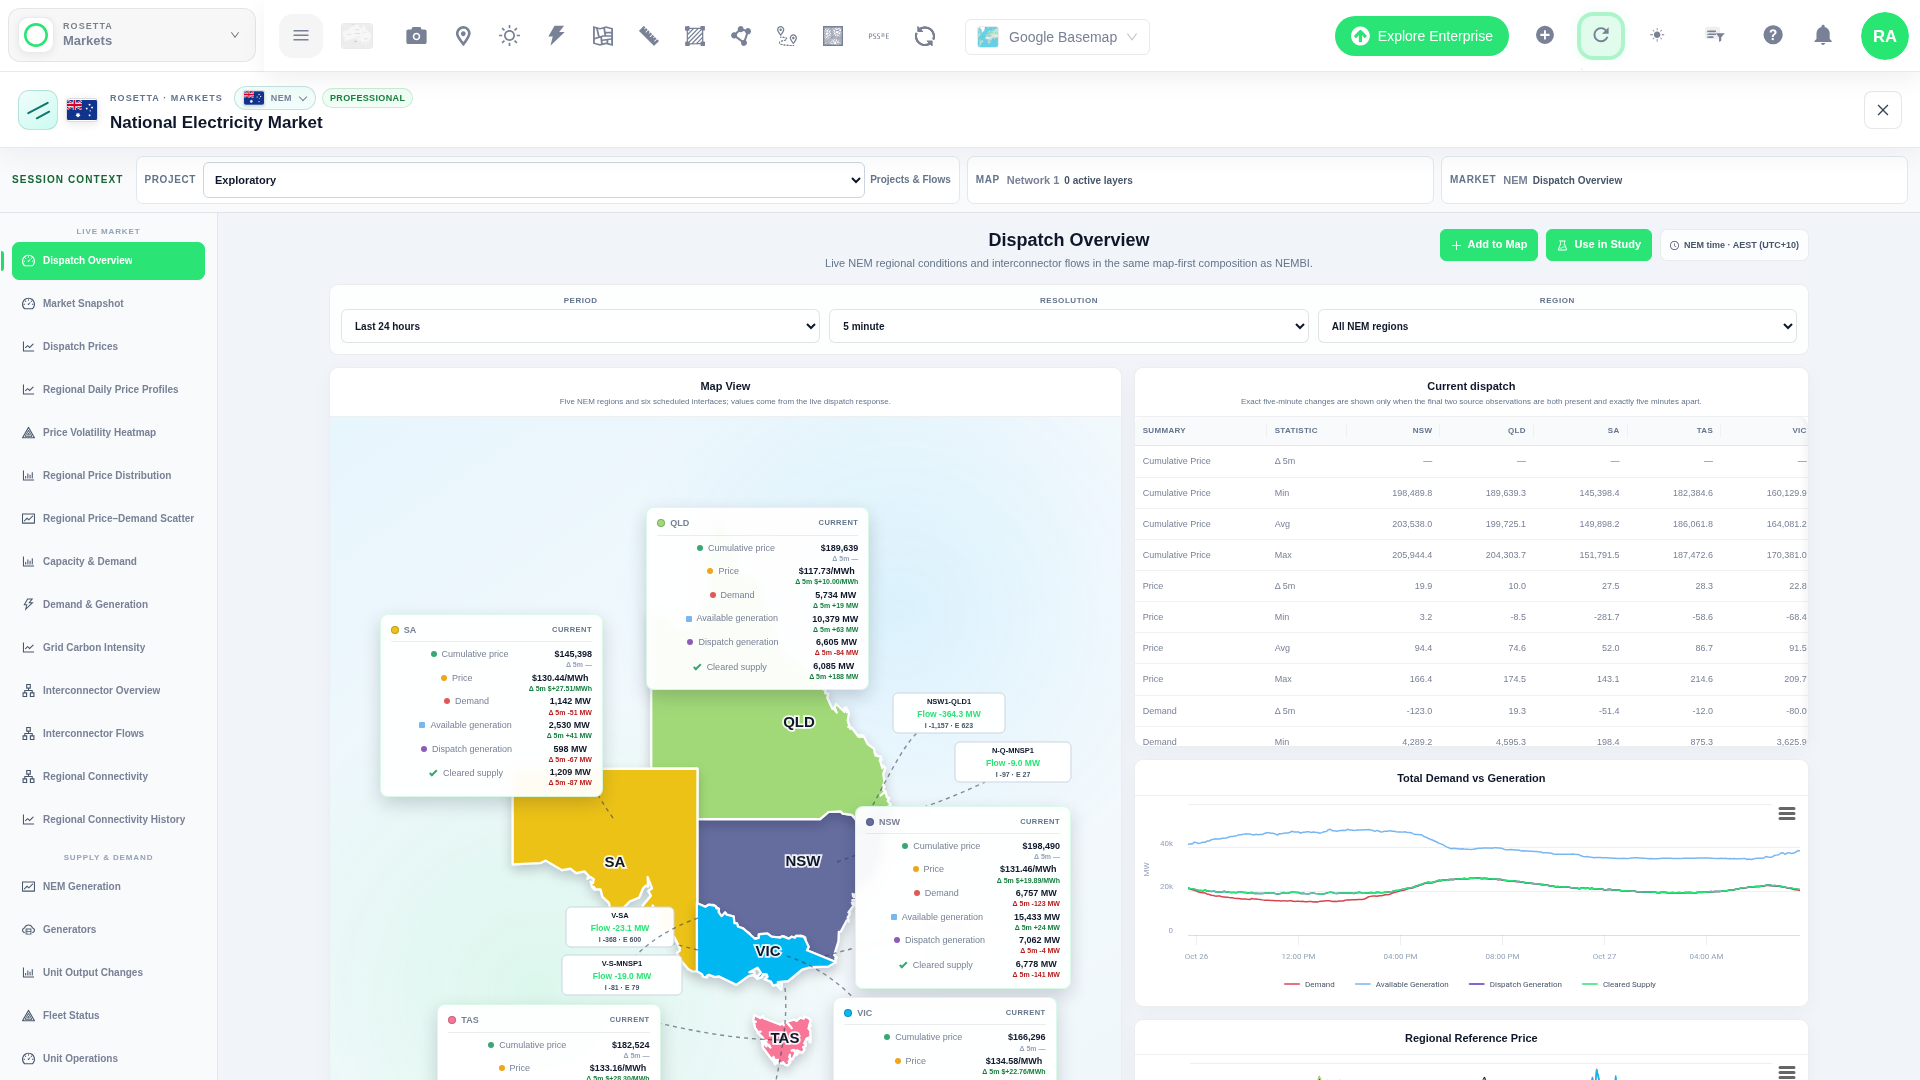
Dispatch Overview
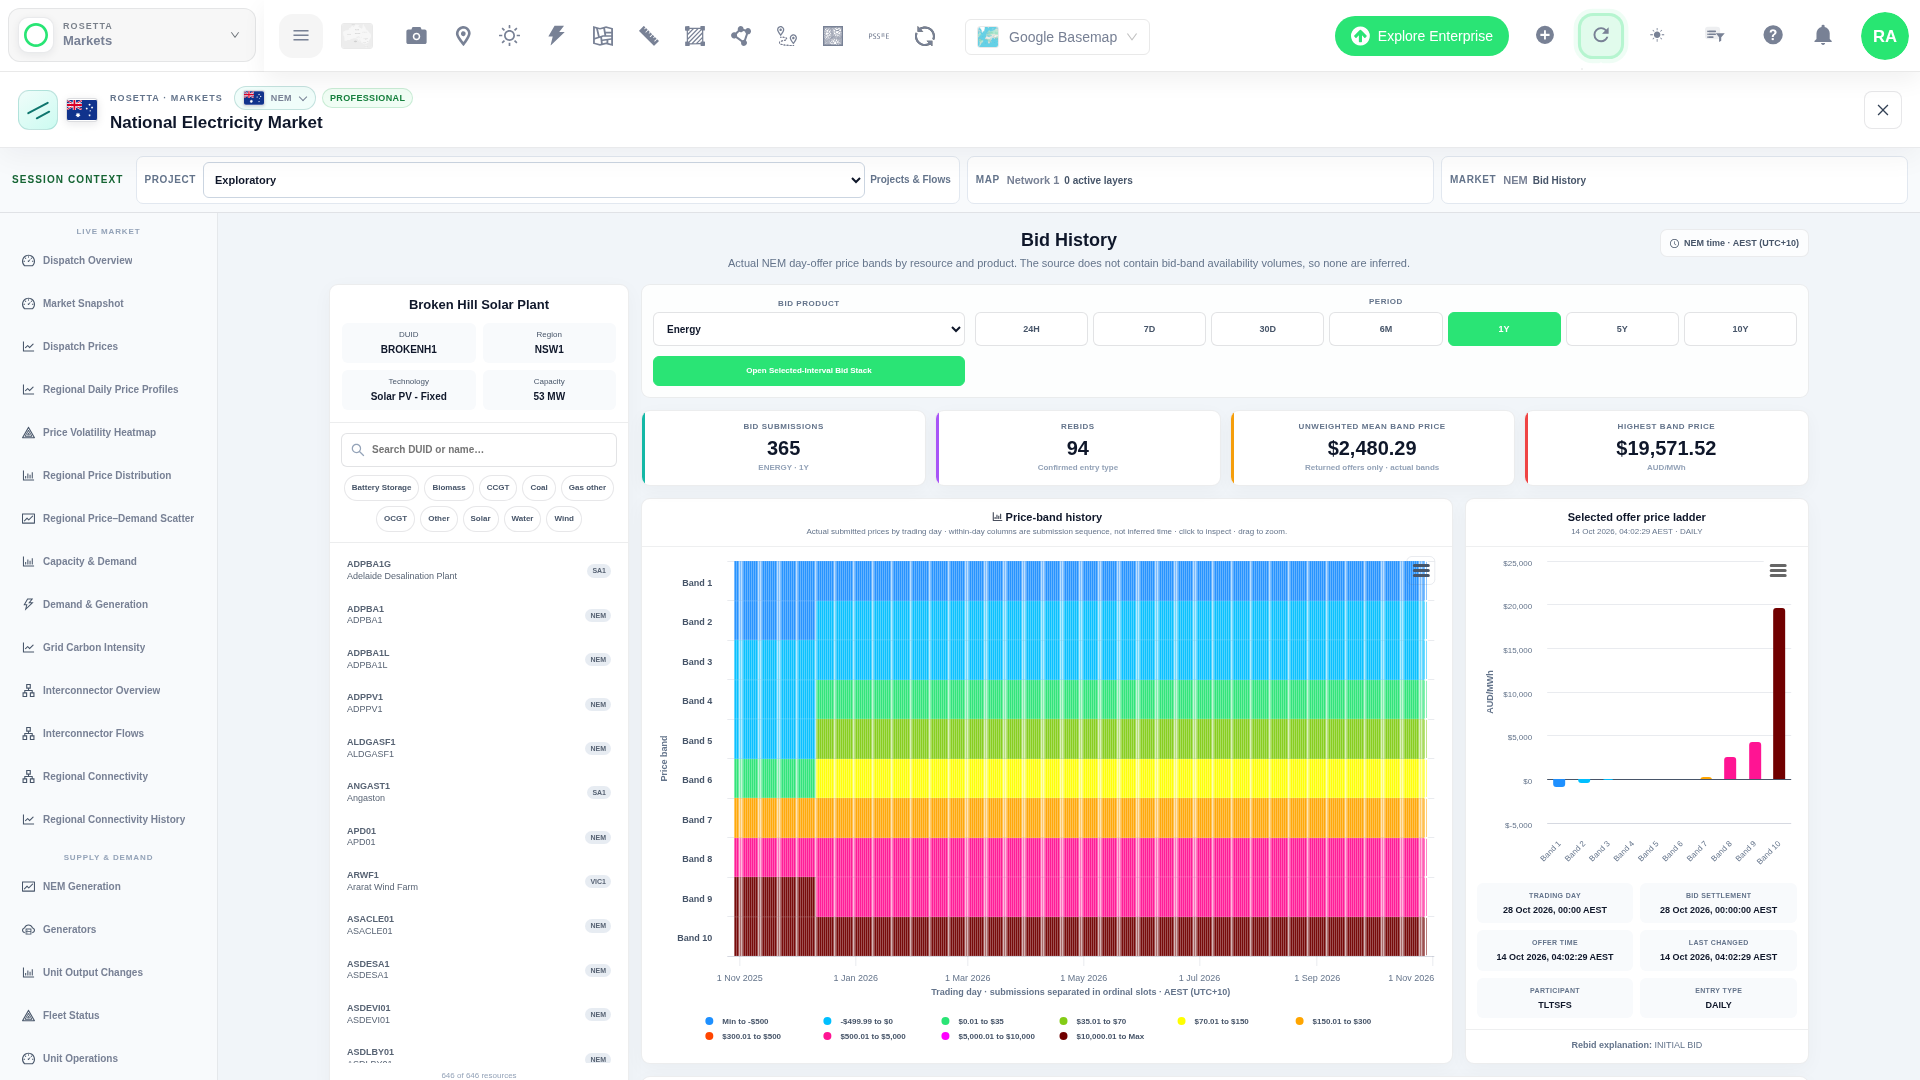
Bid History
From a Site to the Constraint Behind It
Find a site on the map and load the transmission lines and substations around it.
Open the constraints map to see which constraints bind nearby and how often.
Drill into constraint equations, marginal values and bids to understand curtailment risk.
Free and Live Since February 2025
Our public NEM Transmission Constraint Map is free and updated every 5 minutes from AEMO dispatch data. Open it, switch on Transmission Constraint Map, and select any line to see its constraint utilisation history. Network Map launched it in February 2025; the full constraint suite in Network Map Markets builds on it, alongside 14 more markets.
Included with Pro, $150/month
Network Map Markets, including the NEM constraint suite, is included with Pro and Enterprise, together with PSS®E and CSV export, single-line diagrams and engineering studies.
Trusted by Energy Leaders
Developers, consultants, governments and universities use Network Map every day.








Start Free, Upgrade When You Need Full Access
Create a free account in minutes. Plans from $75/month, cancel anytime, invoices available.
Network Map for DevelopersConsultantsInvestorsData CentersElectricity MarketsAPI & Integrations


