

Docs Menu
East Coast Adequacy and Forecasts
These views show availability and reserve outlooks, predispatch forecasts and the longer-horizon adequacy runs, plus curtailment by cause.
Open any view from Markets in the product switcher, then pick the market and the view from the left-hand menu. See the Network Map Markets Guide for the common controls and plan access.
Views
Outage Recall Outlook
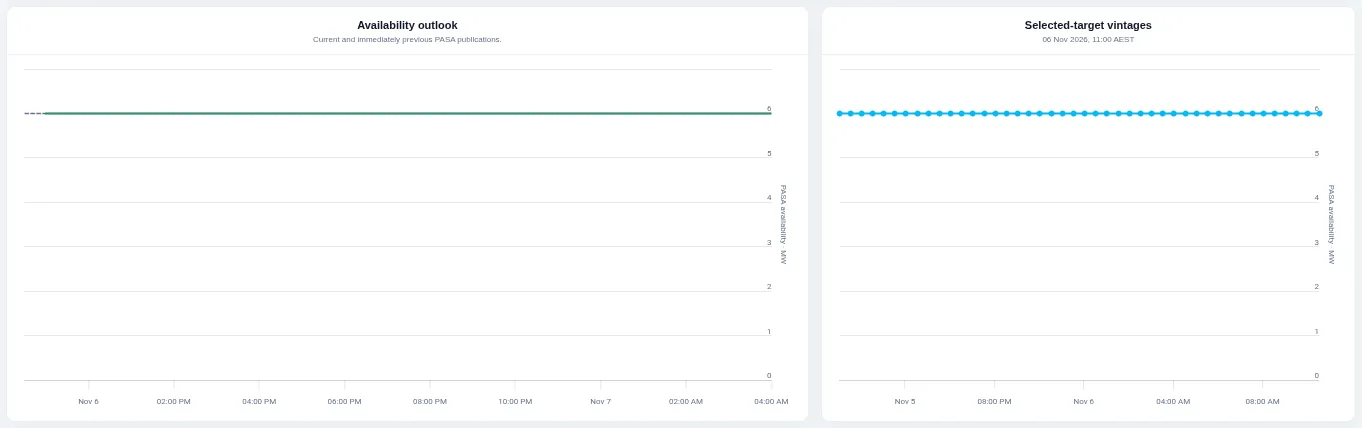
The left chart compares the current and previous availability publications across target dates; the right chart shows how the outlook for one target changed across publications. Choose the source, unit, side and target interval.
Reserve Margin Outlook
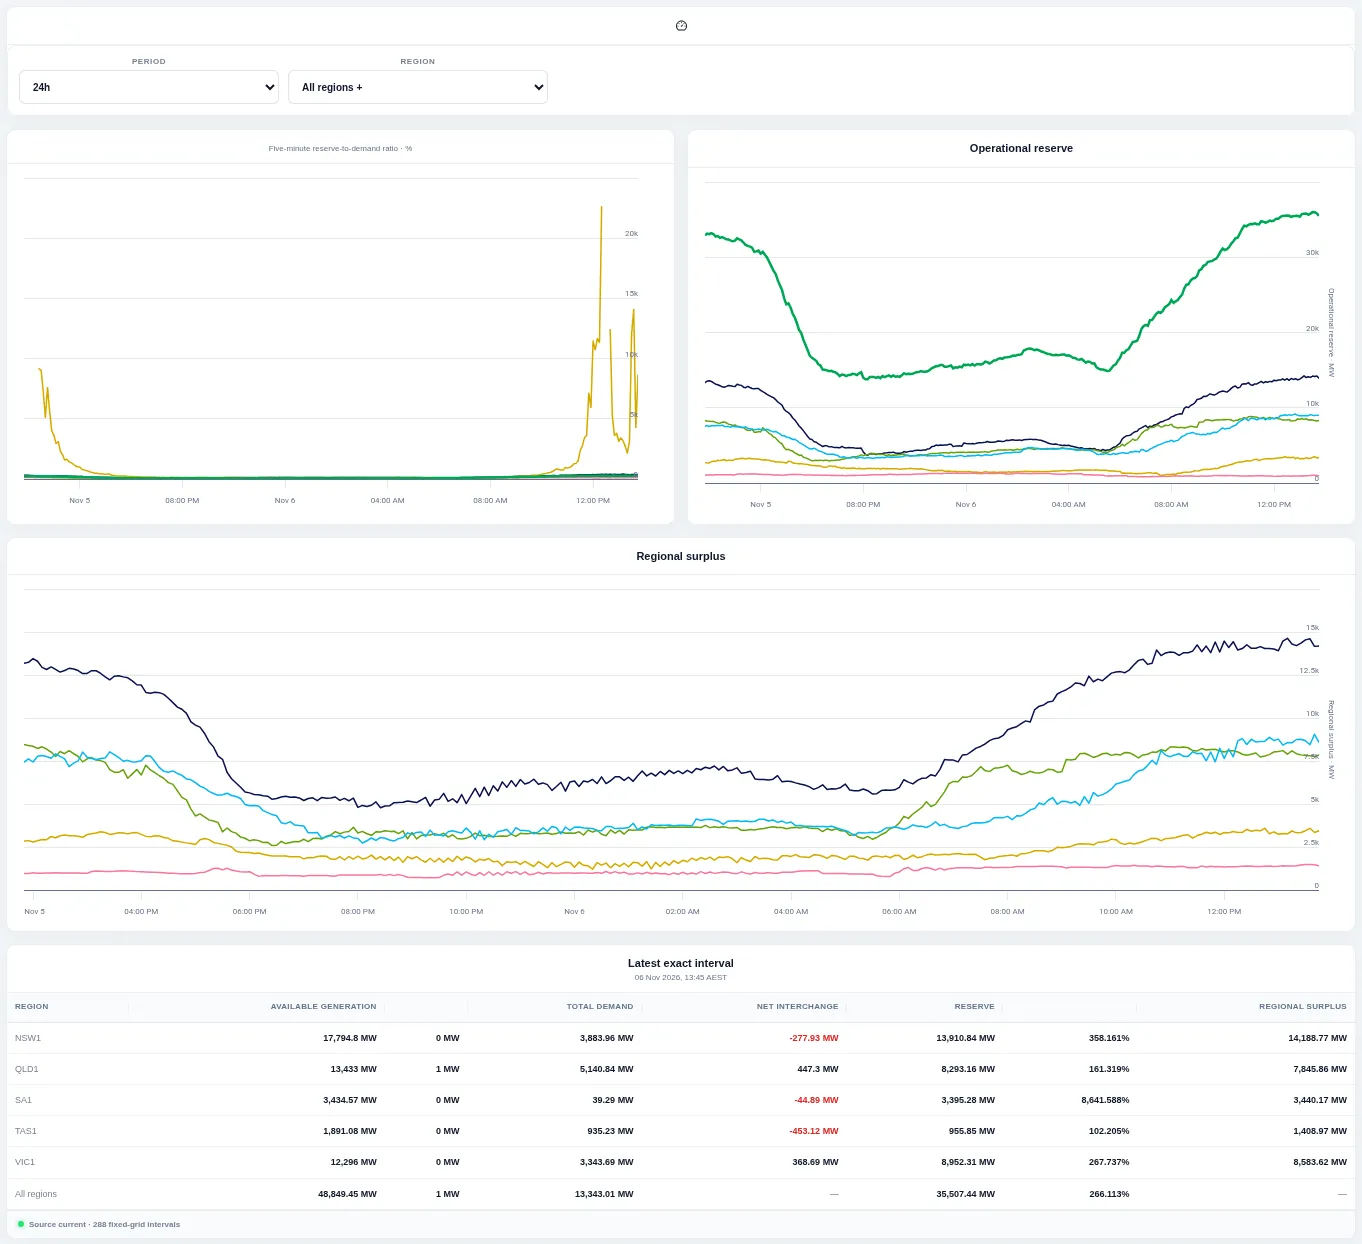
Charts show operational reserve and regional surplus at five-minute resolution, with a table of the latest values. Change the period and region.
Unit Availability Outlook
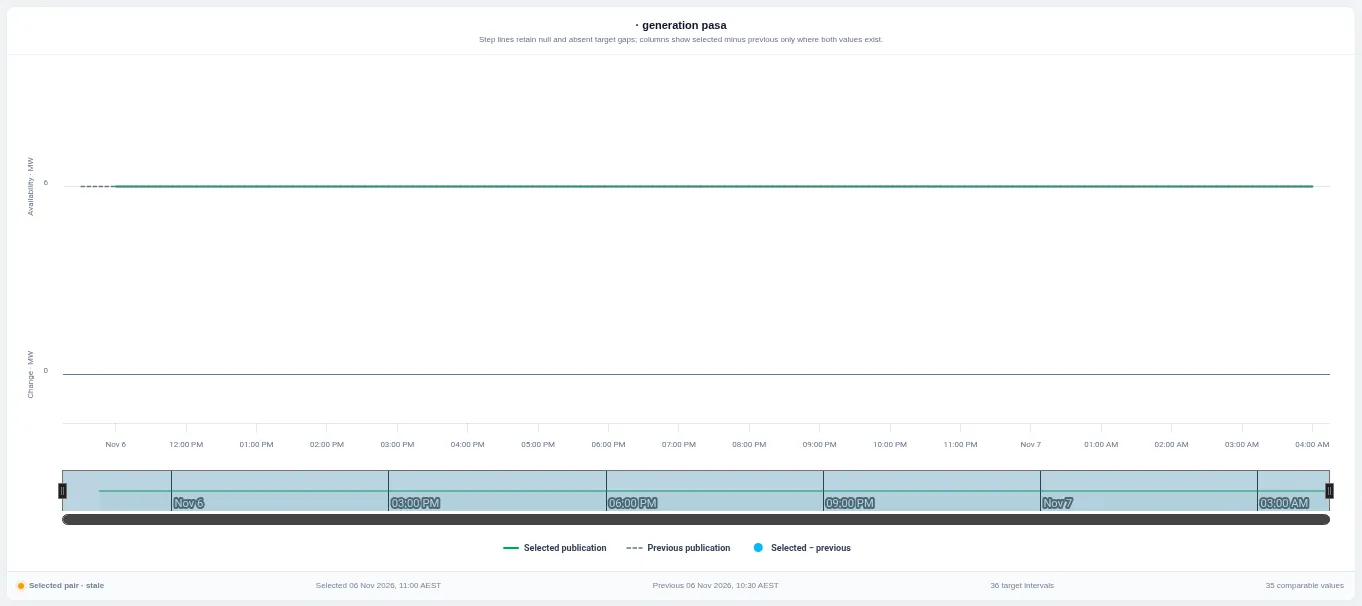
Step lines compare the selected publication with the previous one, and columns show the difference where both exist. Choose the outlook source, publication, unit, side and measure.
Predispatch Adequacy
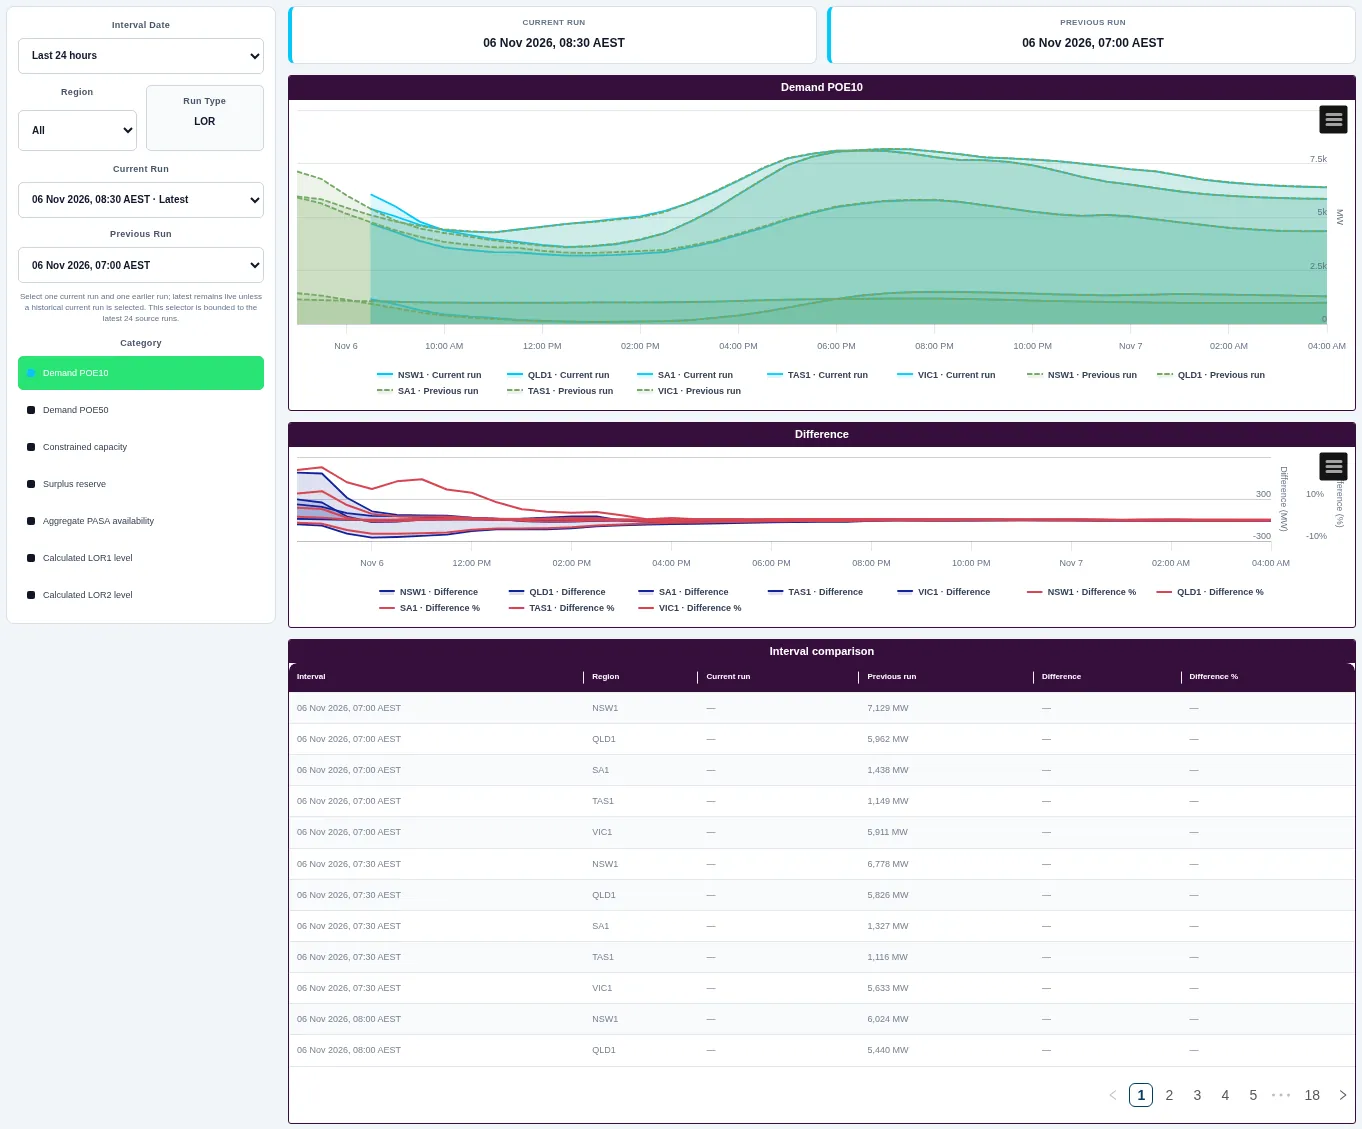
Shaded areas show the regional supply and demand outlook for the latest run, with a second chart of changes from the previous run and a table below. Choose the period, region and the two runs to compare.
Price Sensitivity Scenarios
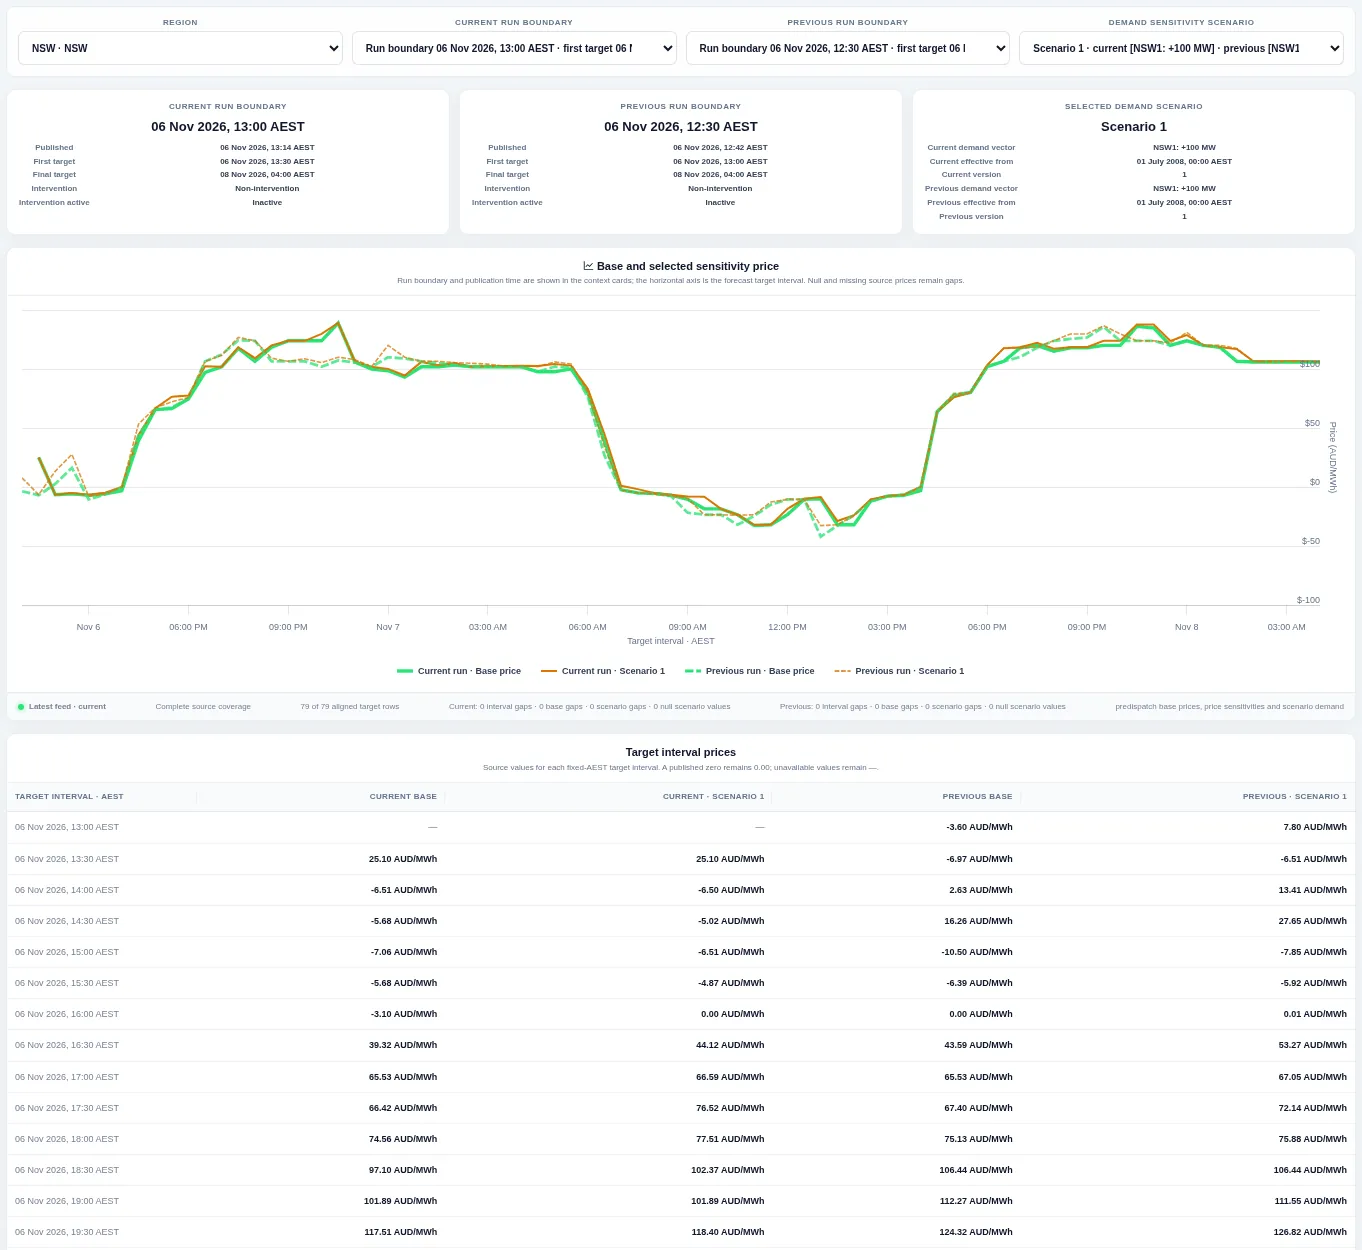
Lines show the forecast regional base price and the prices published for demand-sensitivity scenarios. Choose the region, the runs to compare and the scenario.
Predispatch Price Convergence
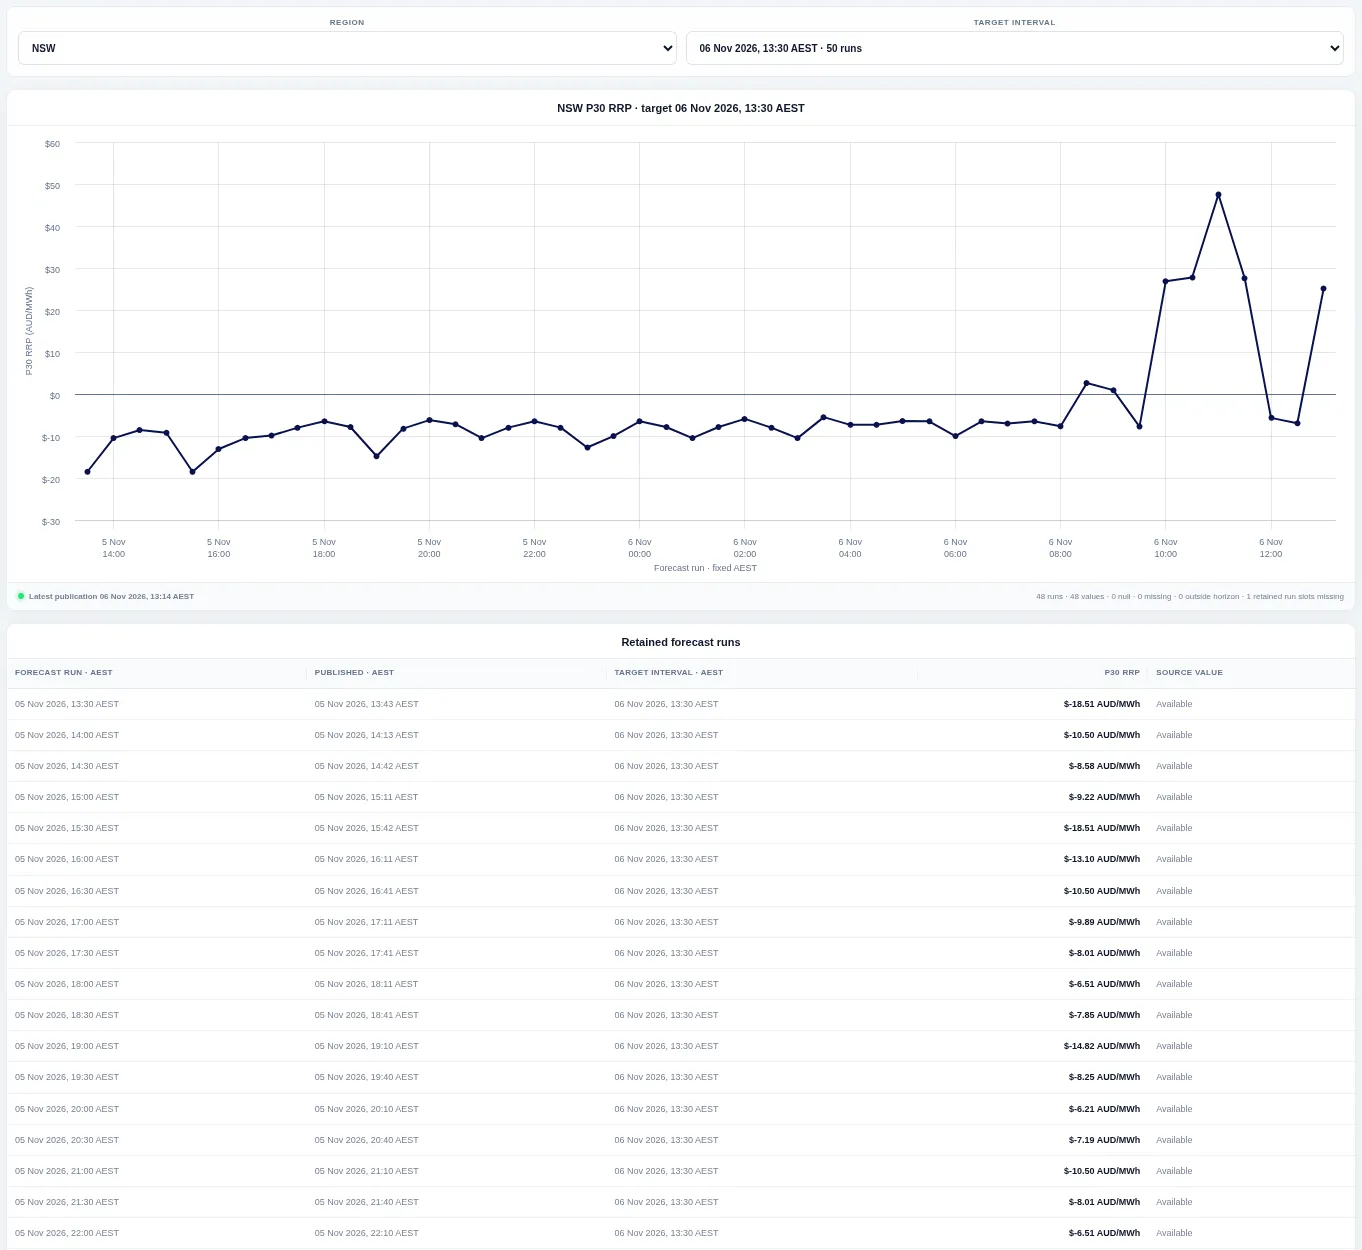
Each point is the forecast price for the chosen target interval from one forecast run, so you can see whether forecasts moved towards the final price. Choose the region and target interval.
Regional Predispatch Outlook
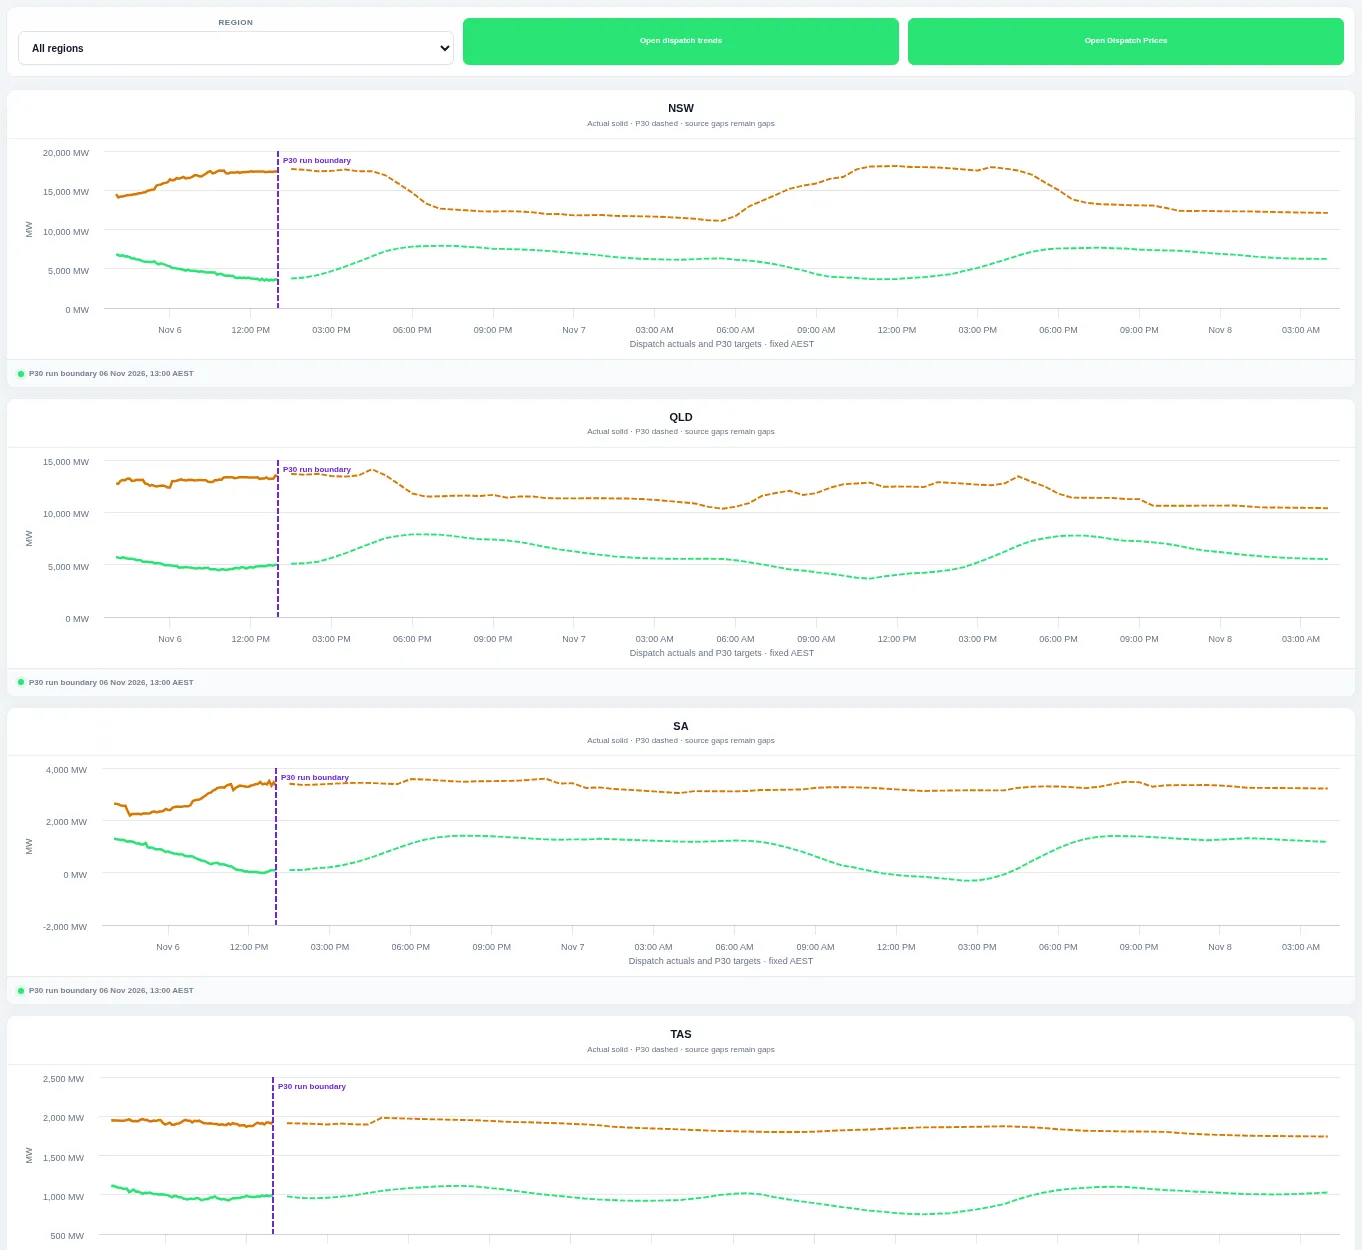
One chart per region shows recent actual demand and available generation, then the latest forecast for the hours ahead. Choose a region or all regions.
Regional Demand Forecast Convergence
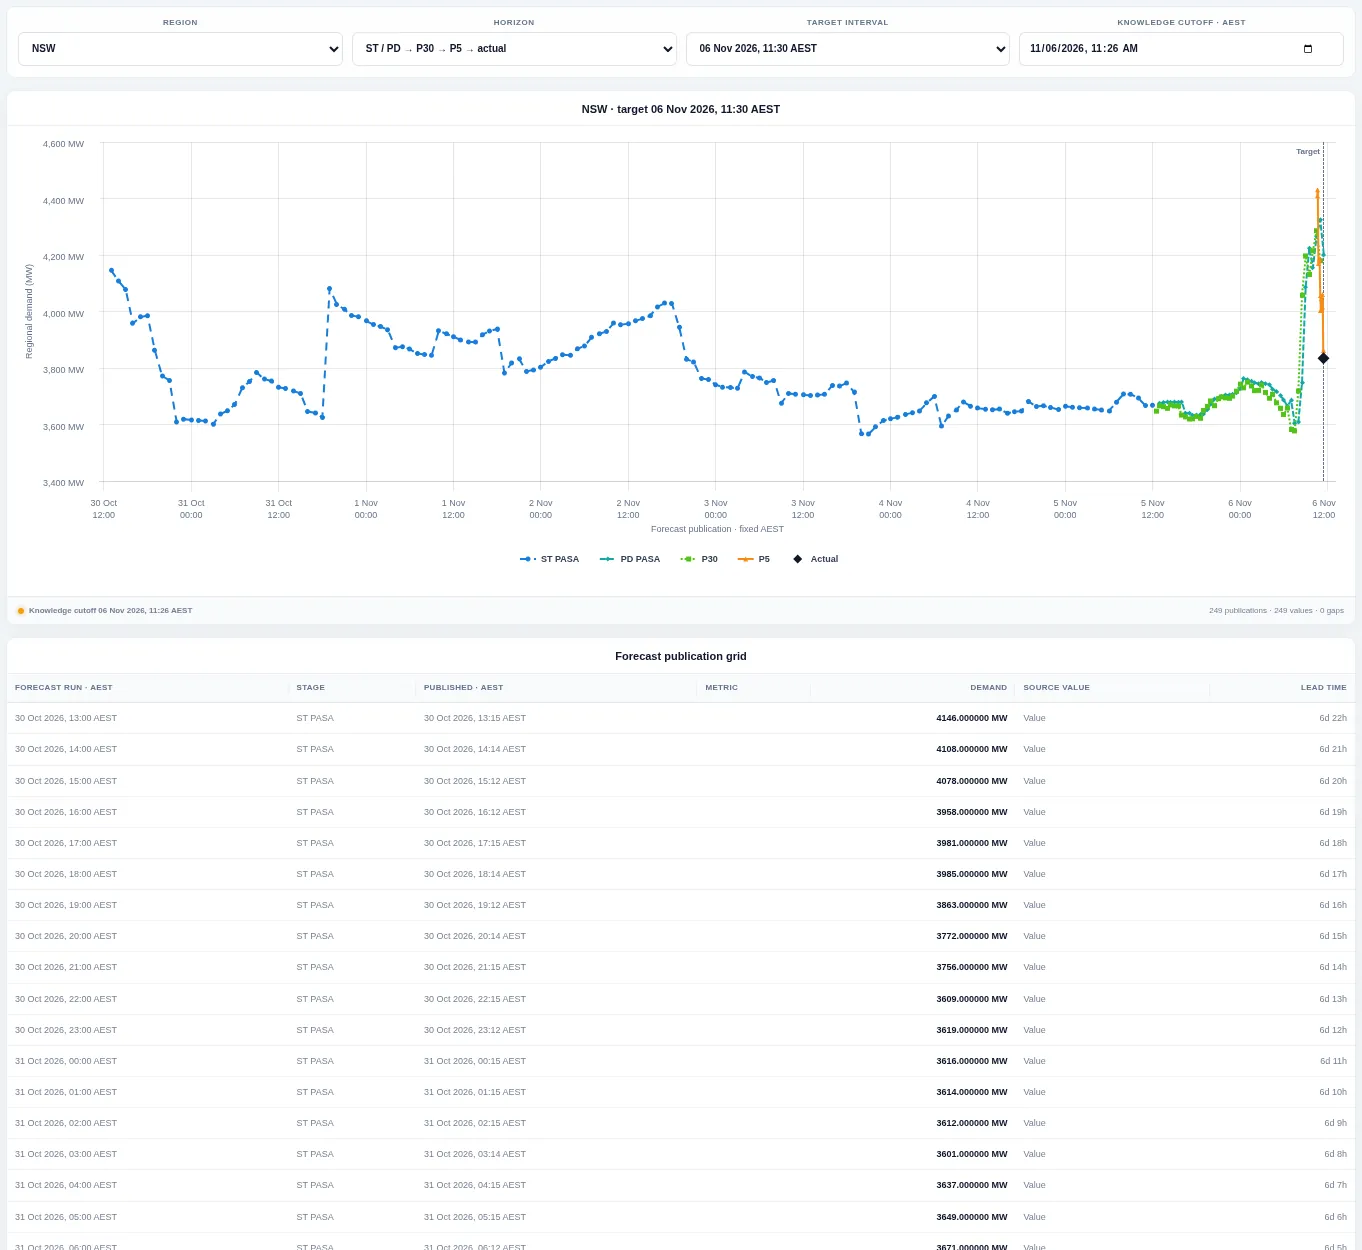
Lines show successive demand forecasts for the target interval, ending with the actual value. Choose the region, forecast mode and target interval.
Regional Price Outlook
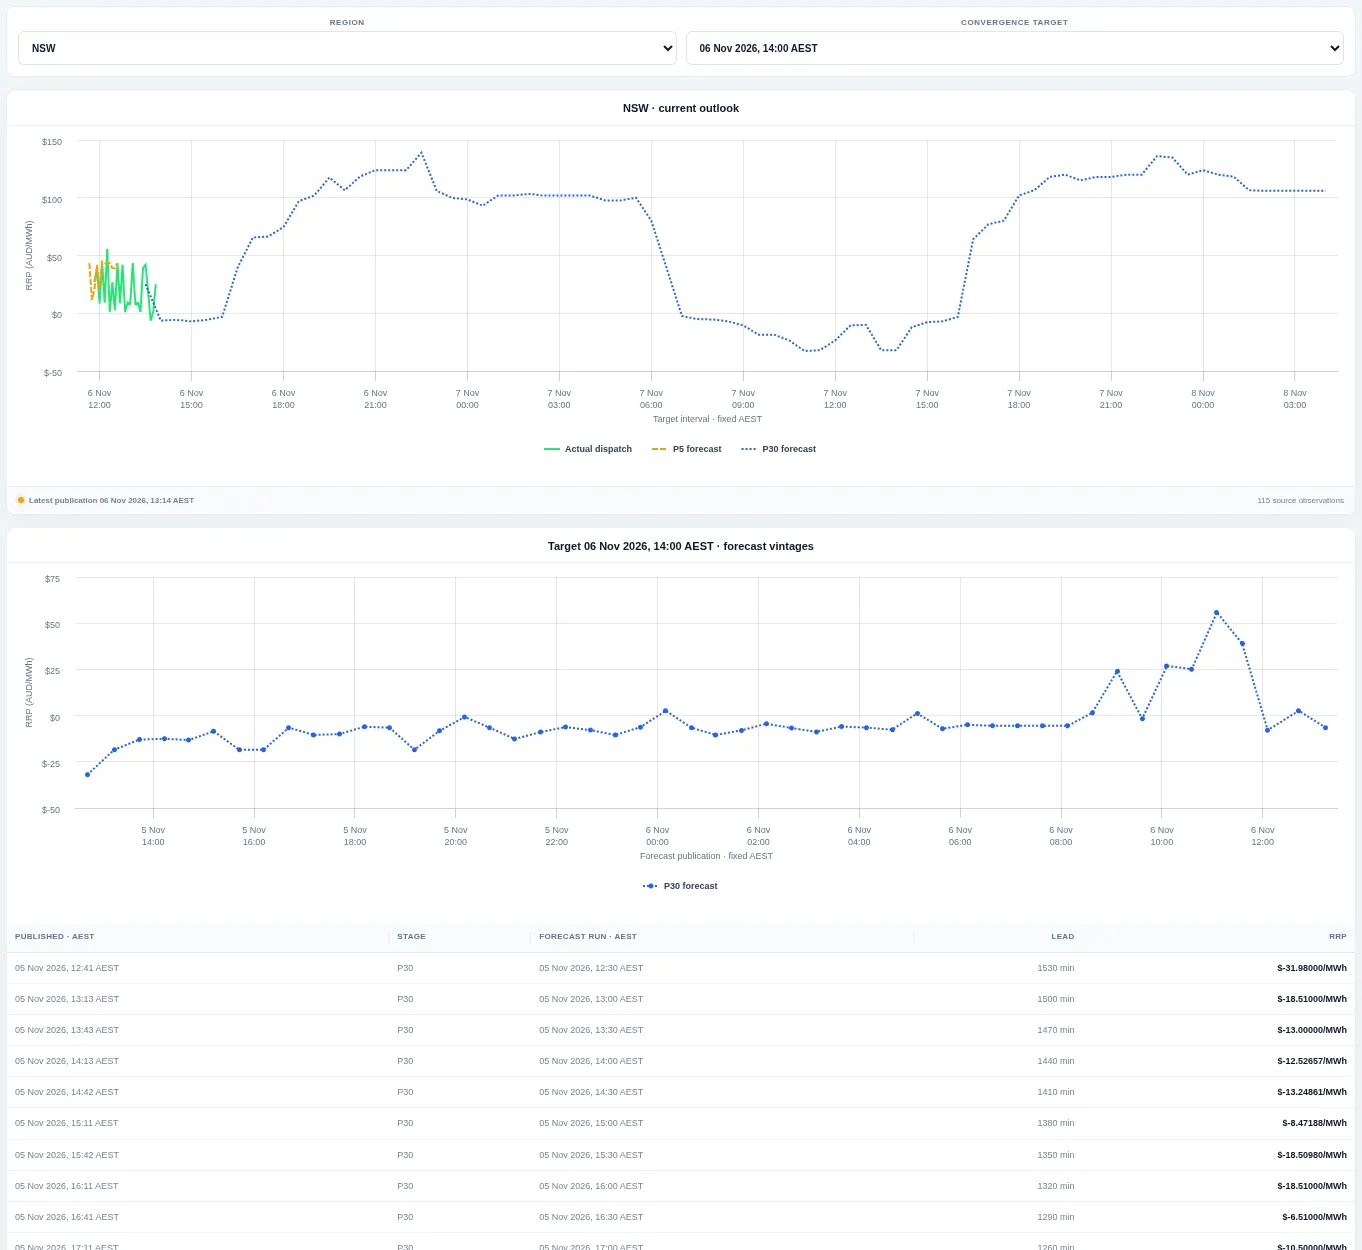
The top chart joins recent dispatch prices to the five-minute and thirty-minute forecasts; the lower chart tracks the forecast for one target interval. Choose the region and target interval.
Curtailment by Cause
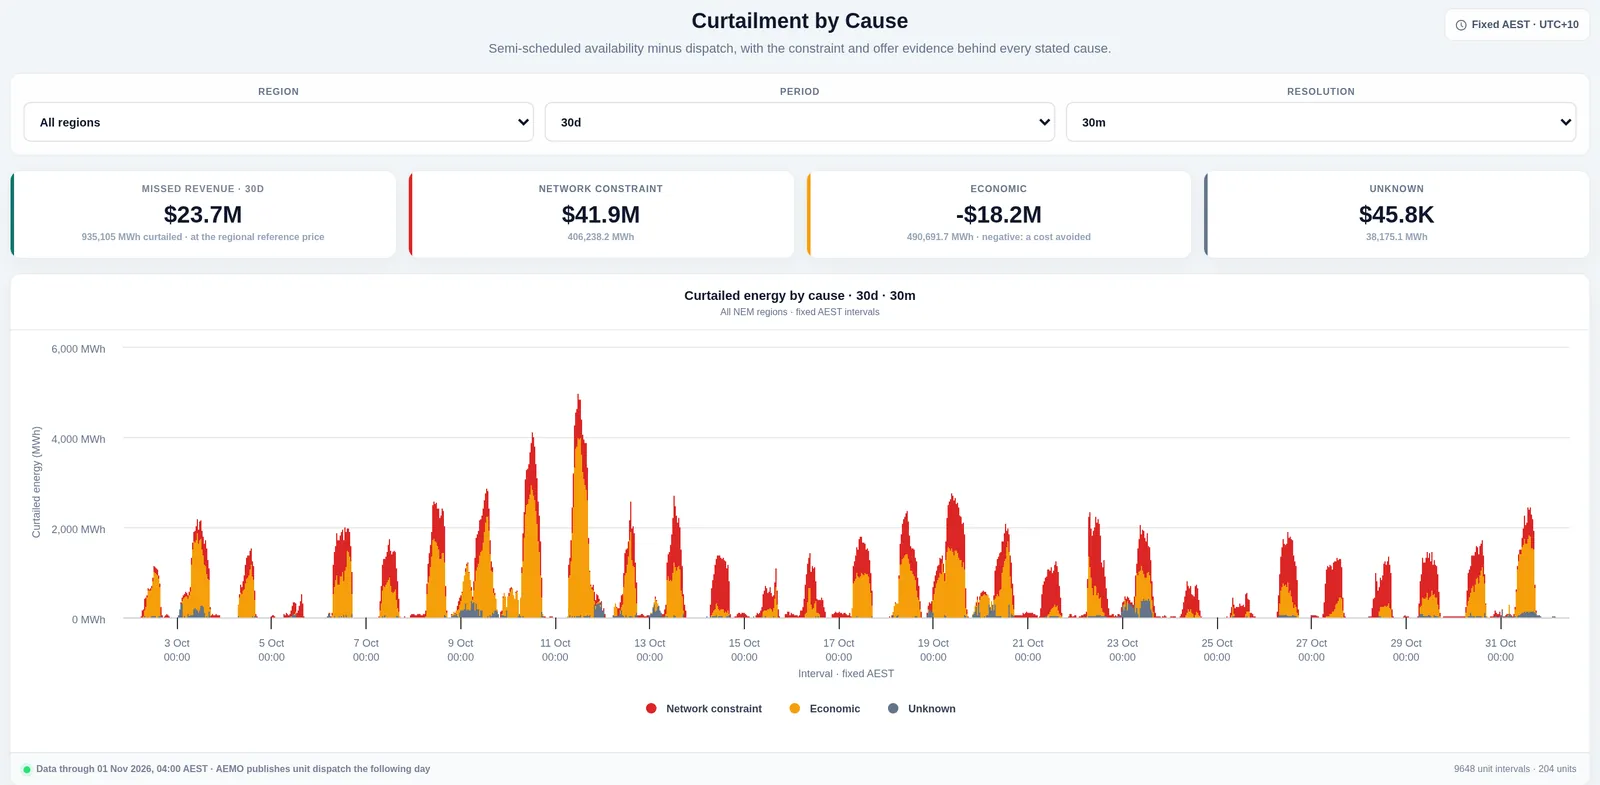
Curtailed semi-scheduled energy split into network constraint, economic and unknown causes, with missed revenue at the regional reference price. Change the region, period and resolution.
Interconnector Predispatch Forecast
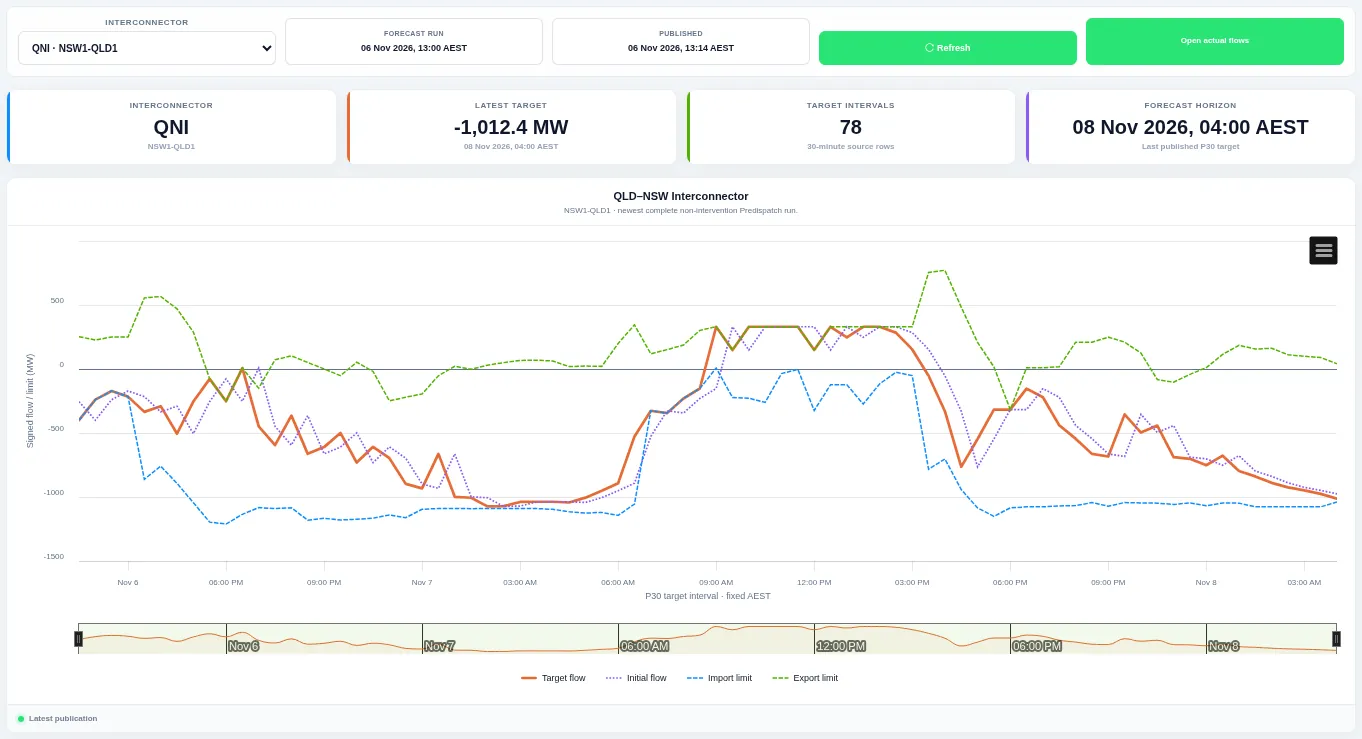
Lines show the forecast flow for the chosen interconnector between its forecast import and export limits. Choose the interconnector at the top.
Short-Term Adequacy
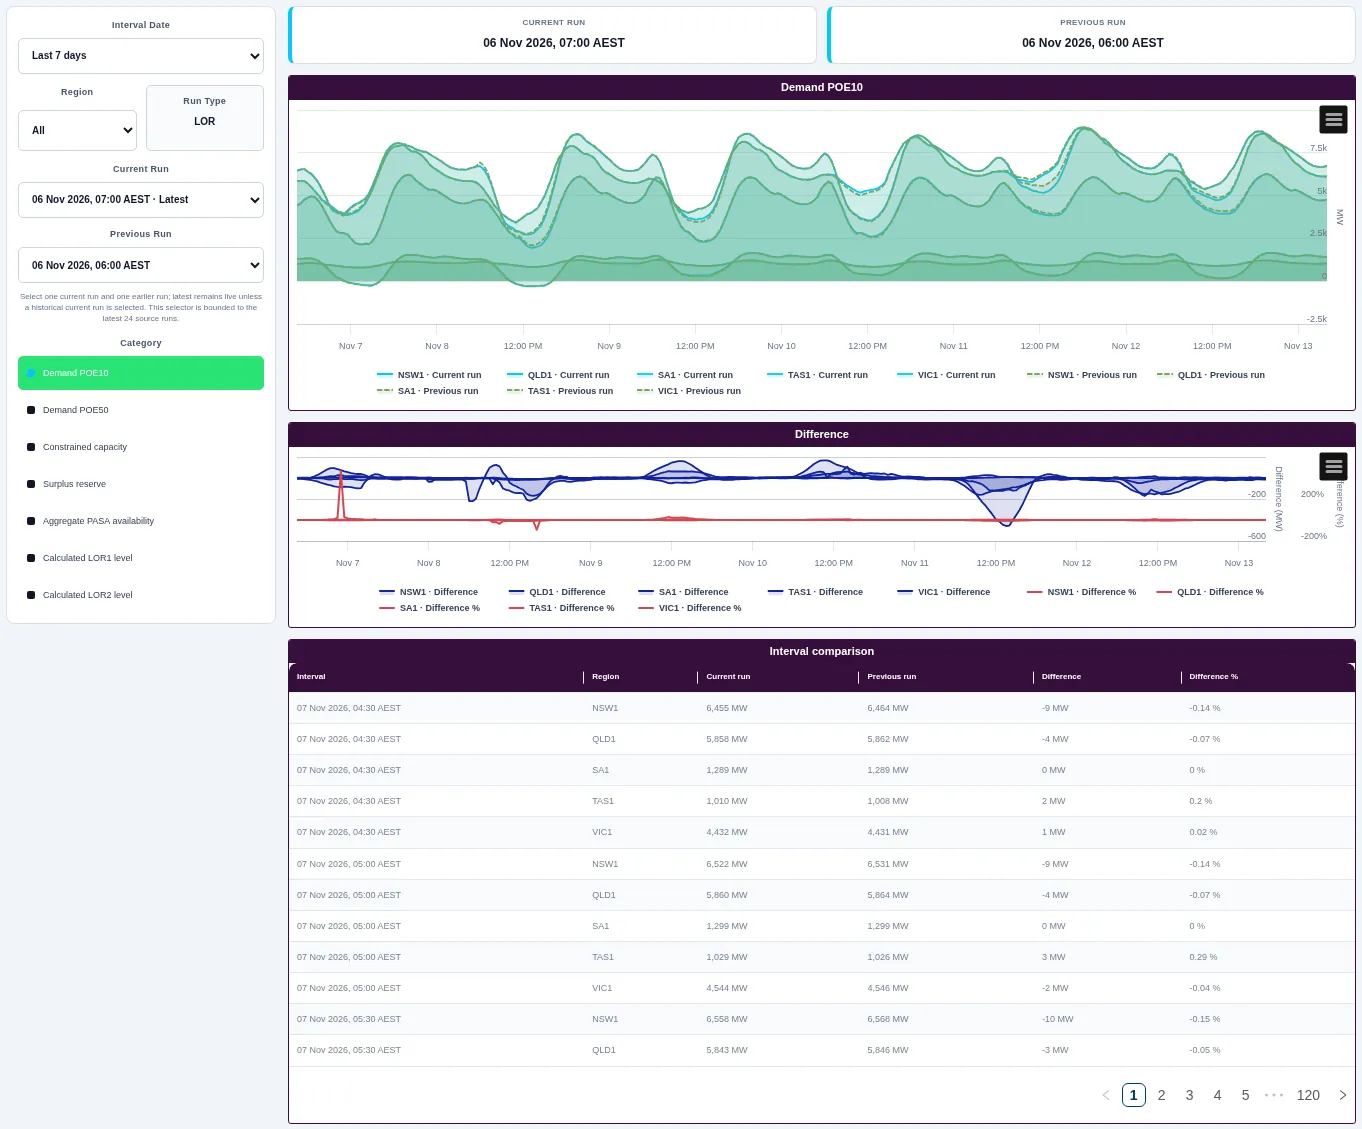
Shaded areas show the short-term supply and demand outlook by region, with a chart of changes from the previous run and a table below. Choose the period, region and runs.
Seven-Day Adequacy Outlook
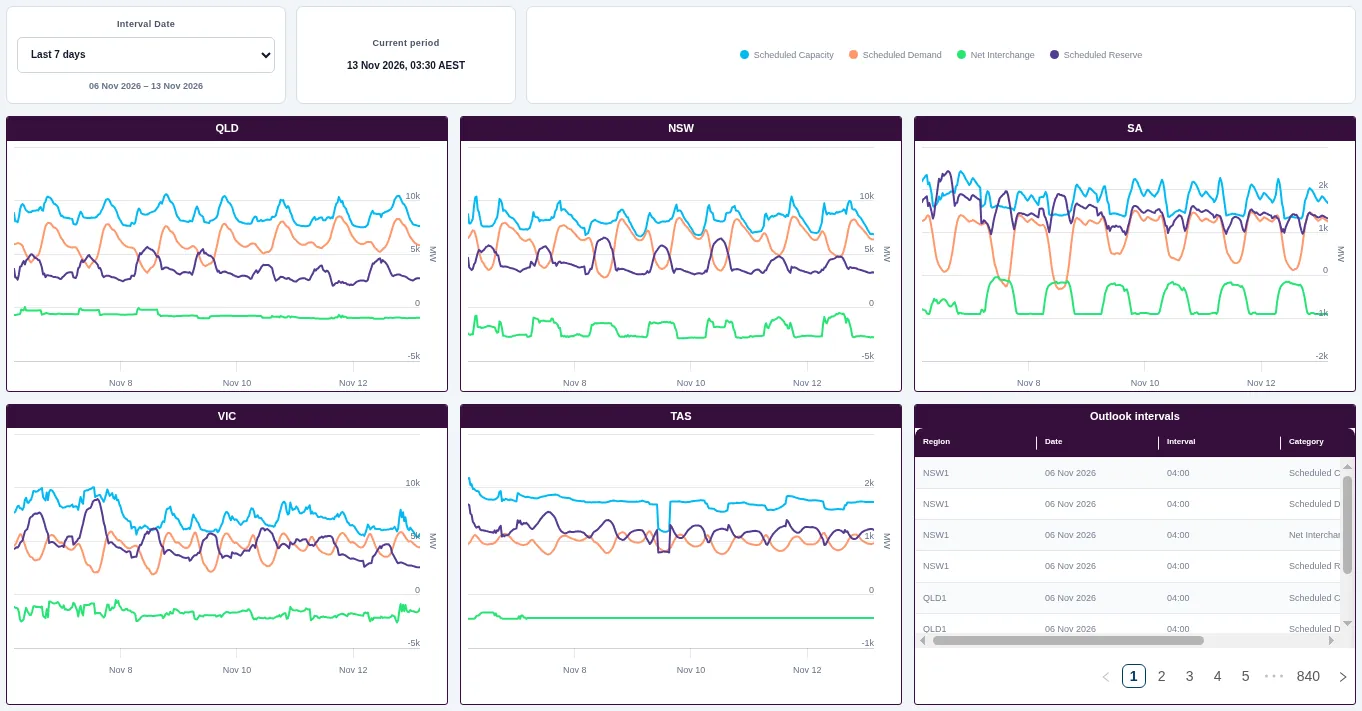
One chart per region shows scheduled capacity, scheduled demand, net interchange and reserve for the next seven days, with an interval table. Change the period and region.
Medium-Term Adequacy
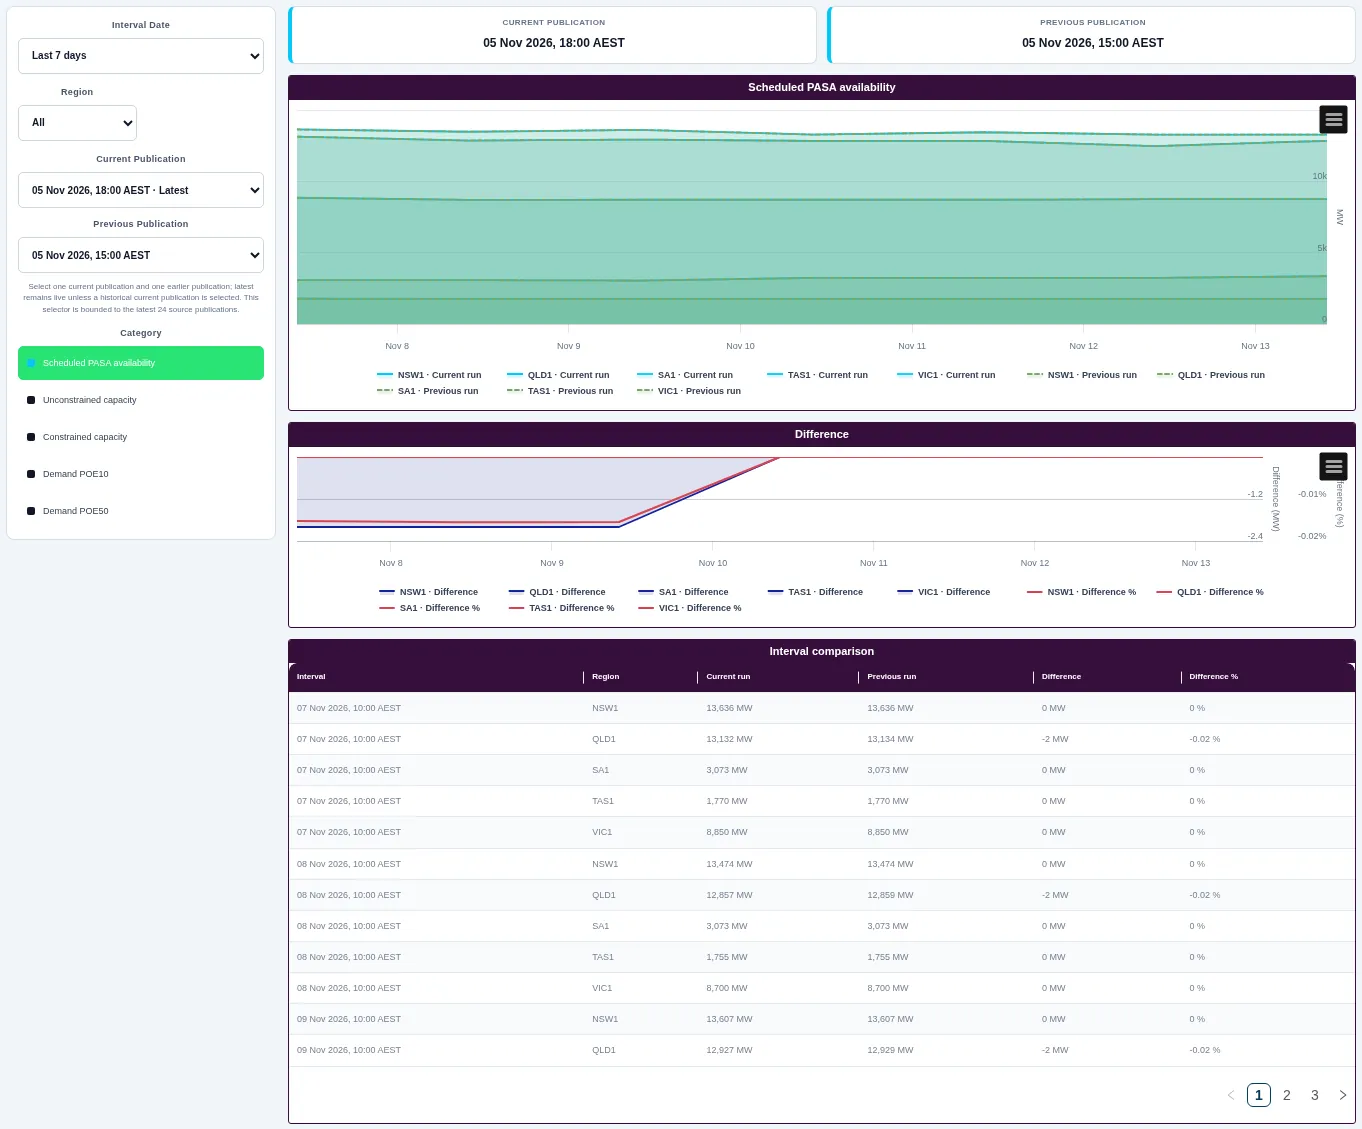
Shaded areas show the medium-term supply and demand outlook by region, with changes from the previous publication and a table below. Choose the period, region and publications.


