

Docs Menu
Engineering Study Results and Statuses
Read study status, calculation methods, summary metrics, tables and map layers before you use an engineering result.
Review a completed study
- Open Study Results after a run, or select a saved run in Study History.
- Check Status, Engine and Solver Method.
- Read the method and screening basis in Summary.
- Review the study-specific metrics and Result Tables.
- Review Result Charts and Result Layers, where available.
- Resolve missing data, warnings and failed cases before you use the result for a decision.
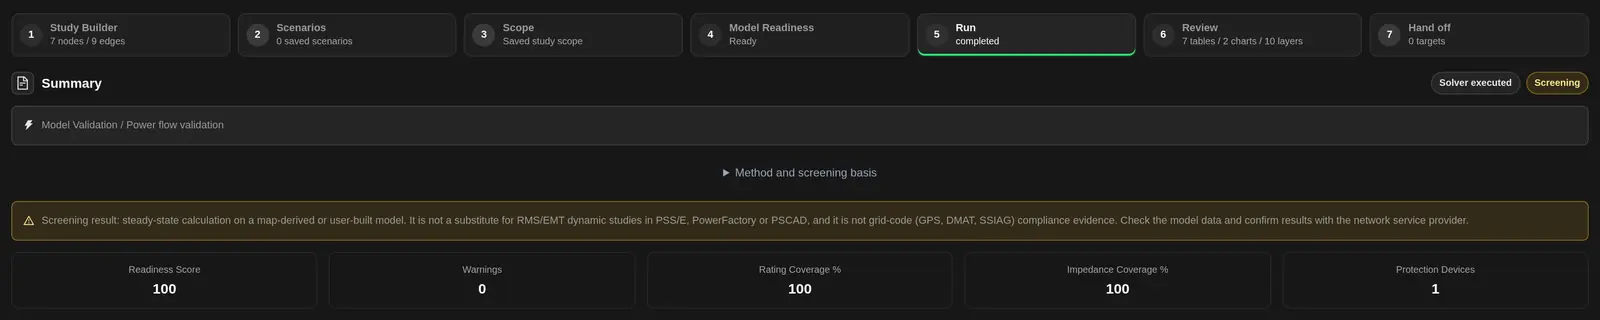
Job, execution and assessment status
Job status describes processing. Execution status describes the calculation. An assessment status applies to a particular check or case. Read them separately.
| Status or value | Meaning | Next action |
|---|---|---|
| queued | The service accepted the study. It is waiting for an execution slot. | Wait and check the queue in Engine Status. |
| running | The study is executing. | Keep the study open, or return through Study History. |
| completed | Processing finished and results can be opened. | Check the method, diagnostics, coverage and assessments. |
| failed | The job did not finish successfully. | Read the returned error. Check the model, engine and inputs before rerunning. |
| Solver executed | The reported method used a solver. | Check convergence and individual limits. |
| Analysis executed | The reported method ran an analysis. It may be a deterministic screen. | Check the method and its assumptions. |
| Solver failed | The solver did not complete the required calculation. | Do not treat missing results as acceptable. Review inputs and solver messages. |
| Scaffold only (no solver) | The output is a structural placeholder, not a solved case. | Use a supported executable method before drawing engineering conclusions. |
| pass, ok or within_limit | The reported check met its stated criterion. | Confirm that the limit and input data are appropriate. |
| review or warning | The result needs engineering review. | Read the reason and check assumptions, coverage and data. |
| constrained, violation or fail | A reported limit or feasibility condition was not met. | Identify the binding condition and change the case or network design before retesting. |
| not assessed | A required value, limit or calculation is absent. | Supply the missing information and run the relevant check. Do not count it as a pass. |
| Unknown, Not available, N/A or n/a | The result does not supply a usable value or sufficient evidence for the field. | Check source data, method support and execution messages. Missing data is not zero. |
| ready | The connection-readiness check found sufficient model information for its screening criteria. | Still review electrical results and warnings. |
| needs_data | The connection-readiness check needs more model information. | Complete the missing fields and rerun readiness. |
| blocked | The readiness check found a blocking issue. | Resolve the reported issue before relying on downstream results. |
| Converged | The relevant numerical solution converged. | Review voltage, loading and all other assessed limits. |
| Unavailable or non-converged | No usable solved state is available for that result or diagram. | Review the method and failure messages. Do not infer a safe operating state. |
General result metrics
| Metric | Meaning |
|---|---|
| Status | Processing status of the active study. |
| Engine | Engine recorded for the run. |
| Solver Method | Reported calculation method. The engine name alone does not identify whether this run used a solver or a screening calculation. |
| Study | Study family represented by the active summary. |
| Buses / Branches / Protective Devices | Counts in the converted study model. Counts do not establish connectivity or data quality. |
| Model QA | The model-validation readiness score. This is a data-quality indicator, not an electrical pass score. |
| Connection | Connection-readiness status. |
| Readiness Score in the top result row | The connection-readiness score. It is separate from Model QA. |
| Basis / Method / Standard / Execution | Calculation basis, method, standard where supplied, and execution classification. |
| Voltage factor c / Fault cases | Short-circuit voltage factor and reported maximum/minimum fault cases, where supplied. |
Study summary metrics
The summary depends on the study and returned result. A metric that the method did not calculate is not available. A missing violation count does not prove zero violations. A missing coverage statement does not prove full coverage.
| Study | Metric | Meaning |
|---|---|---|
| All method-based summaries | Method | Calculation method used for this result. |
| Hosting sweep | Hosting MW | Reported additional generation capacity accepted by the screening sweep, in MW. Review the tested steps and all required checks. |
| Hosting sweep | Binding | Condition that limited the sweep. No reported binding condition is not evidence that all network constraints were assessed. |
| Hosting sweep | Pass Steps | Number of tested sweep steps reported as passing. |
| Contingency | Cases | Number of evaluated outage cases. |
| Contingency | Coverage | The summary's coverage label. Verify it against the evaluated and eligible case counts. A truncated run covers only the evaluated subset. |
| Contingency | Islanding | Cases reported to disconnect part of the network. |
| Contingency | Overloads | Cases reported with branch loading violations, not a count of all overloaded branches. |
| Contingency | Voltage | Cases reported with voltage violations. |
| Contingency | Non-converged | Cases for which the required solution did not converge. |
| Short circuit | Max Fault kA | Maximum reported fault current in kA. |
| Short circuit | LG Fault kA | Maximum reported line-to-ground fault current in kA, if calculated. |
| Short circuit | Fault Type | Fault type used for the primary summary. |
| Short circuit | Source MVA | Source fault-level assumption in MVA. This is not the calculated fault level at every bus. |
| Short circuit | Duty Violations | Reported breaker interrupting-duty violations. A device without a known applicable rating is not assessed. |
| Protection coordination | Devices | Number of protective devices in the result. |
| Protection coordination | Coverage % | Reported percentage of branches with protection coverage. |
| Protection coordination | Missing | Reported branches or checks lacking required protection coverage. |
| Protection coordination | Margin Violations | Reported grading-margin violations. |
| Protection coordination | Duty Violations | Reported interrupting-duty violations. Check actual device ratings. |
| Time series | Peak Hour | Hour index for the reported peak case. |
| Time series | Peak Loading % | Highest reported branch loading across the analysed hours. |
| Time series | Solved Hours | Hours reported as solved or analysed by the method. Check the method before interpreting this as solver convergence. |
| Time series | Failed Hours | Hours with reported calculation failures. |
| PV curve | Load | Load varied for the active-power sweep. |
| PV curve | Cases / Converged | Tested sweep cases and cases that converged. A finite sweep does not locate every possible voltage-stability limit. |
| QV curve | Bus | Bus used for the reactive-power sweep. |
| QV curve | Cases / Converged | Tested reactive-power cases and cases that converged. |
| Transfer limit | Feasible Transfer MW | Reported feasible transfer within the tested sweep and model constraints. |
| Transfer limit | Source Bus / Sink Bus | Endpoints used for the transfer sweep. |
| Transfer limit | Cases | Number of tested transfer cases. |
| Model validation | Readiness Score | Model-validation score based on the returned findings. This is not the top-row connection score. |
| Model validation | Warnings | Number of warning findings. |
| Model validation | Rating Coverage % | Coverage of required branch ratings in the model-validation check. |
| Model validation | Impedance Coverage % | Coverage of branch impedance data in the model-validation check. |
| Model validation | Protection Devices | Number of recorded protective devices. |
Other study families can show model-validation metrics alongside their own tables and charts. See the study types reference for calculation methods, inputs and output tables.
System strength at the connection point
- Open a short-circuit result.
- Select the Short-Circuit Screening table to load its bus rows if requested.
- Choose Connection Bus.
- Enter a positive plant rating in Rated MW (P_rated). If left blank, the study's requested MW is used when available.
- Review the maximum and minimum cases separately.
| Metric | Meaning |
|---|---|
| Max Fault Level MVA | Reported maximum fault level at the selected bus. Check the computed fault types and source table. |
| Min Fault Level MVA | Minimum-case three-phase fault level. It is not available when the run has no minimum case; the maximum must not be substituted. |
| X/R | Reactance-to-resistance ratio from the maximum case. |
| SCR (S_sc,min / P_rated) | Minimum fault level in MVA divided by positive rated MW. Both values are required. |
| X/R (min case) | Minimum-case ratio, when explicitly supplied. |
| Min Fault Level MVA (plant excluded) / SCR (plant excluded) | Shown only when the result explicitly reports that plant exclusion was applied. |
Fault levels include the in-service sources in the study model unless the result explicitly identifies a plant-excluded calculation. Weighted SCR is not calculated. The Screening, not SSIAG label refers to Australia's AEMO system-strength assessment framework. This card is not an SSIAG assessment and does not replace its required methods or electromagnetic transient studies.
Read result tables and charts
- Use the selector in Result Tables to choose a table. The option includes its reported row count.
- Read column headings and units for the selected method.
- Use Previous page and Next page for paged results. Each page displays up to 100 rows.
- Check Loading… and any returned error before treating the visible page as complete.
- Use Plot Studio for chart controls, reference bands and plotted-data downloads.
Use Exports & Handoffs for result packages. Available table columns and charts vary by study and engine.
Solved Network Diagram uses the circuit revision referenced by the study, not an edited current draft. Its Converged or Unavailable badge describes the returned solved state. See the single-line diagram guide for diagram controls.
Show results on the map
- Open Result Layers.
- Check each layer's feature count, geometry type and method.
- Use Hide layer or Show layer to choose visible layers.
- Adjust each opacity slider. The range is 8% to 100%; the initial value is 100%.
- Use Auto-fit to allow the view to fit an updated overlay. It is initially selected.
- Choose Add to Map or Update Map. An explicit add or update fits the map to the result.
- Review the Added to Map state and the active feature/layer count.
- Use Remove from Map to remove the active study overlay. This does not delete the study.
You can also manage loaded layers under Engineering Studies in the map sidebar. The result view previews up to four layer summaries, including reported warning and violation counts. Use Result Layers for the complete layer list.
Map features can show loading, voltage, fault currents, breaker ratings, duty, hosting capacity, binding constraints, protection coverage, coordination margins or disconnected MW. Pop-ups include available method, severity and source information. A field appears only when the result supplies it. Read the values and limits; color alone is not an assessment.
Large result layers are loaded in pages for the current map extent. A loading error or size-limit message means the overlay is incomplete. Do not interpret absent features as passed checks. Input snapshot overlays are separate from result layers and do not contain new solver results.
Open, rerun or delete a saved study
- Open Study History.
- Filter by Status, Study or Engine.
- Choose Refresh to reload recent runs for the scope.
- Select a study to open Study Results.
- In Study Results, choose Rerun to create another run from the saved request. To use changed setup inputs, start a new run with Run Study instead.
- Choose Delete only when you no longer need that saved study. It deletes the saved study and clears its active results and map overlay.

History shows up to 50 recently returned studies for the network scope. It is not a complete archive. Rerun and delete are unavailable while the panel is monitoring a running study. Opening a queued or running study resumes status monitoring. A browser polling timeout does not establish that the server job failed; reopen the run to check its status.
Presentation and Exports & Handoffs use eligible completed results. See exports and handoffs for report and download controls.
Check service availability and quota
Open Engine Status if a study cannot start or remains queued.
| Field or section | Meaning |
|---|---|
| API / Endpoint | Service health state and the configured service address. |
| Auth | Whether the service reports authentication as Required or Open. Product plan access still applies. |
| Queued/user / Running/user | Configured per-user queue and concurrent execution limits. |
| Your Queued / Your Running | Your currently queued and running jobs. |
| Global Queued / Global Limit | Service-wide queued jobs and queue capacity. |
| Daily Quotas | Usage, limit and remaining allowance by study type. Choose Refresh to update it. |
| Engines | Reported engine availability. offline means that engine is not available for execution. |
| Study Types | The service catalogue and the reported default engine for each type. |
In Setup & Run, Current Scope also shows queue, running, remaining daily allowance and timeout information when supplied. Limits come from the service and can vary. If the user queue is full, wait for an existing job to leave the queue before submitting another. If quota is exhausted, check the allowance before retrying.

Review Engineering Checks
A workflow waiting for external input has not completed that external simulation. A rejected result upload needs review; it must not be treated as a successful calculation.
Check convergence, initialization, units, source data and warnings. Review each channel comparison against its applicable acceptance limits; a missing limit leaves the check unassessed.
Related Guides
- Running Engineering Studies
- Engineering Study Types Reference
- Engineering Plot Studio
- Network Model Import and Validation
- Engineering Exports and Handoffs


