

Docs Menu
East Coast Asset Economics
Compare battery benchmarks, solar and wind performance, and unit revenue in the NEM. Then check derived curtailment and locate the same asset on the map. Use the market-data estimates to compare assets on a consistent basis.
In the app, the Asset economics group also lists Commissioning Hold Points and Constraint Trend. They are described on East Coast Supply and Demand and East Coast Constraints.
Open any view from Markets in the product switcher, then pick the market and the view from the left-hand menu. See the Network Map Markets Guide for the common controls and plan access.
Market Intelligence Walkthrough
Open Markets → NEM. The battery, ranking and revenue views are in Asset Economics; Curtailment by Cause is in Adequacy. Explore examples from November 2026, then compare your selected dates and coverage.
- Compare batteries. Open Battery Benchmarks. Choose the region and duration band. Use Metric for the peer and selected-battery comparison; the monthly index stays on annualised energy-plus-FCAS revenue per registered MW-year. Enter the Battery DUID and press Enter or leave the field. Annualised revenue is not cash earned over a full year. Check the cohort version, contributors and covered intervals. The selected battery uses its own cohort, which may differ from the region and duration filters; confirm they match before a like-for-like comparison. See Battery Benchmarks and Index.
- Read the battery revenue streams. Open Battery Analytics, enter the battery DUID and press Enter or leave the field. Choose Last 7d or Last 30d (complete days). Compare energy discharge, charging cost and the priced FCAS streams. Check coverage before reading the net total; an unpriced stream is not zero.
- Compare solar and wind. Open Unit Ranking, select the fuel, region, period and metric, and read the valuation setting. The recorded rankings use SCADA output. Loss-factor adjustment changes value, not the unit's physical output or capacity factor.
- Inspect the same unit's loss-factor effect. Enter its dispatchable unit identifier (DUID) in Unit Revenue (MLF), then press Enter or leave the field. Choose Last 7d or Last 30d (complete days) and read the with-MLF and without-MLF figures side by side. Renewable revenue uses dispatch targets, unlike the SCADA-based ranking example, so the two views need not reconcile exactly. See Unit Revenue with Loss Factors.
- Check curtailment evidence. Open Adequacy → Curtailment by Cause and choose the region and period. Read the cause breakdown, unit rows, confidence and unknown coverage together. Curtailment is derived from availability minus dispatch target. See Curtailment and Missed Revenue.
- Find the asset on the map. Keep its name and DUID, return to the map and use Spatial Search. Select the matching result and confirm its identifier before reading nearby network features. Search is a separate step; a ranking row does not open the map.
Keep the Asset and the Dates in Context
The example uses an exact DUID match. Its inventory snapshot is dated 8 May 2026, while the market example and map overlay use later November dates. Compare the inventory and overlay timestamps separately. Only located units can appear on a map overlay; absence from the map does not mean no activity. Use nearby lines for geographic context and the dashboard’s constraint and offer evidence to investigate curtailment causes.
Read before comparing: align the unit, period, time zone, coverage and measurement basis. Missing capacity, loss factors, prices or evidence must remain Unknown or unavailable. Derived revenue is not profit, contracted revenue or a settlement payment.
Views
Unit Revenue (MLF)
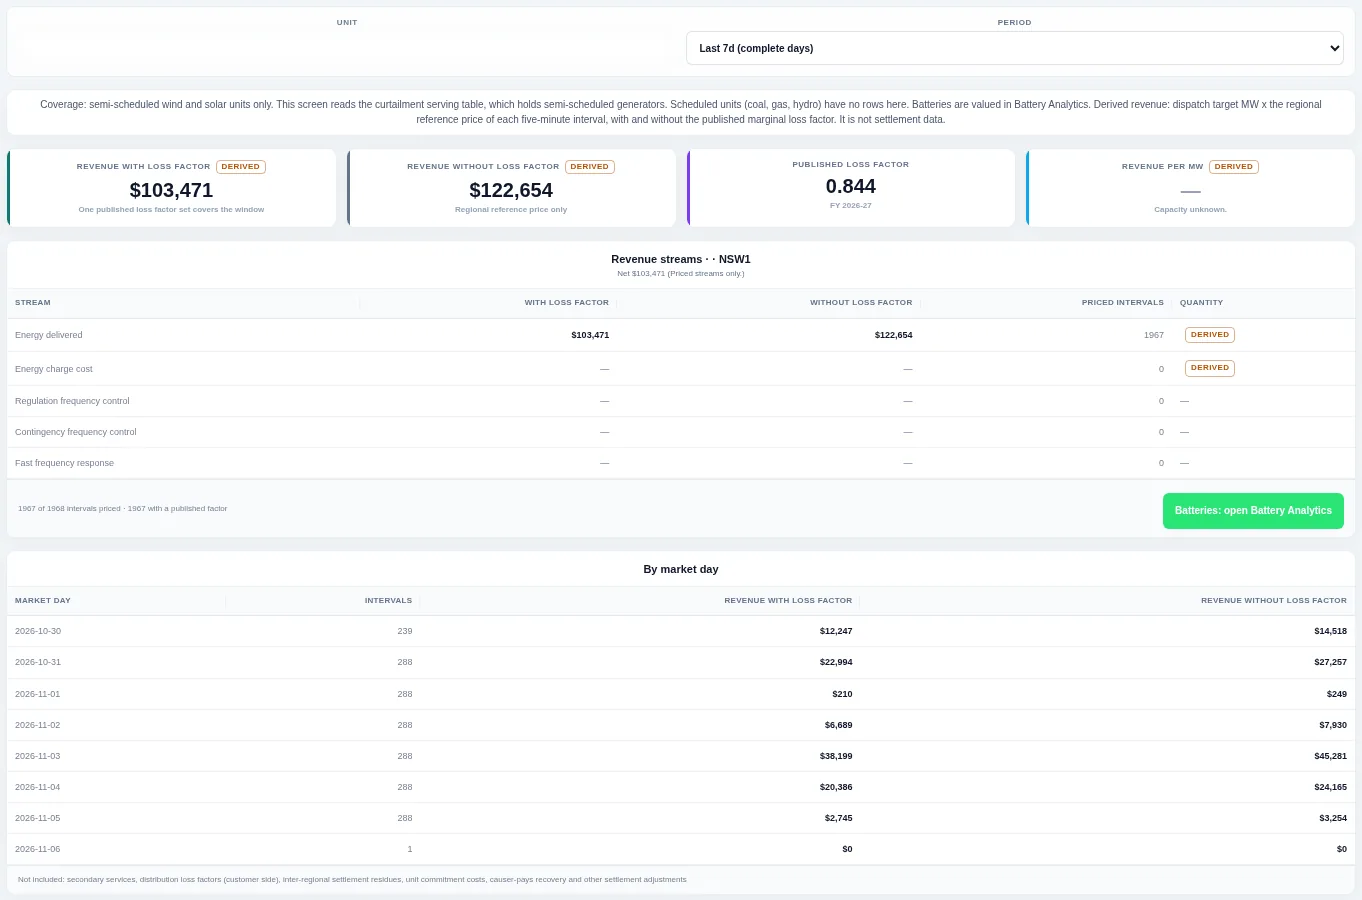
Cards and tables show a unit's derived revenue for each stream and each market day, valued with and without its published loss factor. Enter a unit and choose a period; values are estimates and are not settlement data.
Battery Analytics
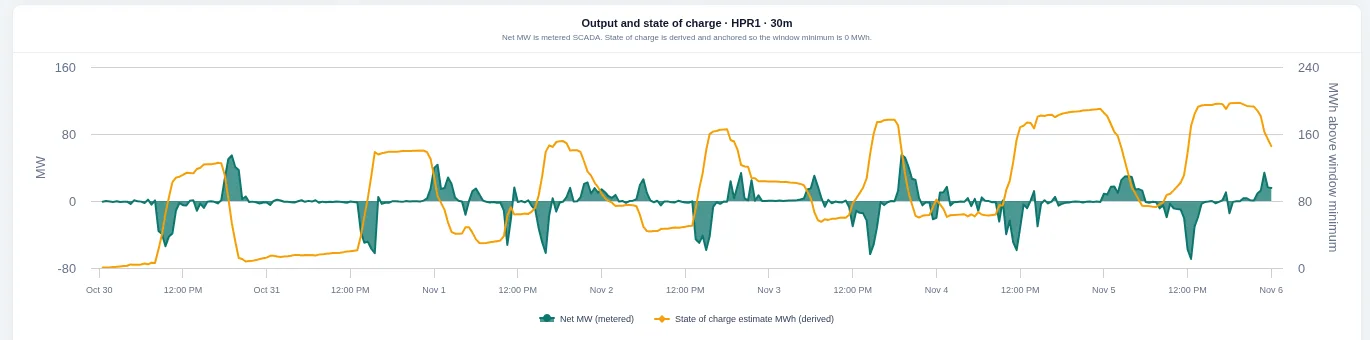
Enter the battery DUID and choose Last 7d or Last 30d (complete days). The view includes metered SCADA output, derived operating metrics and energy and FCAS revenue. State of charge is a relative estimate in MWh above the window minimum, not measured absolute charge. Equivalent full cycles need storage MWh and can remain Unknown.
Battery Benchmarks
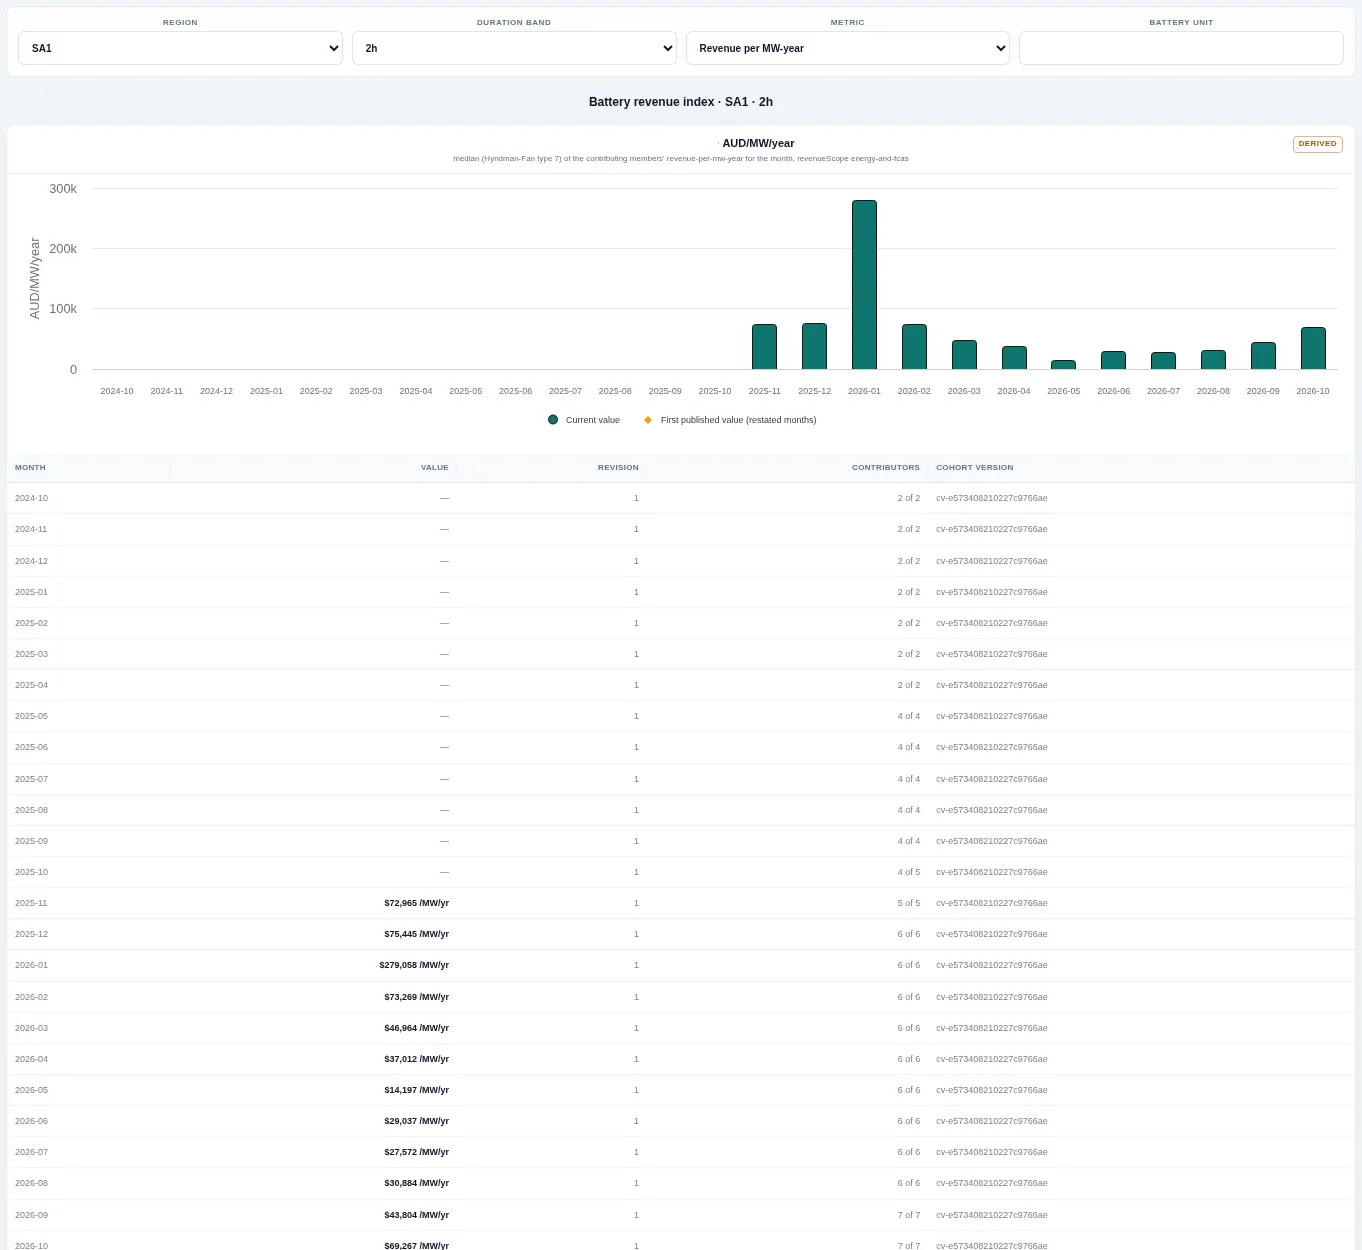
The monthly index is the cohort median of annualised energy-plus-FCAS revenue per registered MW-year, with each month's revision and contributor count. It is not the money earned in that month. The Metric selector changes the peer and selected-battery comparison, not this fixed index. Check cohort versions and coverage before comparing them.
Unit Ranking
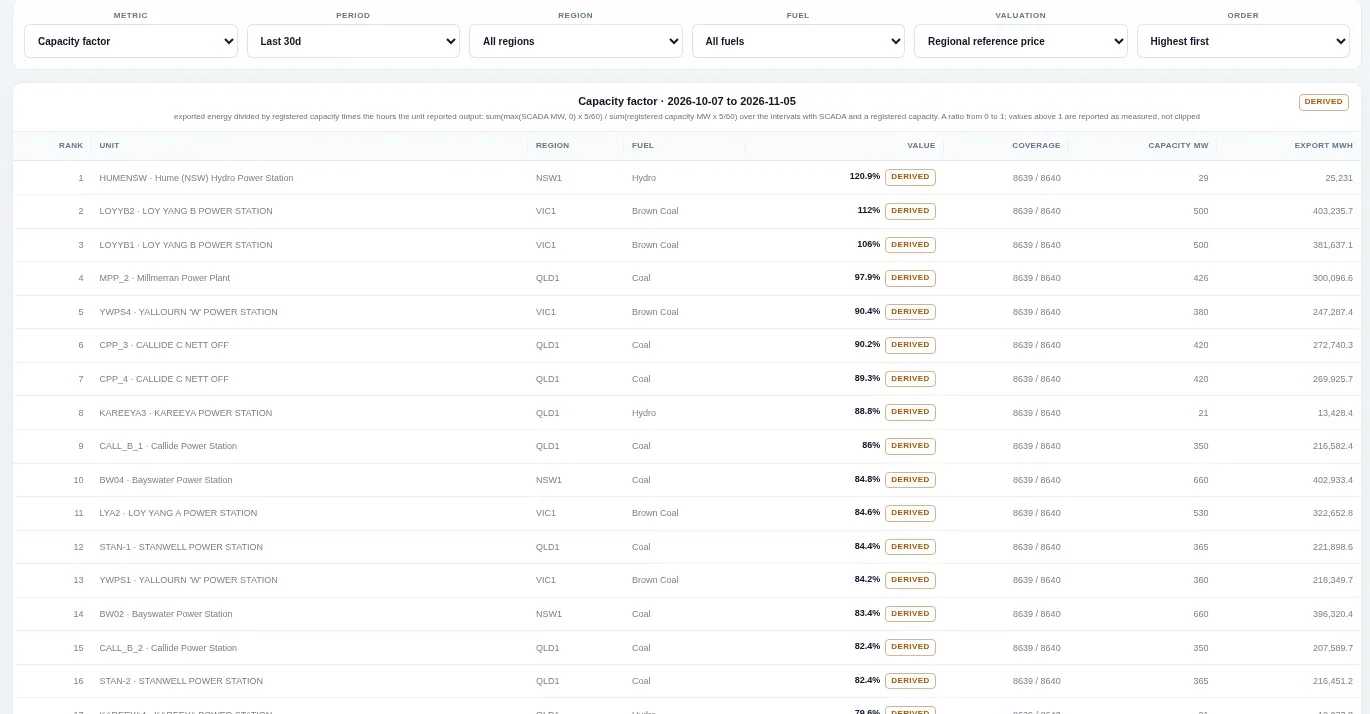
Available generating units ranked by a selected metric such as capacity factor, energy or revenue. Change the metric, period, region, fuel, valuation and sort order. Check the output basis and coverage alongside each rank.
Constraint Links
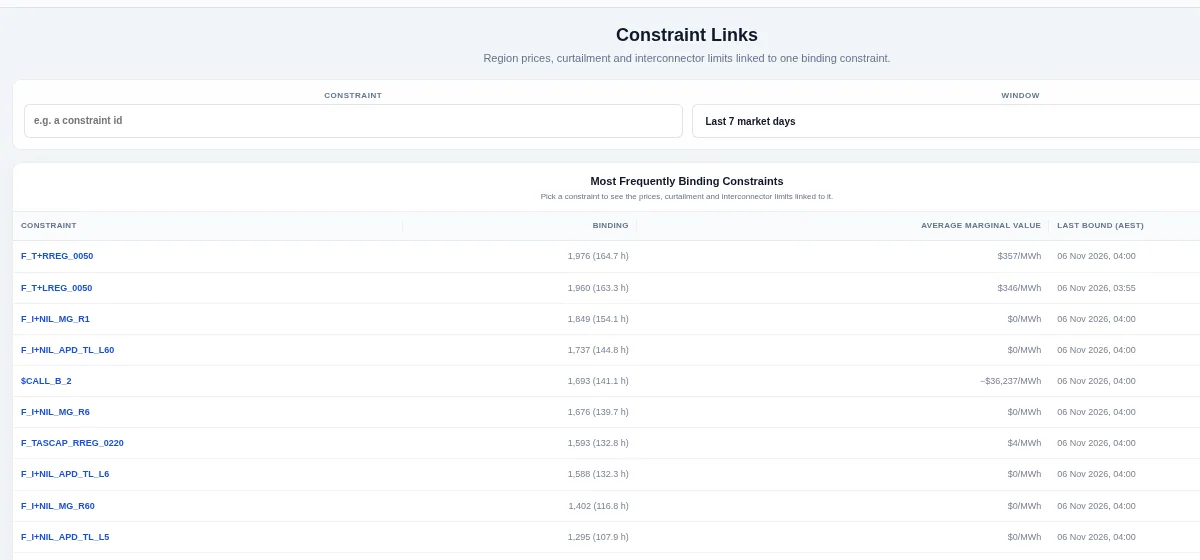
The most frequently binding constraints, and for one constraint the region prices, curtailment and interconnector limits linked to it. Choose a constraint and the number of days.
Bid to Dispatch
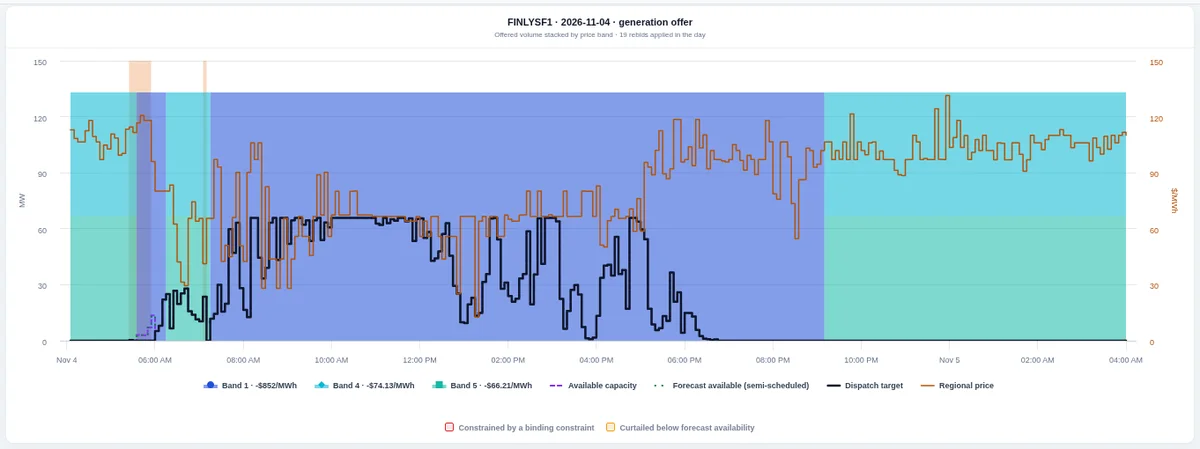
For one unit and day, offered price bands are drawn against the dispatch target and available capacity at five-minute resolution, with the regional price and every constrained interval marked. Choose the unit, date and direction.
Related Guides
- Market Intelligence: overview and focused clips
- Battery Benchmarks and Index
- Unit Revenue with Loss Factors
- Curtailment and Missed Revenue
- Network Map Markets Guide
- Grid Constraint Methodology
- AI Assistants (MCP)


