

Battery Revenue, Stream by Stream, Against Its Peers
What a grid-scale battery earned from energy and each of the eight frequency control ancillary services, the price spreads it had to work with, and where its cohort sits on a published monthly index with a public methodology.
Operator data, never estimated • ISO/IEC 27001 certified • Cancel anytime
Built from Published Market Data Only
Metered output, five-minute prices, ancillary service enablement and volume-weighted ancillary service prices, valued interval by interval. Charging is a signed stream, so a battery that charges at negative prices shows the credit, not a hidden cost.
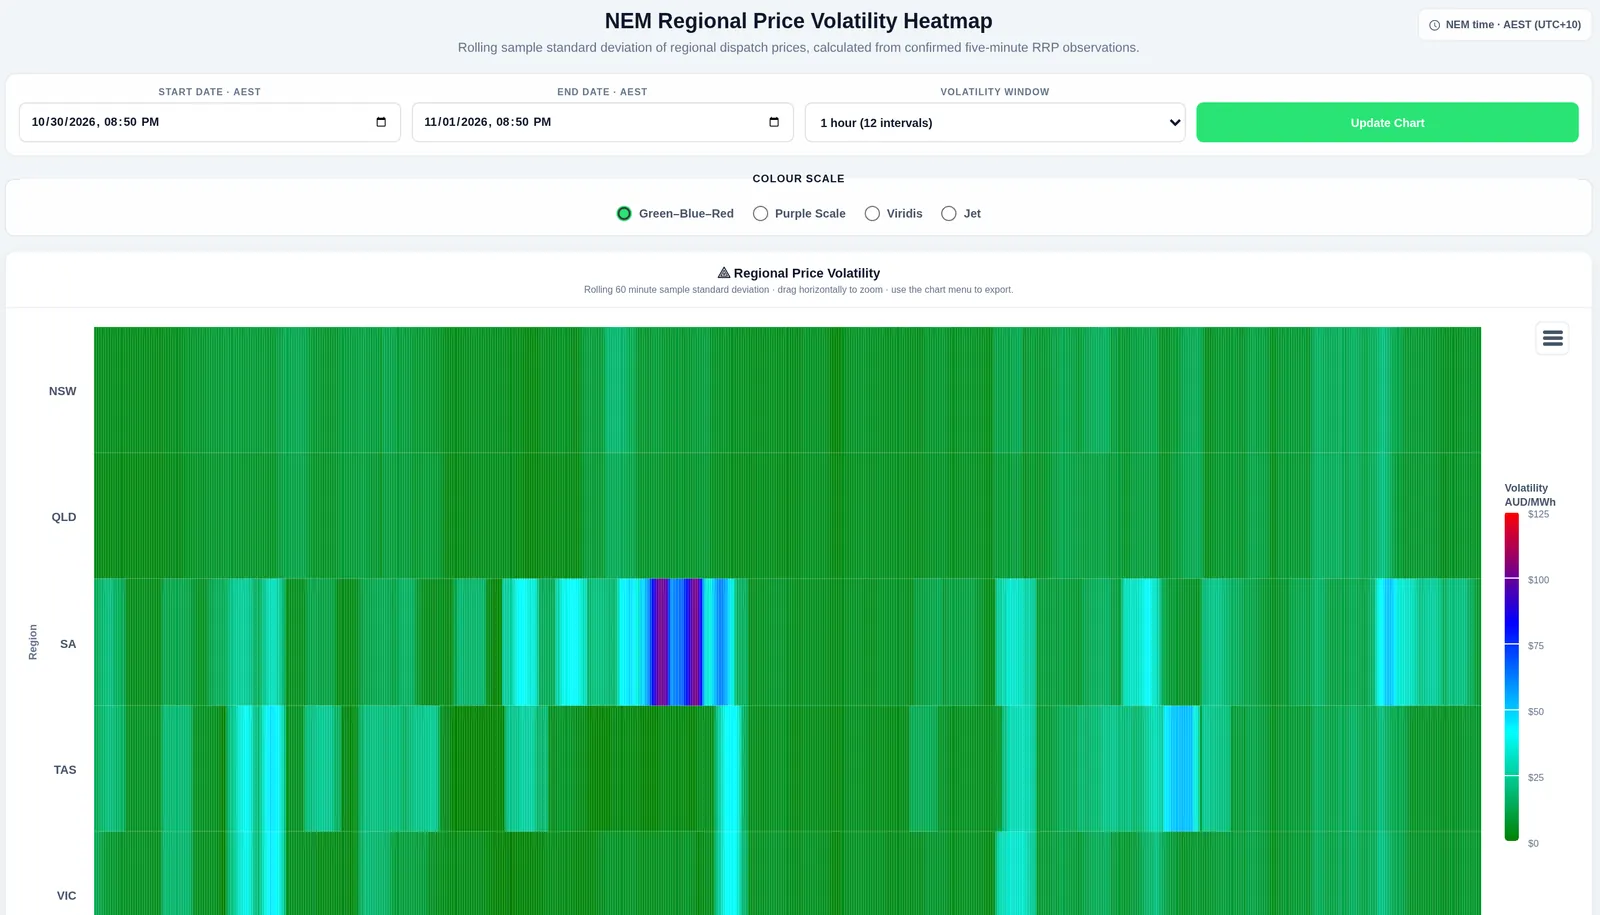
Battery revenue, peer cohorts and the index are delivered through the Network Map platform API. The tables and chart on this page are rendered from live API responses read on 1 Nov 2026. Access is through the Network Map platform API for Pro and Enterprise accounts; contact us to set it up. The price and ancillary service views shown below are in the Pro app.
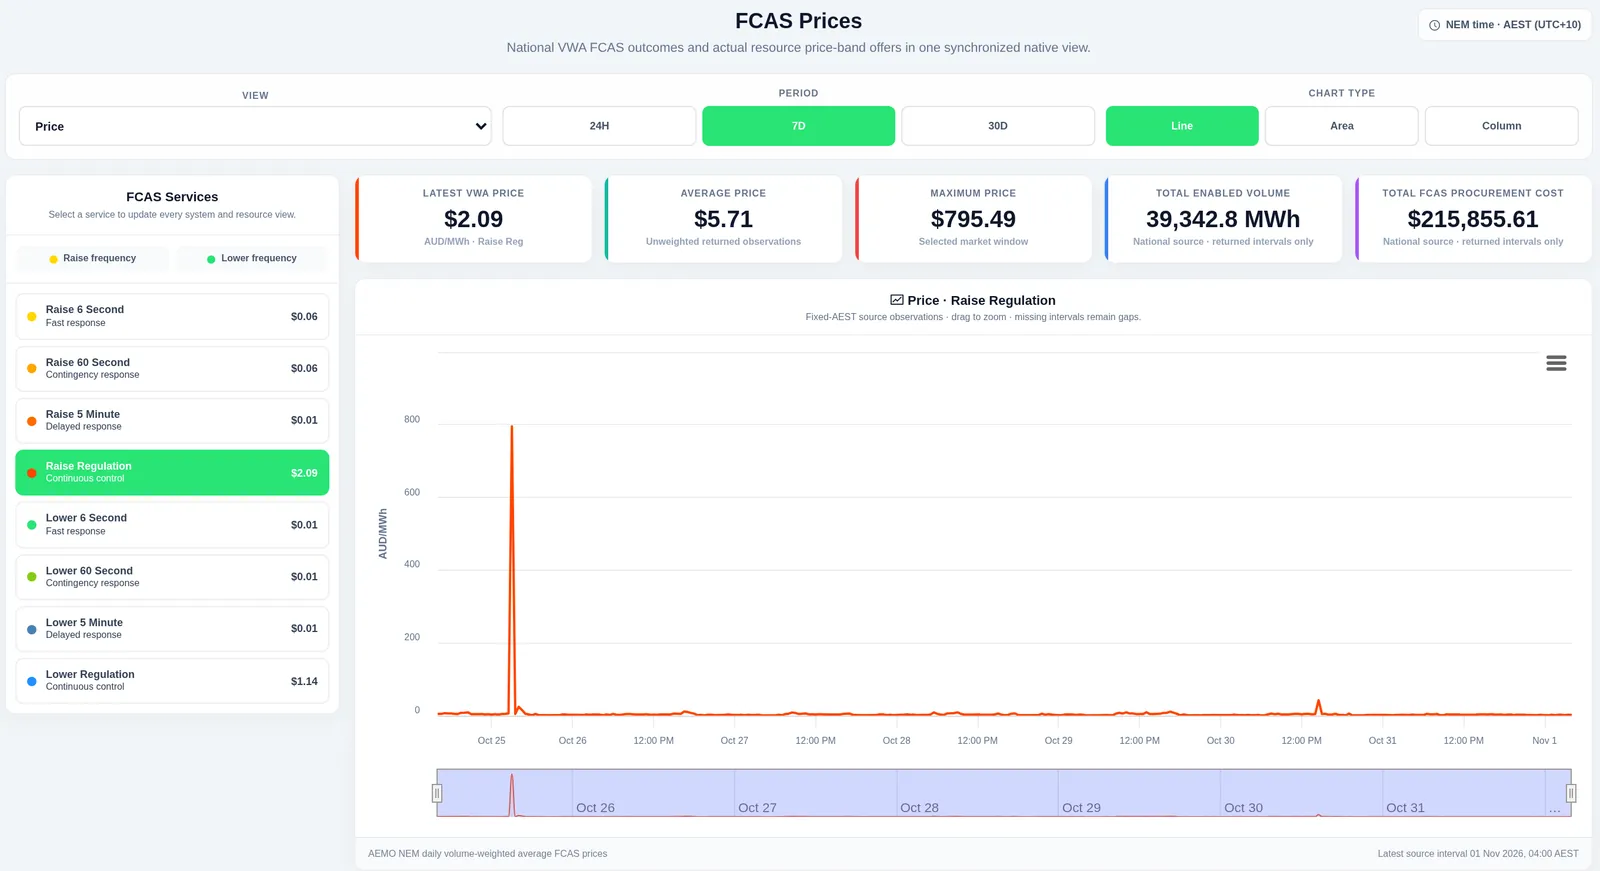
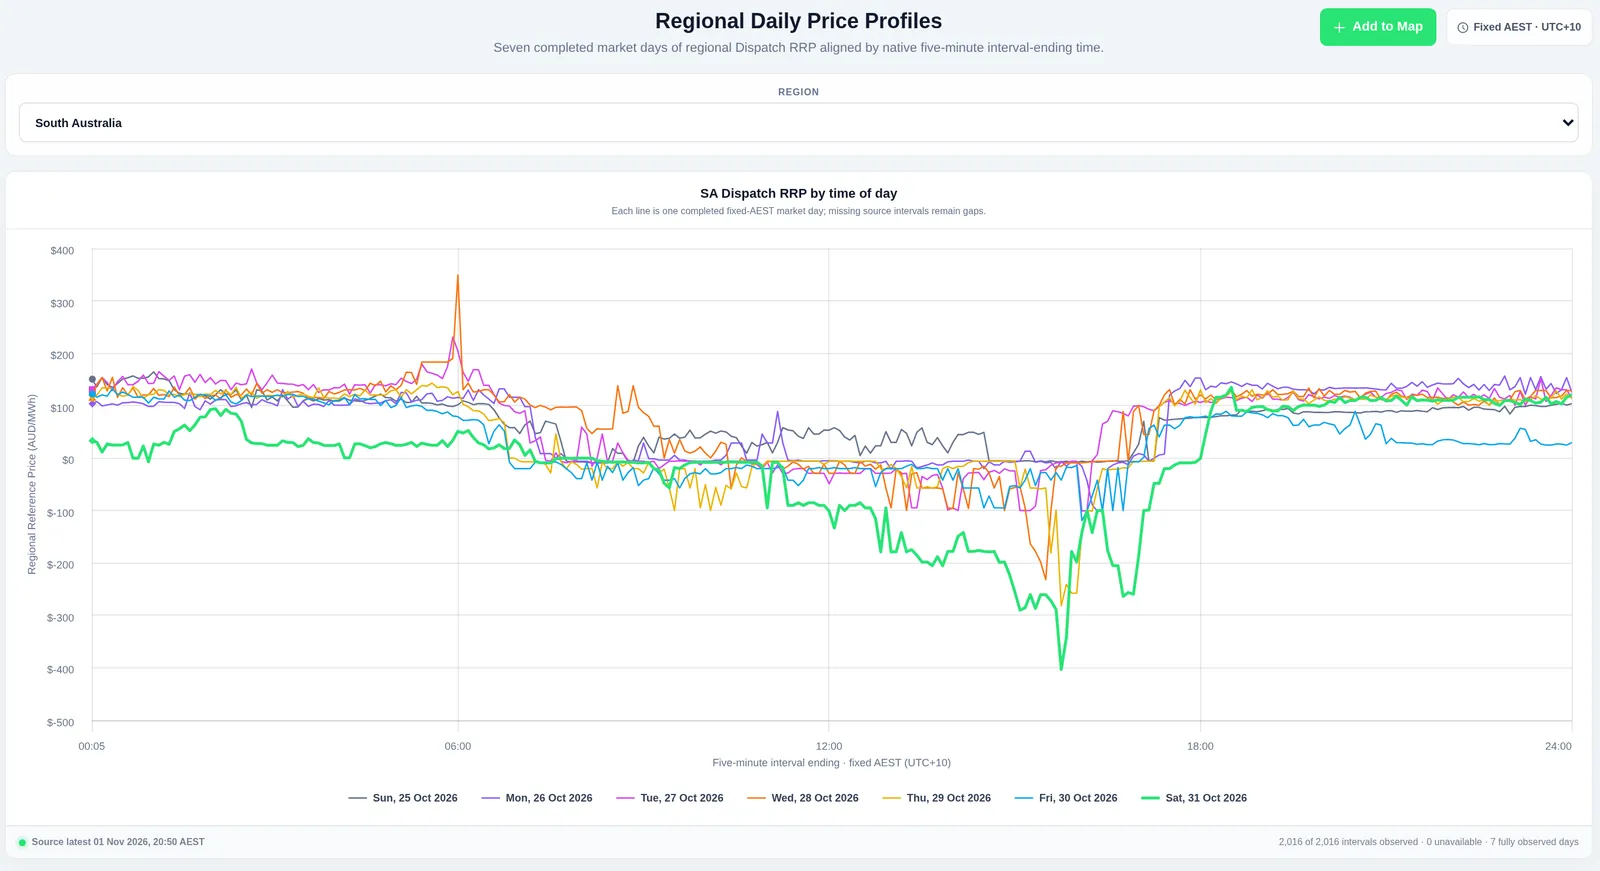
Worked Example: Hornsdale Power Reserve (HPR1), SA1 region
Revenue from metered output at five-minute prices, published loss factor 0.975 applied to energy. Ancillary service amounts are enablement MW × the volume-weighted price of the trading interval; no loss factor applies to ancillary services.
| Stream | With loss factor | Without loss factor |
|---|---|---|
| Energy discharged | A$397,031.98 | A$407,212.29 |
| Energy charging (signed) | A$39,376.80 | A$40,386.46 |
| Regulation (frequency control) | A$721.20 | A$721.20 |
| Contingency (frequency control) | A$3,783.46 | A$3,783.46 |
| Ancillary service | Amount | Enabled MWh | Enabled intervals |
|---|---|---|---|
| Raise 6 second | A$0.05 | 0.6 | 1 |
| Raise 60 second | A$0.03 | 0.4 | 1 |
| Raise 5 minute | A$0.00 | 0.0 | 0 |
| Lower 6 second | A$1,493.66 | 856.7 | 195 |
| Lower 60 second | A$1,871.11 | 812.2 | 211 |
| Lower 5 minute | A$418.61 | 379.0 | 116 |
| Raise regulation | A$645.28 | 51.1 | 20 |
| Lower regulation | A$75.92 | 76.3 | 33 |
Energy charging is positive here: over the month the battery was paid more for charging at negative prices than it paid at positive ones. Source: the market operator's SCADA, dispatch prices, next-day unit solution and volume-weighted ancillary service prices; GET /v1/markets/nem/units/revenue-detail?duid=HPR1 and /units/operations, read 1 Nov 2026 10:38 UTC.
Peer Cohorts and the Monthly Index
Batteries are grouped by region and duration band from their market registration. The index is the monthly median of the cohort's net revenue per MW per year. Cohort statistics are published once five or more batteries contribute, so individual batteries' results stay private.
| Cohort (Sep 2026) | Batteries | 25th percentile | Median | 75th percentile |
|---|---|---|---|---|
| NSW1, 2h | 13 | A$14,012 | A$19,891 | A$24,994 |
| QLD1, 2h | 13 | A$30,385 | A$38,813 | A$42,246 |
| SA1, 1h | 7 | A$11,585 | A$23,046 | A$33,003 |
| SA1, 2h | 7 | A$28,085 | A$43,804 | A$46,134 |
| VIC1, 2h | 13 | A$17,675 | A$36,703 | A$46,302 |
Battery revenue index, monthly median, A$ per MW per year
Energy plus ancillary services, October 2024 to September 2026. A line starts only once its cohort had at least five contributing batteries.
SA 1 hour index for September 2026: A$23,046.25 per MW per year, 7 contributors, revision 1, published 31 Oct 2026; QLD 2 hour: A$38,813.07, 13 contributors. Source: GET /v1/markets/nem/benchmarks/distribution and /benchmarks/index, cohort version cv-e573408210227c9766ae.
Daily Price Spreads by Region
The mean daily spread between the highest and lowest priced hours: the gross energy arbitrage available each day.
| Region | 1 hour | 2 hour | 4 hour |
|---|---|---|---|
| NSW1 | A$581.05 | A$348.78 | A$217.96 |
| QLD1 | A$142.38 | A$125.20 | A$108.22 |
| SA1 | A$245.59 | A$213.57 | A$181.11 |
| TAS1 | A$127.61 | A$113.90 | A$99.23 |
| VIC1 | A$159.01 | A$143.58 | A$125.86 |
Mean of 31 complete market days, A$/MWh. GET /v1/markets/nem/spreads.
A Published Index with a Public Methodology
| Rule | How it works |
|---|---|
| Cohort | Grid-scale bidirectional batteries of 5 MW or more, grouped by market region and duration band (under 1.5 h, 1.5–3 h, 3–6 h, 6 h and over) from market registration data. |
| Value | Monthly median (Hyndman–Fan type 7) of each contributing battery's energy plus ancillary services net revenue per MW, annualised over its metered intervals. Equal weights. |
| Survivorship | A battery stays in every period it was registered for, including after it stops operating. |
| Privacy | Statistics are published for cohorts of five or more contributing batteries; individual results stay private. |
| Revisions | A published value is never overwritten. A recomputation publishes a new revision and a restatement record; every earlier revision stays readable. |
Who It's for
Battery Developers
Size and site a battery against what existing peers in the same region and duration actually earned.
Asset Owners and Optimisers
Break revenue down by stream and service, and see your cohort position month by month.
Advisers
Use a dated, revisioned index with a public methodology in a revenue discussion.
Pro, Available Via API
Battery streams, spreads and cohort statistics are available via API for Pro and Enterprise on request. Per-asset peer position is never free. The ancillary service and price views are in the Pro app.
Know How the Grid Treats a Site
More of the observed record behind a connection point.
Start Free, Upgrade When You Need the Evidence
Analyst US$75 a month · Pro US$150 a month · Annual plans 15% off: US$765 and US$1,530 a year.
Self-serve: pay by card or company invoice, no demo needed · Cancel anytime


