

Docs Menu
International Market Views
Each international market offers the same families of views. This page shows one worked example of each view, names the market it was taken from, and lists the other markets where the same view is available.
Watch the Video: International Markets & US Aggregate (1:17)
Open Markets in the product switcher, pick the market, then the view from the left-hand menu. See the Network Map Markets Guide for the common controls and plan access.
Overview
Dispatch Overview
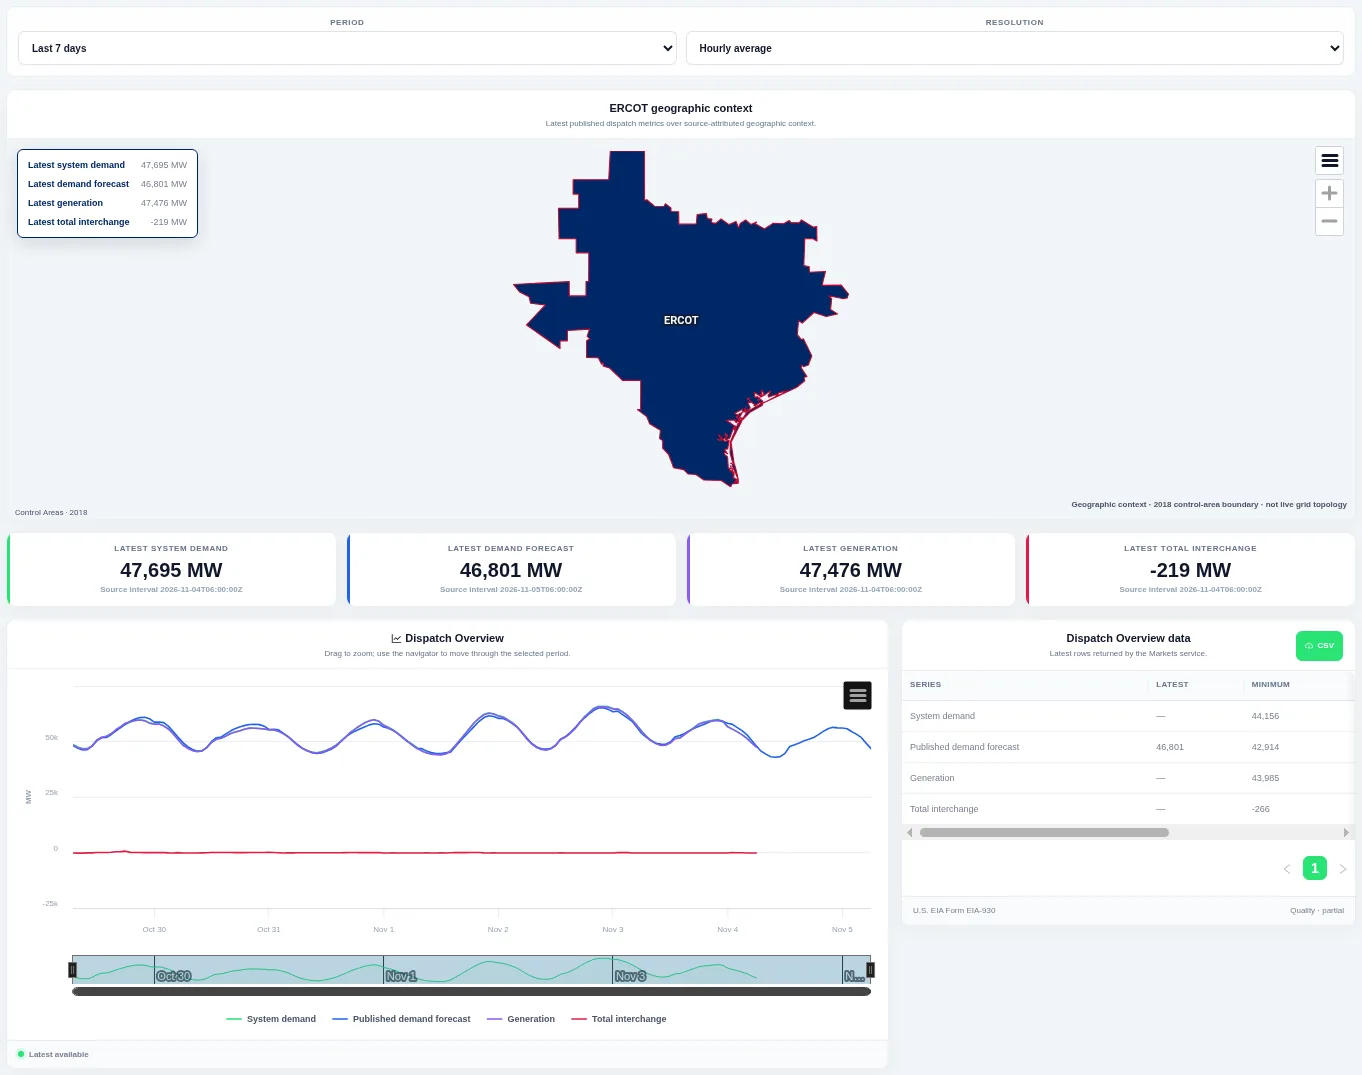
A geographic context map, cards for the latest demand, forecast, generation and interchange, and a chart of those series over time. Choose the period and resolution at the top; the table lists the latest, minimum and maximum of each series.
Shown for ERCOT. Available in: ERCOT, CAISO, PJM, MISO, NYISO, ISO-NE, SPP, Great Britain, Germany, New Zealand, IESO (Ontario), AESO (Alberta), Ireland (SEM).
Demand, Generation & Interchange
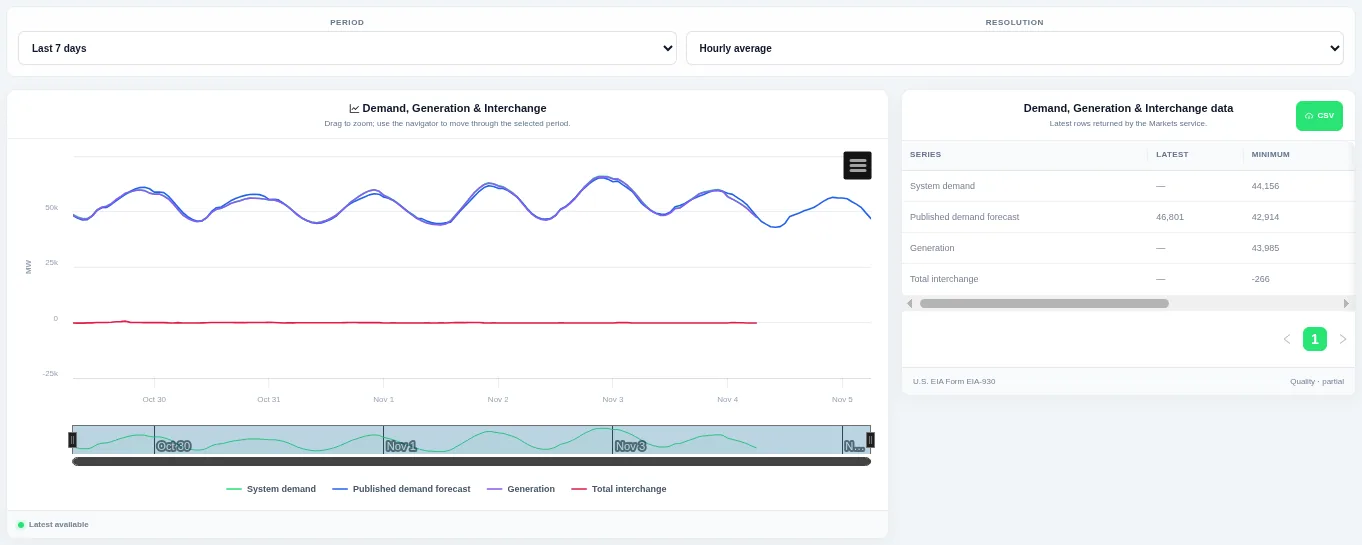
Compare the main operating series together to see how generation and interchange follow demand. Choose the period and resolution at the top, drag to zoom, and use the table for the latest values and a CSV download.
Shown for ERCOT. Available in: ERCOT, CAISO, PJM, MISO, NYISO, ISO-NE, SPP, Great Britain, Germany, New Zealand, IESO (Ontario), AESO (Alberta), Ireland (SEM).
Demand
System Demand
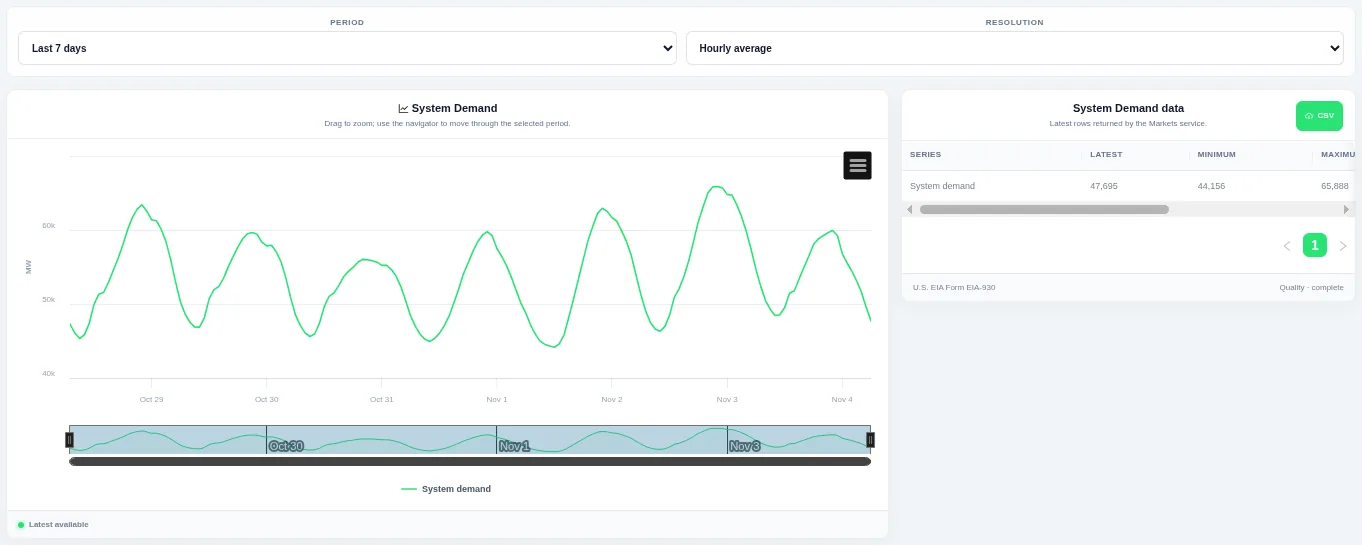
Drag on the chart or the navigator to zoom into part of the period. Choose the period and the resolution at the top; the table beside the chart lists the rows behind it and can be downloaded as CSV.
Shown for ERCOT. Available in: ERCOT, CAISO, PJM, MISO, NYISO, ISO-NE, SPP, Great Britain, Germany, New Zealand, IESO (Ontario), AESO (Alberta), Ireland (SEM).
Daily Demand Profiles
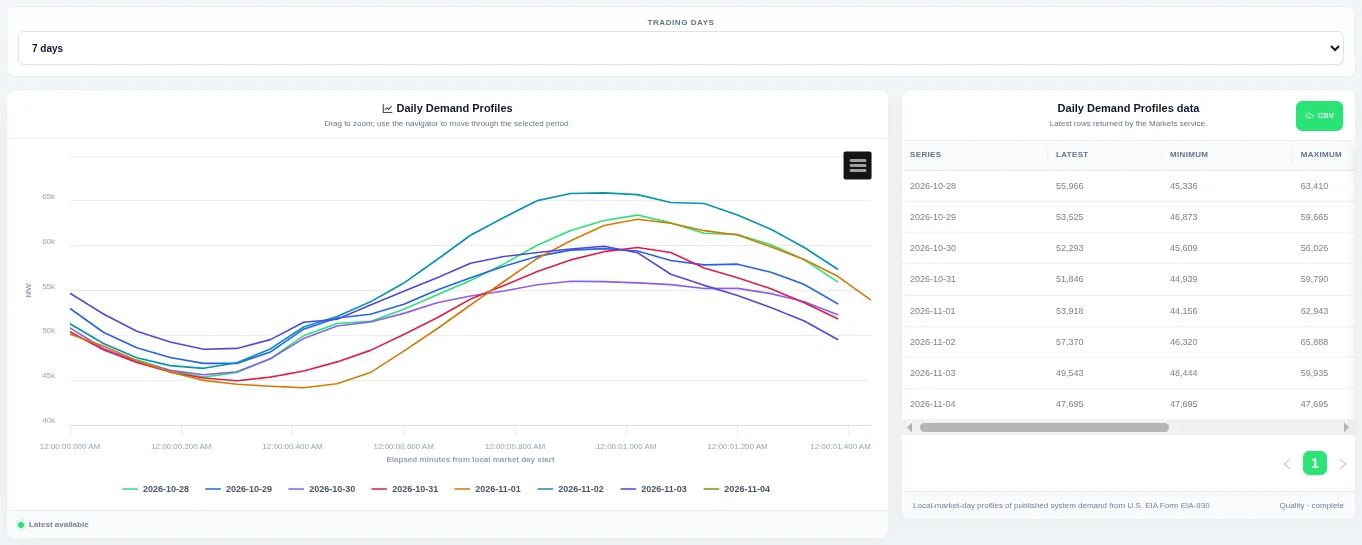
Each line is one trading day, so you can compare the daily shape. Choose how many trading days to compare at the top; the table beside the chart lists the rows behind it and can be downloaded as CSV.
Shown for ERCOT. Available in: ERCOT, CAISO, PJM, MISO, NYISO, ISO-NE, SPP, Great Britain, Germany, New Zealand, IESO (Ontario), AESO (Alberta), Ireland (SEM).
Historical Demand Profile
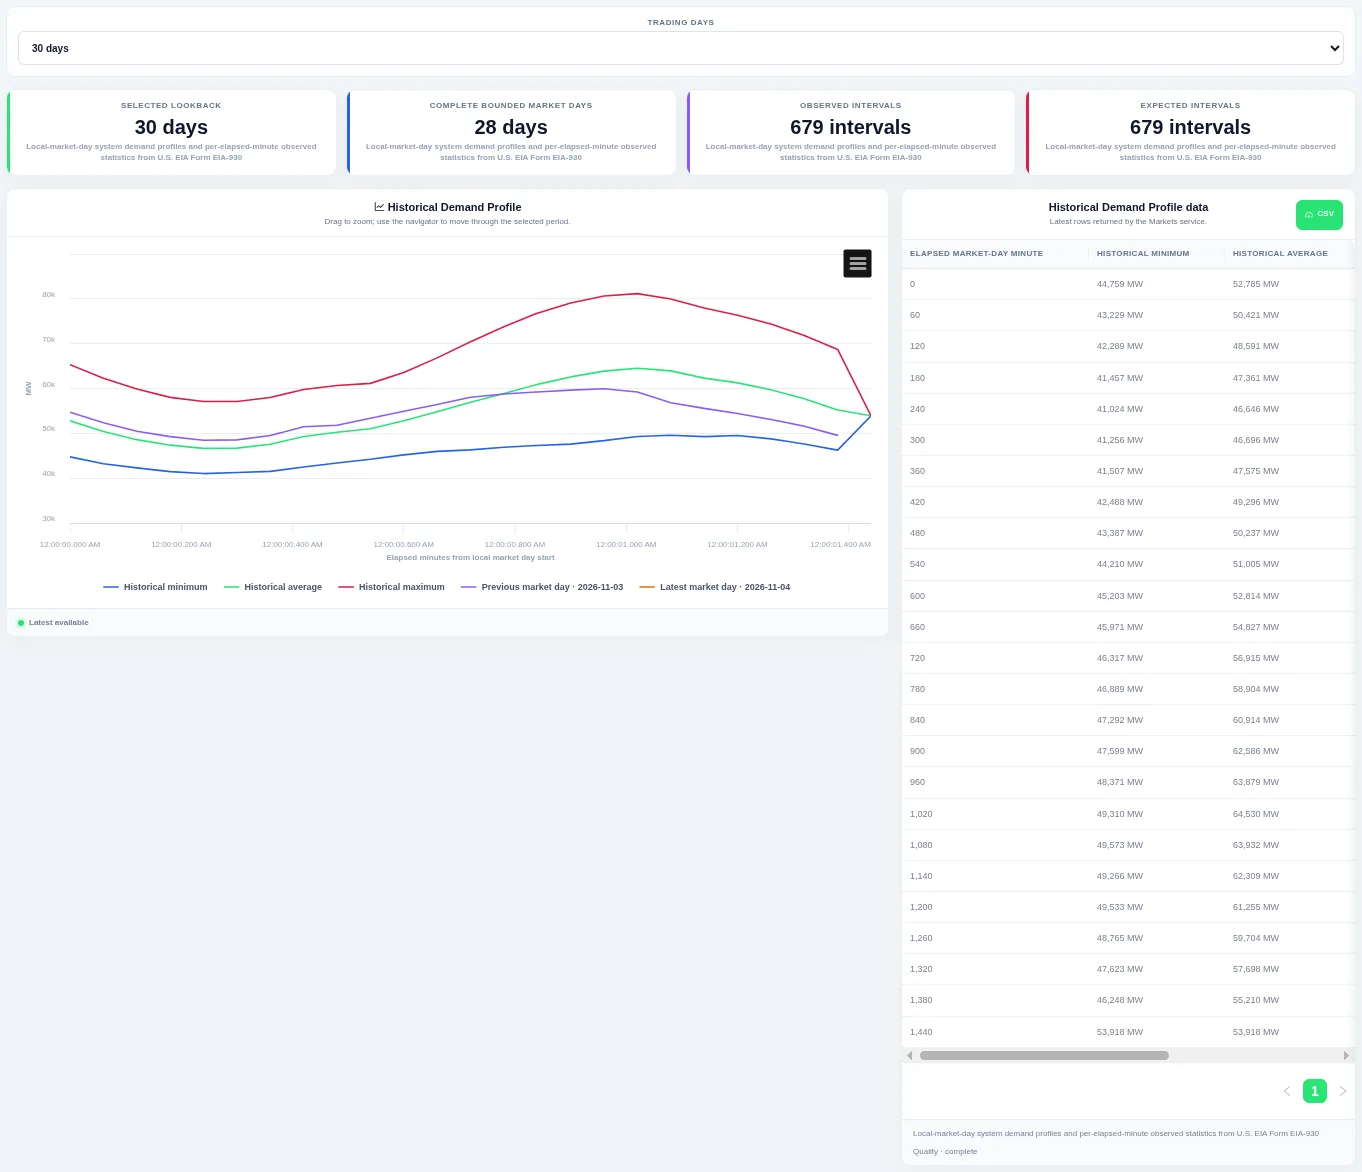
The previous and latest trading days are drawn on top so you can see whether today is unusual. Choose how many trading days to compare at the top; the table beside the chart lists the rows behind it and can be downloaded as CSV.
Shown for ERCOT. Available in: ERCOT, CAISO, PJM, MISO, NYISO, ISO-NE, SPP, Great Britain, Germany, New Zealand, IESO (Ontario), AESO (Alberta), Ireland (SEM).
Demand Distribution
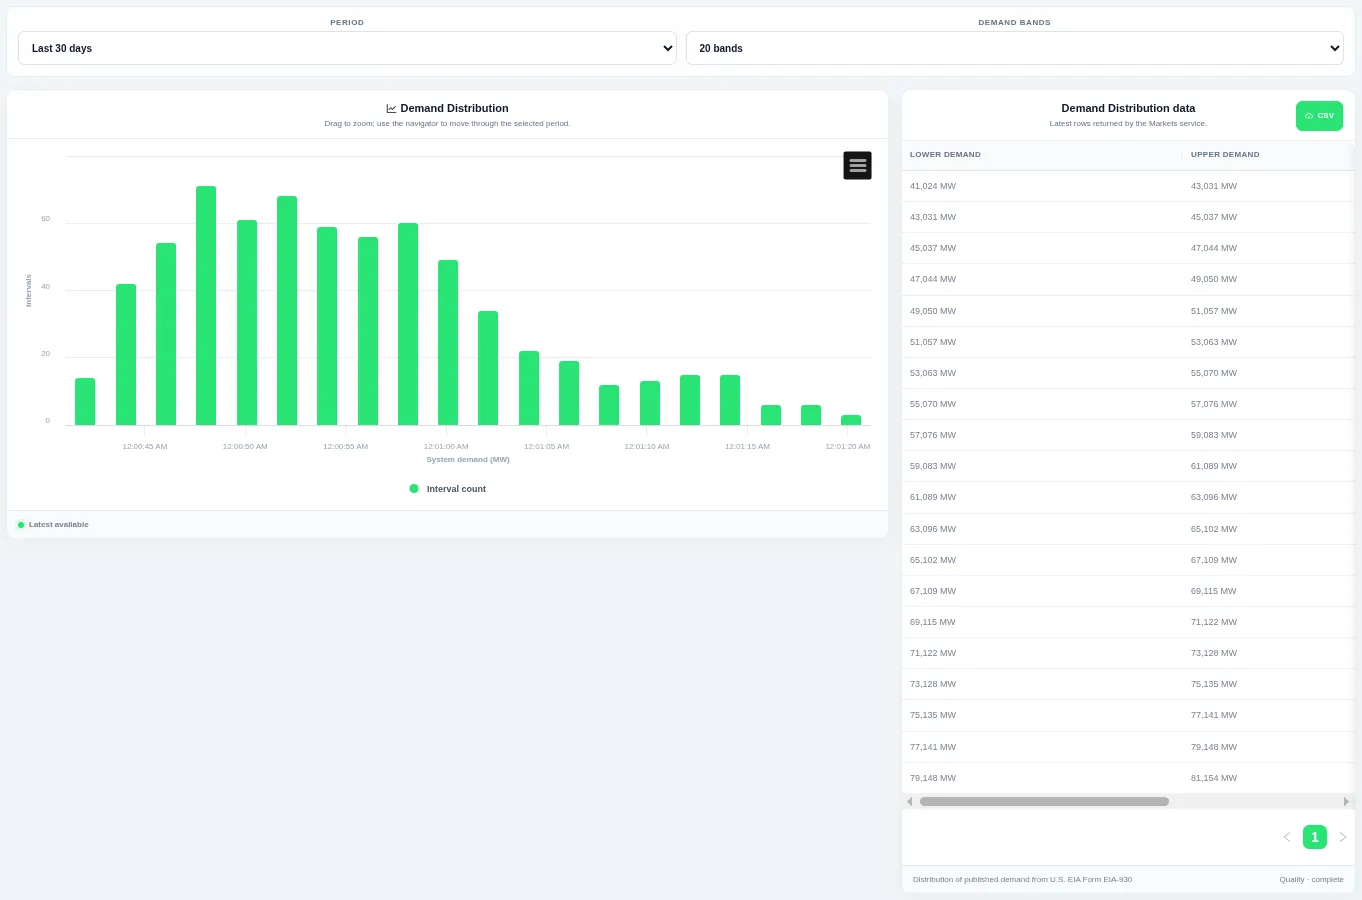
Taller bars show the levels that occur most often over the chosen period. Choose the period and the number of bands at the top; the table beside the chart lists the rows behind it and can be downloaded as CSV.
Shown for ERCOT. Available in: ERCOT, CAISO, PJM, MISO, NYISO, ISO-NE, SPP, Great Britain, Germany, New Zealand, IESO (Ontario), AESO (Alberta), Ireland (SEM).
Demand Duration Curve
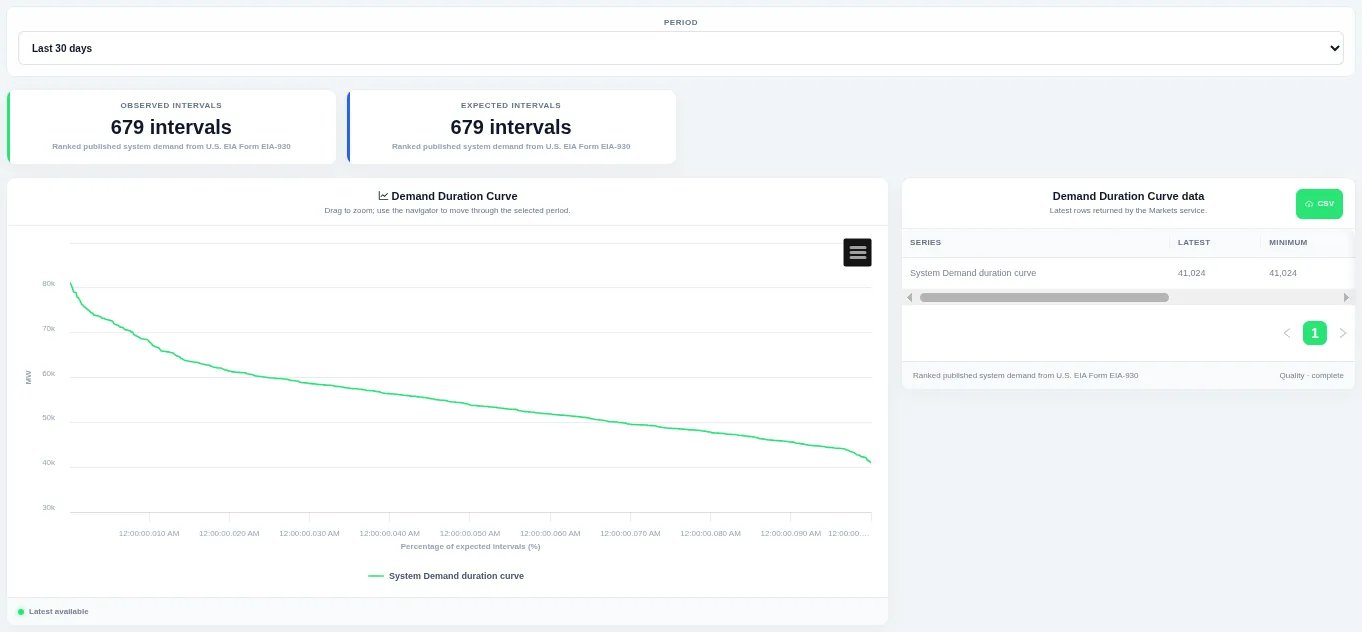
The curve shows how much of the time a level was met or exceeded. Choose the period at the top; the table beside the chart lists the rows behind it and can be downloaded as CSV.
Shown for ERCOT. Available in: ERCOT, CAISO, PJM, MISO, NYISO, ISO-NE, SPP, Great Britain, Germany, New Zealand, IESO (Ontario), AESO (Alberta), Ireland (SEM).
Demand Interval Change
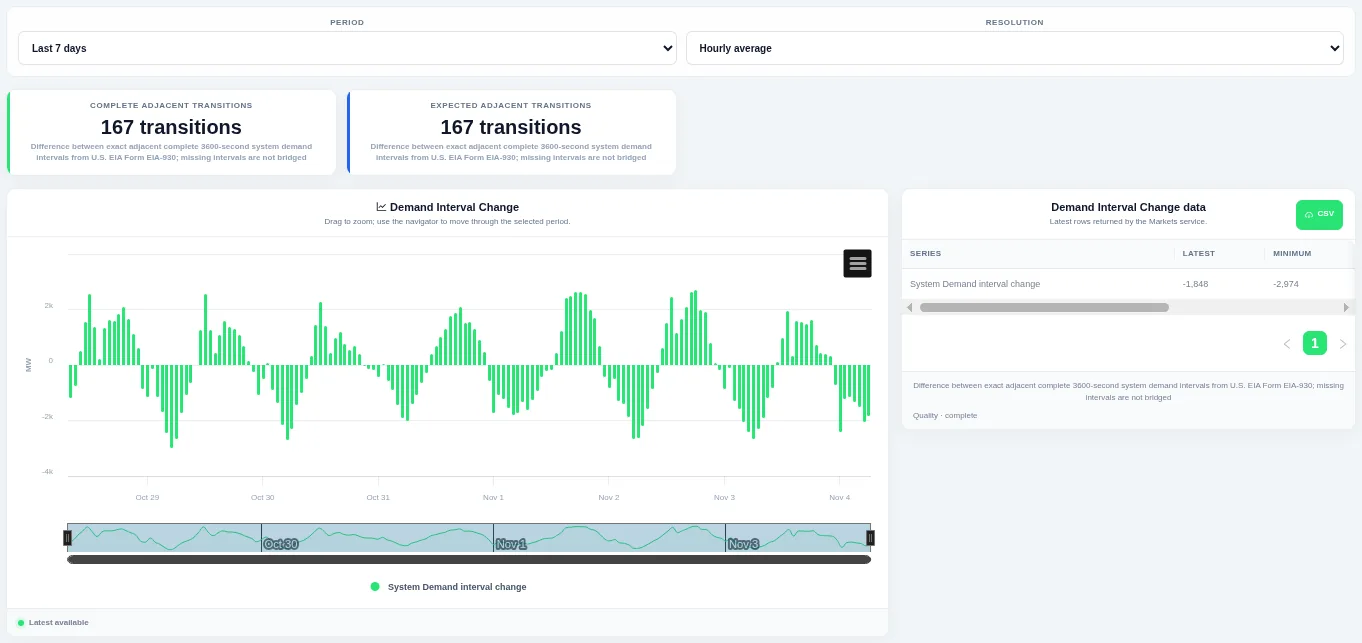
Bars above zero are rises and bars below zero are falls, so ramps stand out. Choose the period and the resolution at the top; the table beside the chart lists the rows behind it and can be downloaded as CSV.
Shown for ERCOT. Available in: ERCOT, CAISO, PJM, MISO, NYISO, ISO-NE, SPP, Great Britain, Germany, New Zealand, IESO (Ontario), AESO (Alberta), Ireland (SEM).
Demand Change Distribution
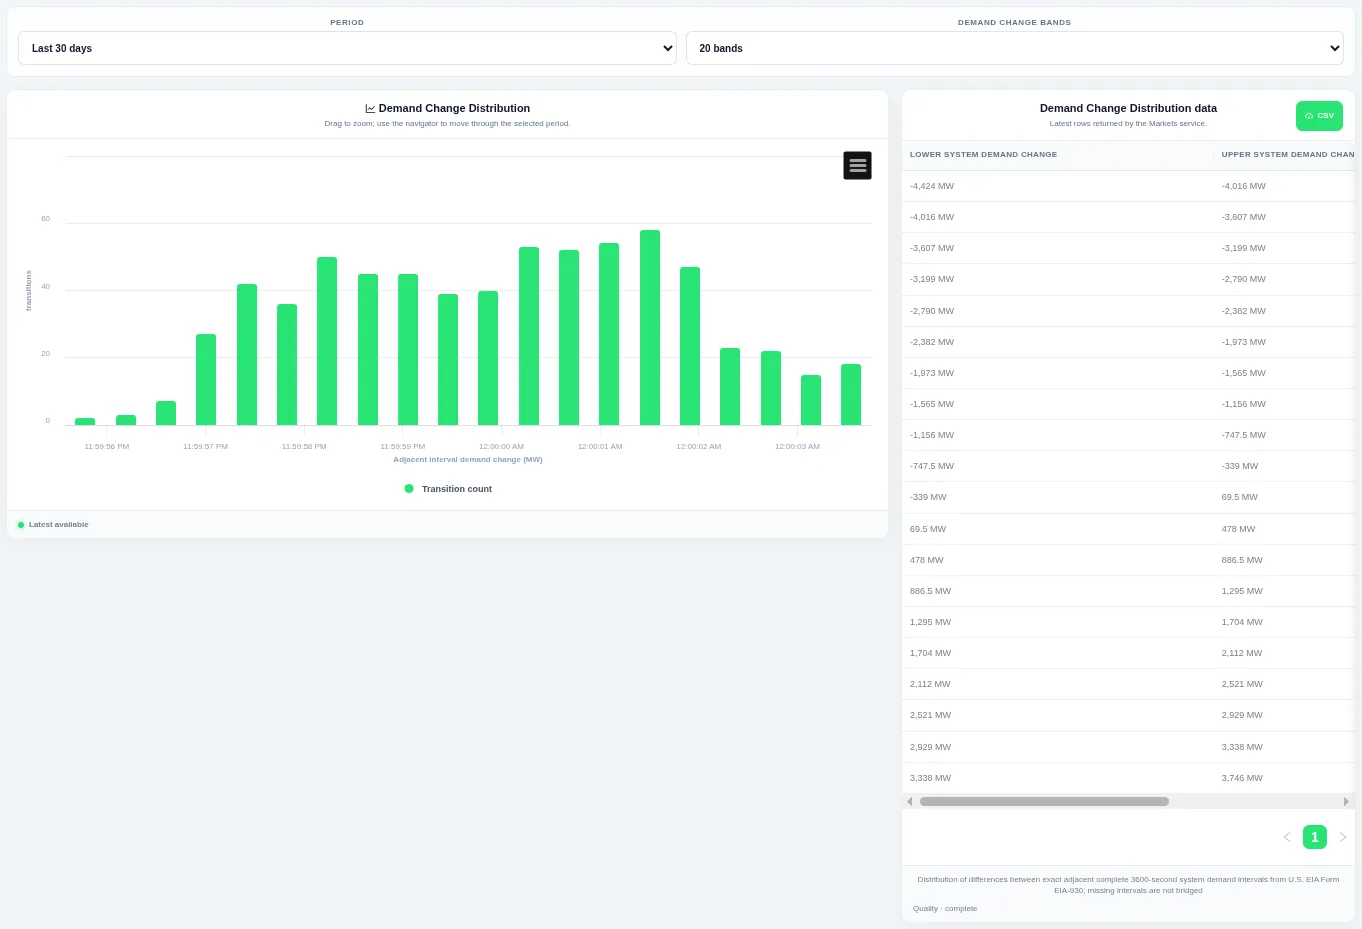
Taller bars show the size of change that happens most often, and the tails show rare large steps. Choose the period and the number of bands at the top; the table beside the chart lists the rows behind it and can be downloaded as CSV.
Shown for ERCOT. Available in: ERCOT, CAISO, PJM, MISO, NYISO, ISO-NE, SPP, Great Britain, Germany, New Zealand, IESO (Ontario), AESO (Alberta), Ireland (SEM).
Demand Change Duration Curve
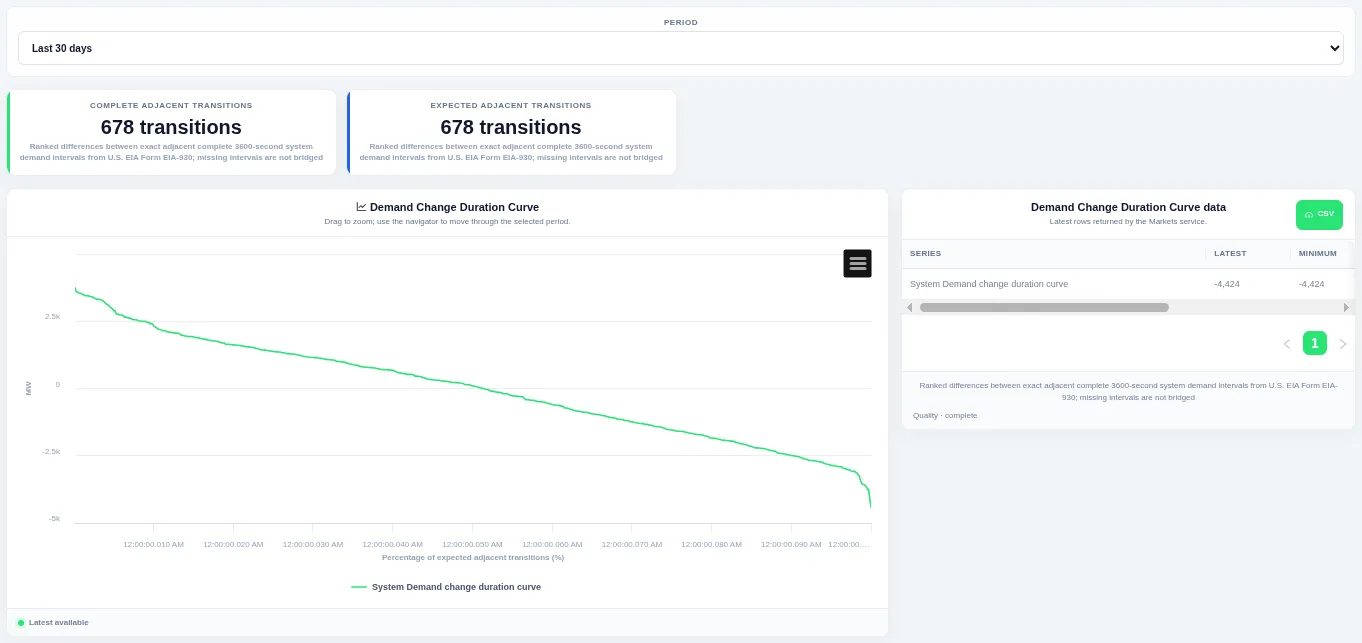
The steep ends of the curve show how often large ramps happen. Choose the period at the top; the table beside the chart lists the rows behind it and can be downloaded as CSV.
Shown for ERCOT. Available in: ERCOT, CAISO, PJM, MISO, NYISO, ISO-NE, SPP, Great Britain, Germany, New Zealand, IESO (Ontario), AESO (Alberta), Ireland (SEM).
Subregion Demand
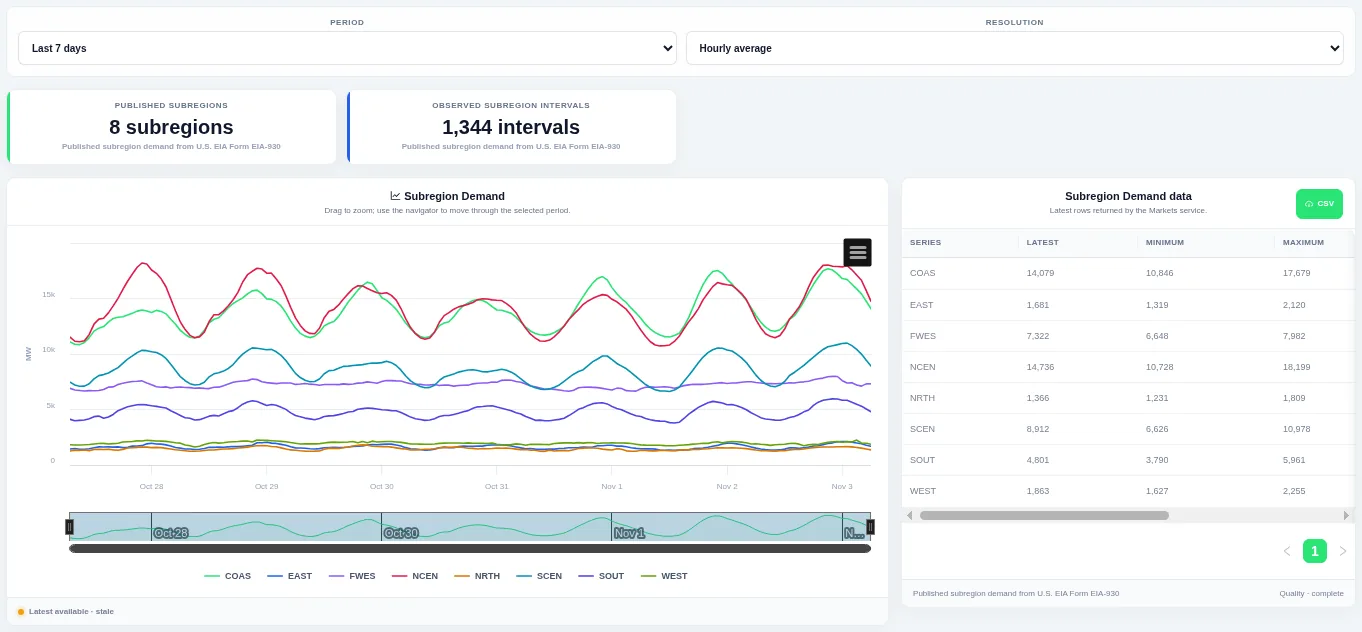
Drag on the chart or the navigator to zoom into part of the period. Choose the period and the resolution at the top; the table beside the chart lists the rows behind it and can be downloaded as CSV.
Shown for ERCOT. Available in: ERCOT, CAISO, PJM, MISO, NYISO, ISO-NE, SPP, New Zealand, IESO (Ontario).
Subregion Demand Historical Profile
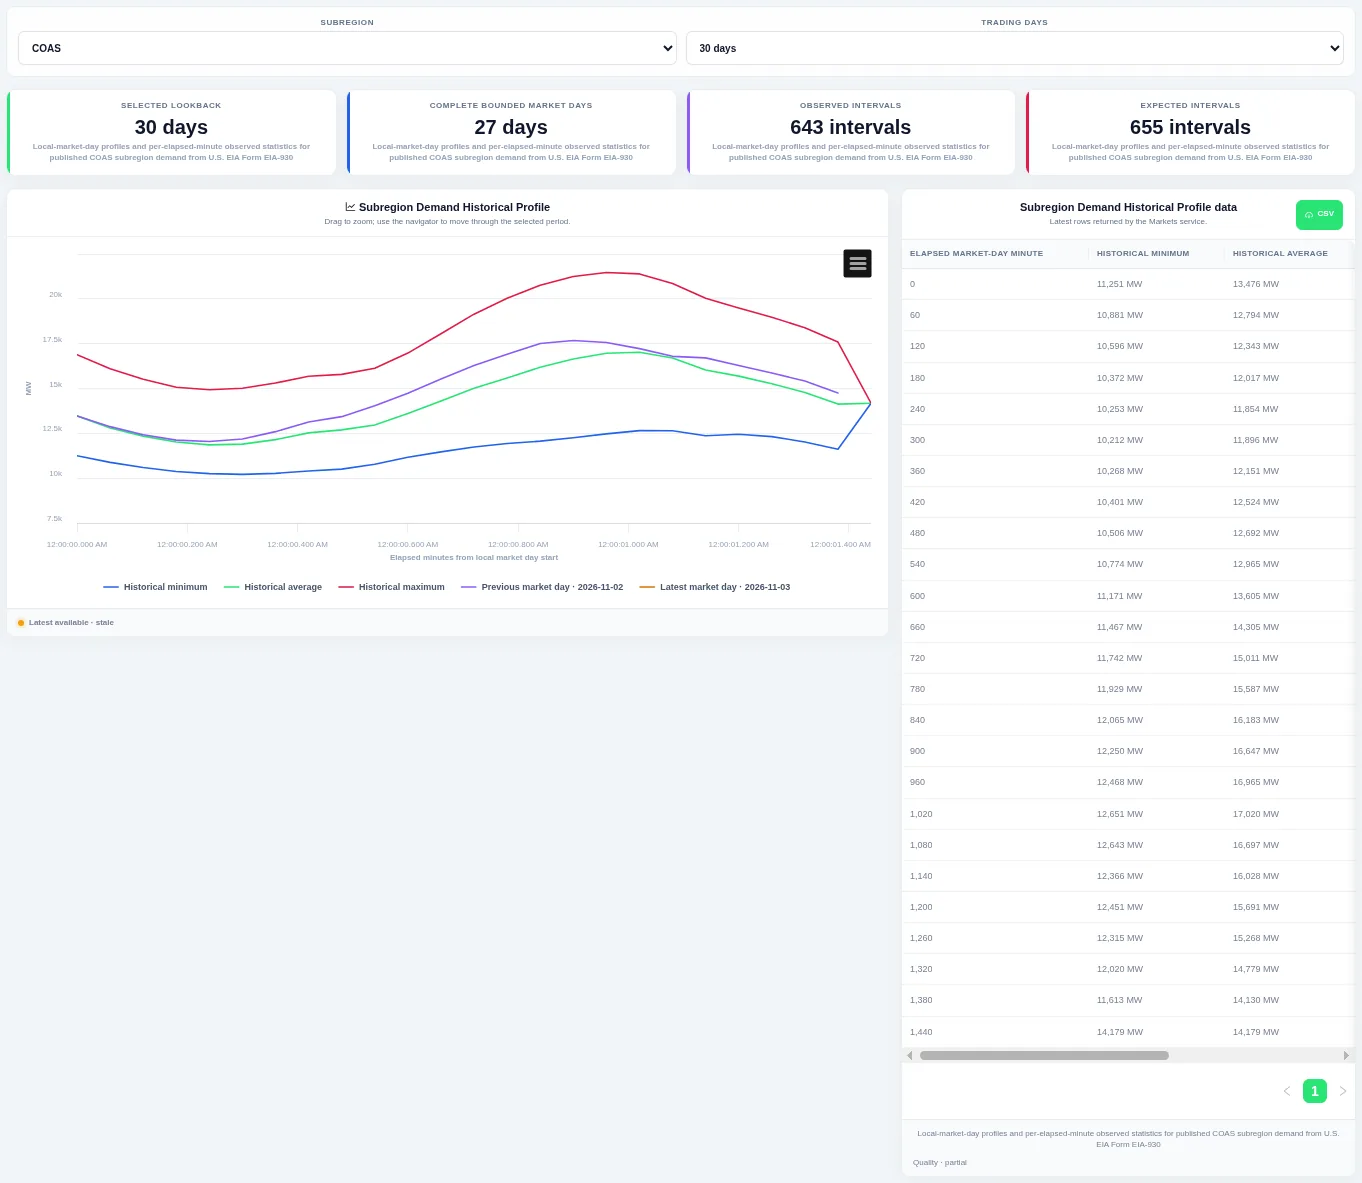
The previous and latest trading days are drawn on top so you can see whether today is unusual. Choose the subregion and how many trading days to compare at the top; the table beside the chart lists the rows behind it and can be downloaded as CSV.
Shown for ERCOT. Available in: ERCOT, CAISO, PJM, MISO, NYISO, ISO-NE, SPP, New Zealand, IESO (Ontario).
Subregion Demand Duration Curves
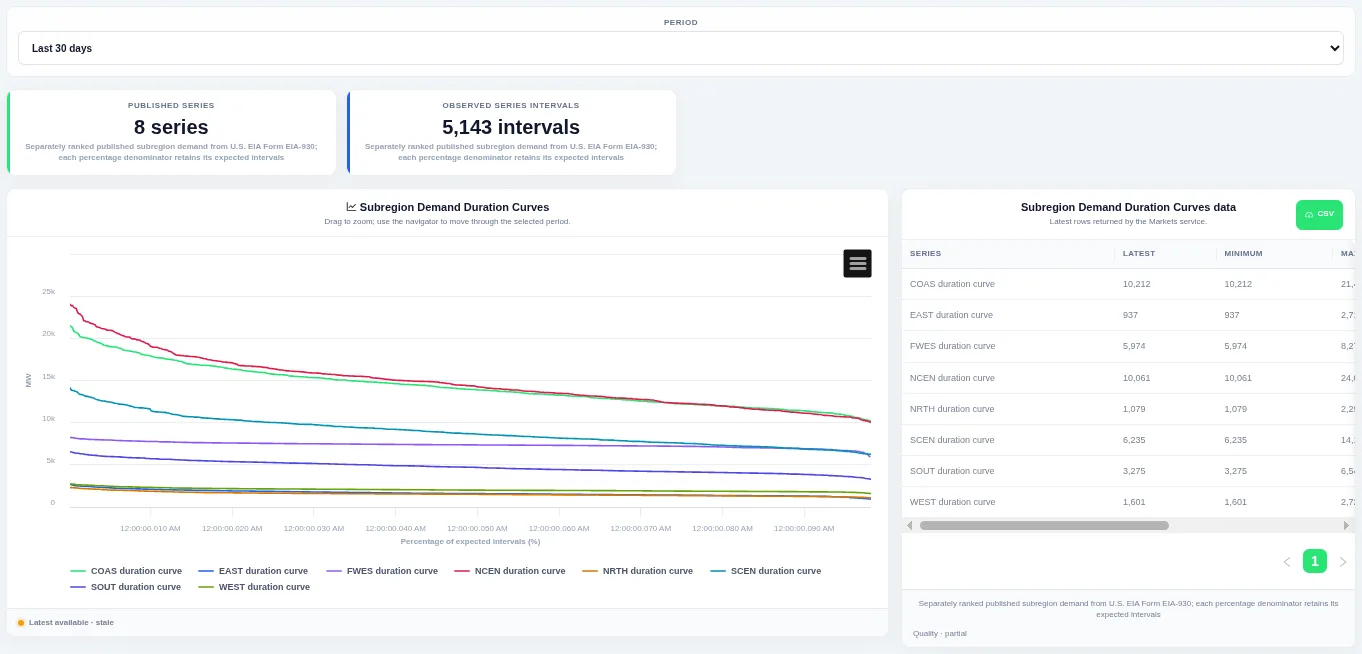
The curve shows how much of the time a level was met or exceeded. Choose the period at the top; the table beside the chart lists the rows behind it and can be downloaded as CSV.
Shown for ERCOT. Available in: ERCOT, CAISO, PJM, MISO, NYISO, ISO-NE, SPP, New Zealand, IESO (Ontario).
Subregion Demand Interval Change
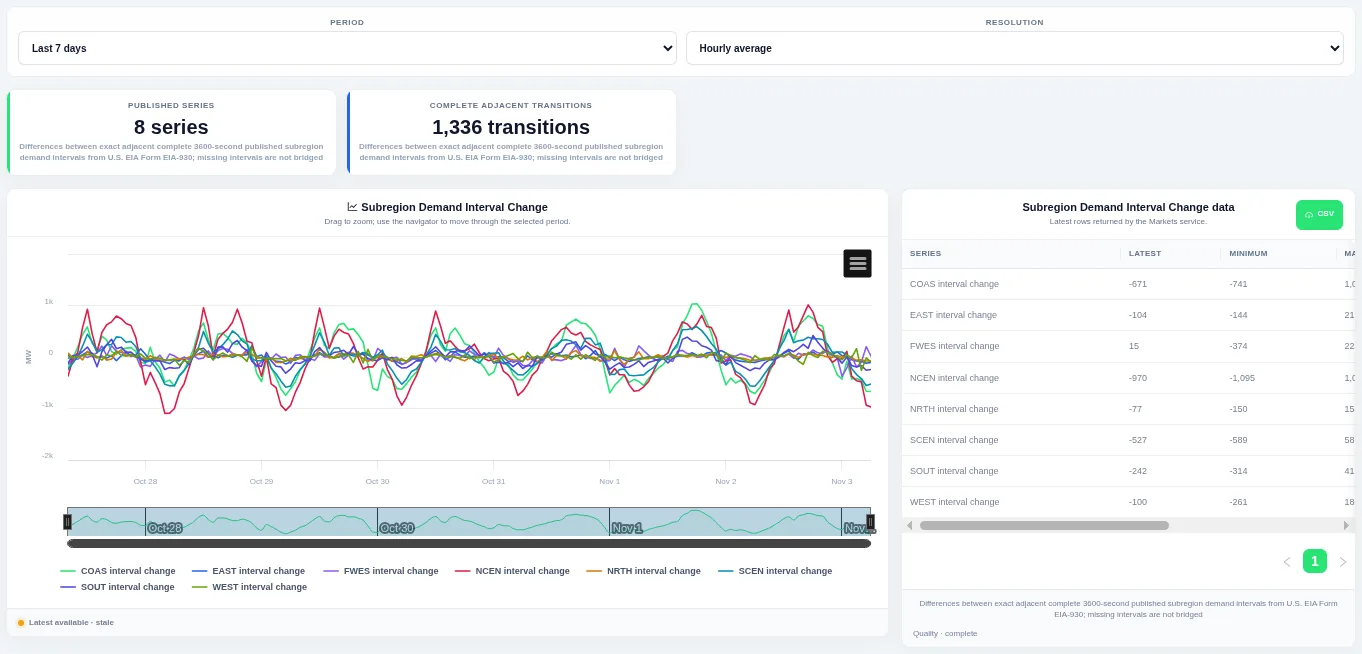
Bars above zero are rises and bars below zero are falls, so ramps stand out. Choose the period and the resolution at the top; the table beside the chart lists the rows behind it and can be downloaded as CSV.
Shown for ERCOT. Available in: ERCOT, CAISO, PJM, MISO, NYISO, ISO-NE, SPP, New Zealand, IESO (Ontario).
Latest Subregion Demand
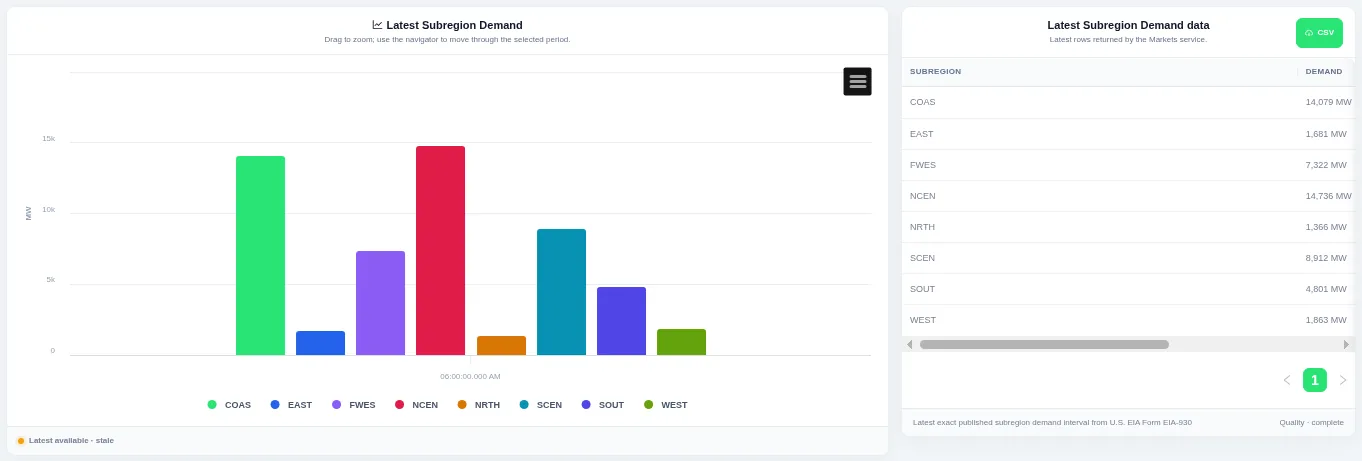
Each bar is one series for the most recent interval. The view always shows the latest published interval, and the table beside the chart lists the rows behind it with a CSV download.
Shown for ERCOT. Available in: ERCOT, CAISO, PJM, MISO, NYISO, ISO-NE, SPP, New Zealand, IESO (Ontario).
Subregion Demand Change Duration Curves
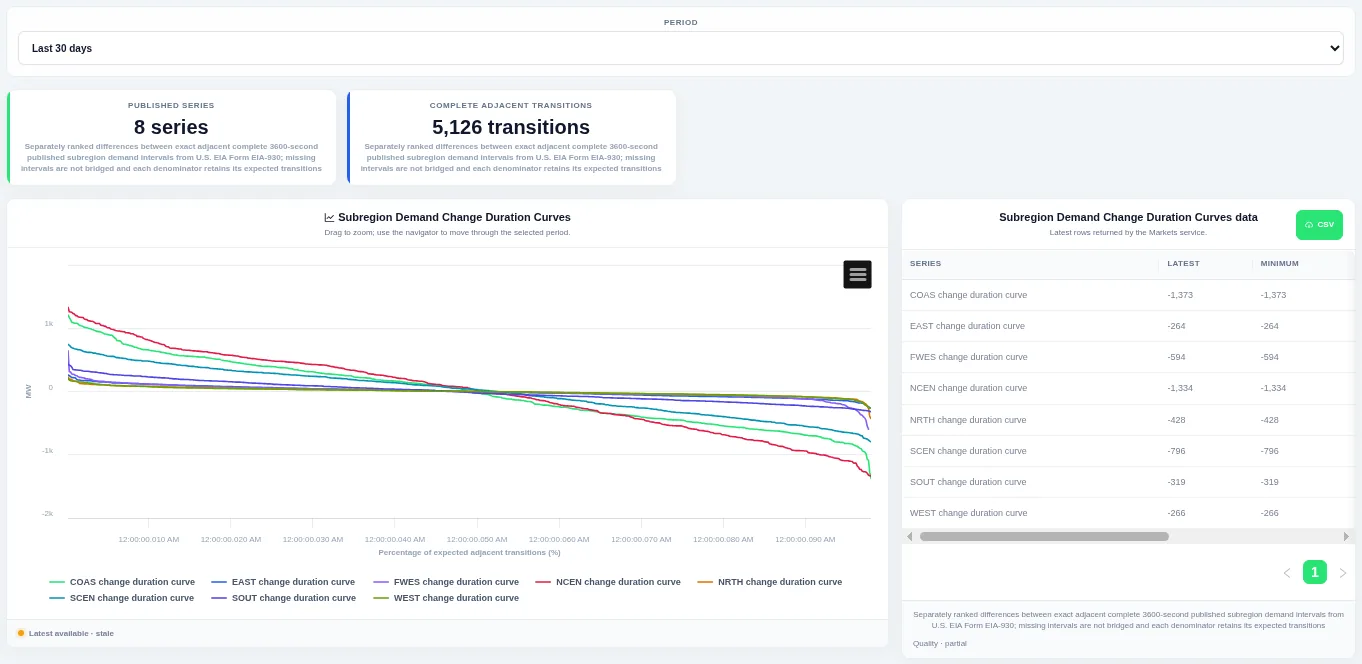
The steep ends of the curve show how often large ramps happen. Choose the period at the top; the table beside the chart lists the rows behind it and can be downloaded as CSV.
Shown for ERCOT. Available in: ERCOT, CAISO, PJM, MISO, NYISO, ISO-NE, SPP, New Zealand, IESO (Ontario).
Latest Subregion Demand Changes
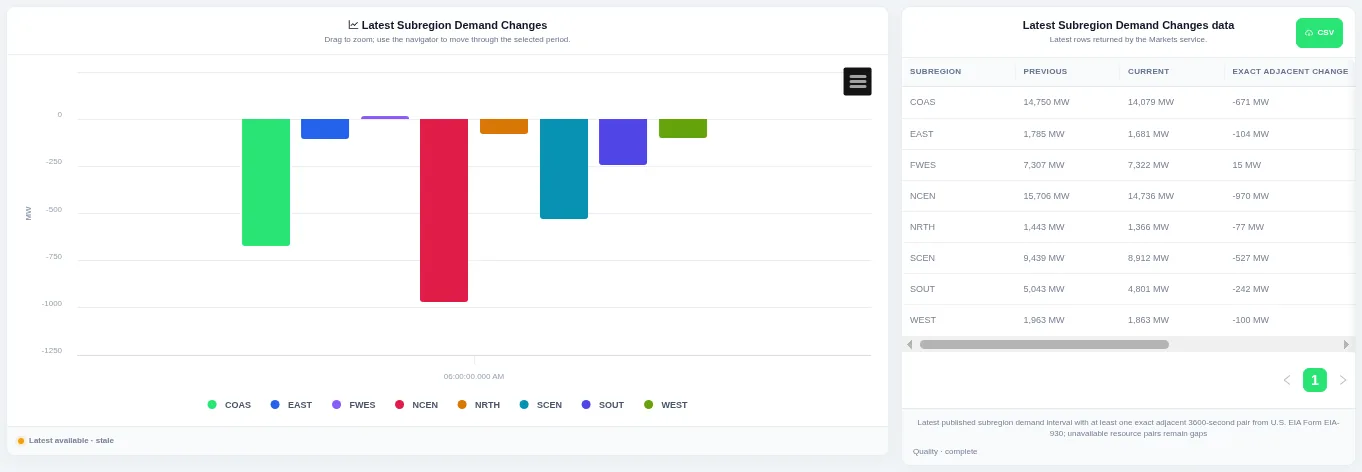
Each bar is one series, above zero for a rise and below zero for a fall. The view always shows the latest published interval, and the table beside the chart lists the rows behind it with a CSV download.
Shown for ERCOT. Available in: ERCOT, CAISO, PJM, MISO, NYISO, ISO-NE, SPP, New Zealand, IESO (Ontario).
Forecast error
Demand Forecast Comparison
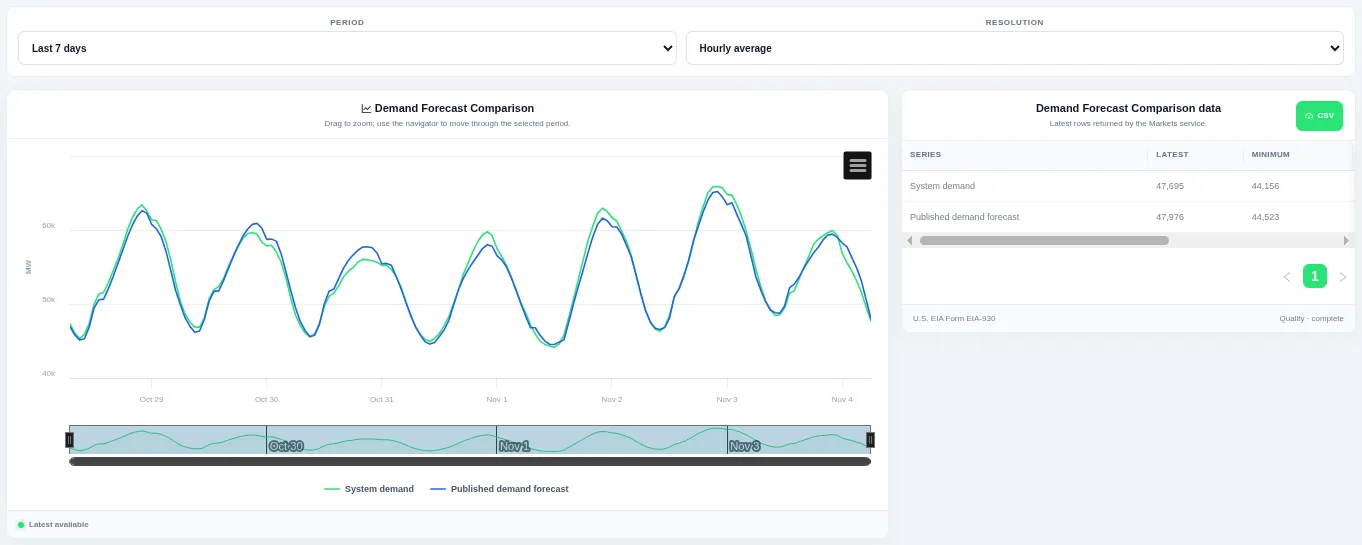
Where the two lines separate, the forecast missed. Choose the period and the resolution at the top; the table beside the chart lists the rows behind it and can be downloaded as CSV.
Shown for ERCOT. Available in: ERCOT, CAISO, PJM, MISO, NYISO, ISO-NE, SPP, Great Britain, Germany, Ireland (SEM).
Demand Forecast Error
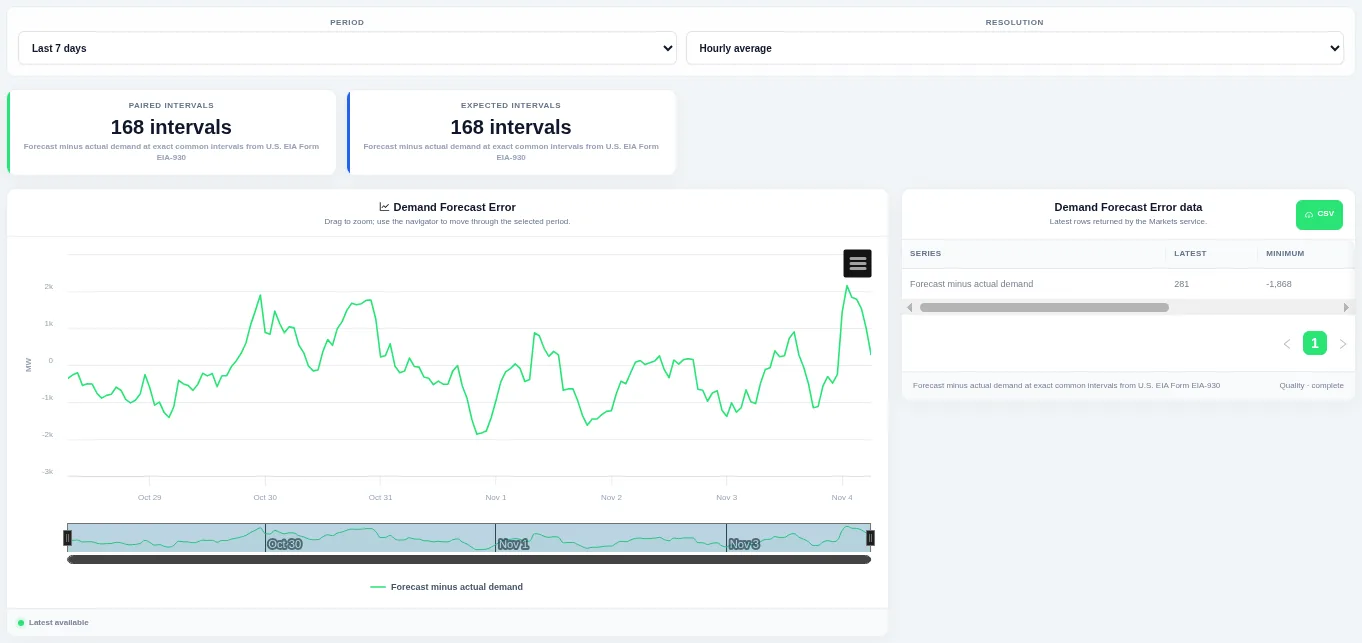
Drag on the chart or the navigator to zoom into part of the period. Choose the period and the resolution at the top; the table beside the chart lists the rows behind it and can be downloaded as CSV.
Shown for ERCOT. Available in: ERCOT, CAISO, PJM, MISO, NYISO, ISO-NE, SPP, Great Britain, Germany, Ireland (SEM).
Forecast Error Distribution
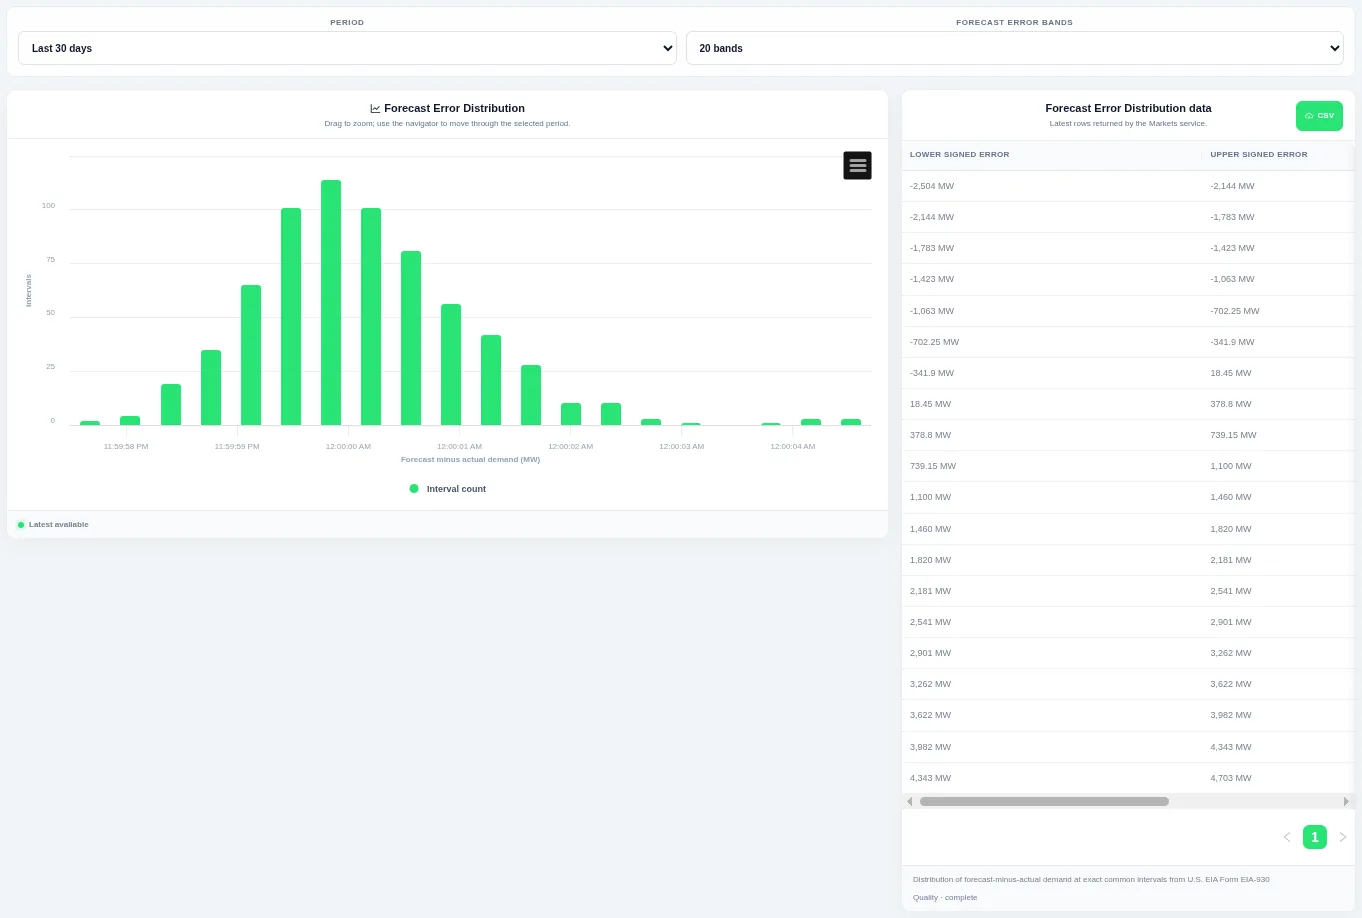
Taller bars show the levels that occur most often over the chosen period. Choose the period and the number of bands at the top; the table beside the chart lists the rows behind it and can be downloaded as CSV.
Shown for ERCOT. Available in: ERCOT, CAISO, PJM, MISO, NYISO, ISO-NE, SPP, Great Britain, Germany, Ireland (SEM).
Demand–Forecast Scatter
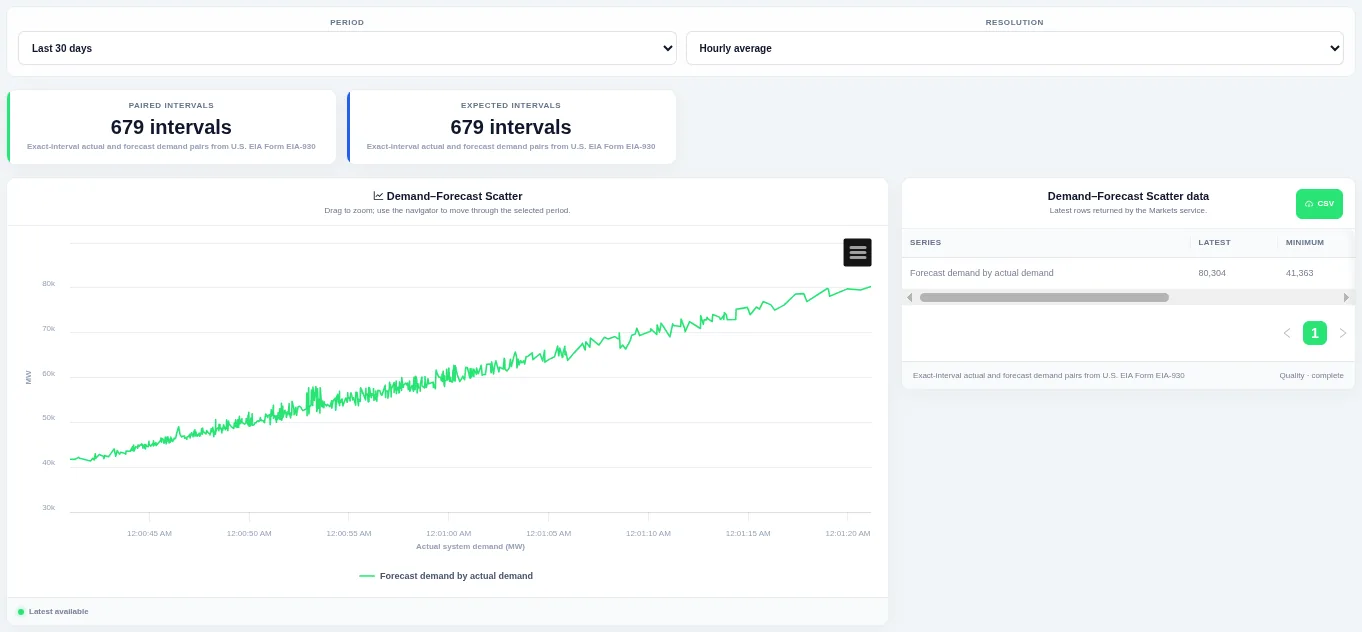
Points close to a straight rising line mean the forecast was accurate. Choose the period and the resolution at the top; the table beside the chart lists the rows behind it and can be downloaded as CSV.
Shown for ERCOT. Available in: ERCOT, CAISO, PJM, MISO, NYISO, ISO-NE, SPP, Great Britain, Germany, Ireland (SEM).
Forecast Error Duration Curve
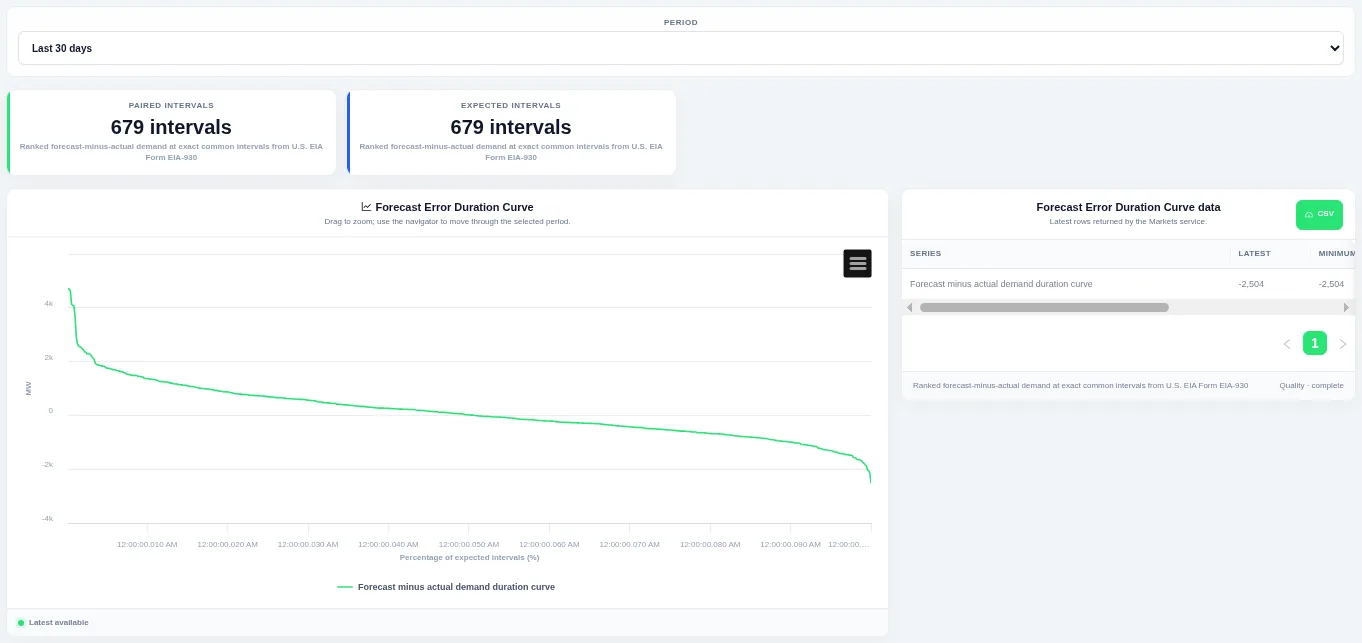
The curve shows how much of the time a level was met or exceeded. Choose the period at the top; the table beside the chart lists the rows behind it and can be downloaded as CSV.
Shown for ERCOT. Available in: ERCOT, CAISO, PJM, MISO, NYISO, ISO-NE, SPP, Great Britain, Germany, Ireland (SEM).
Daily Forecast Error Profiles
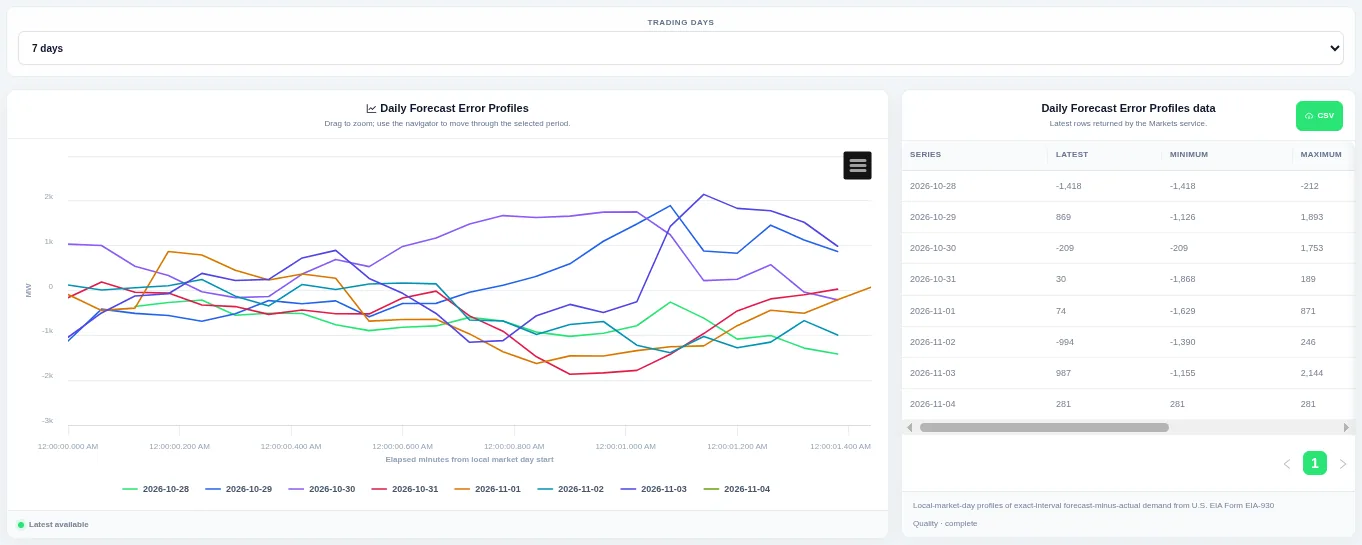
Each line is one trading day, so you can compare the daily shape. Choose how many trading days to compare at the top; the table beside the chart lists the rows behind it and can be downloaded as CSV.
Shown for ERCOT. Available in: ERCOT, CAISO, PJM, MISO, NYISO, ISO-NE, SPP, Great Britain, Germany, Ireland (SEM).
Forecast Error Historical Profile
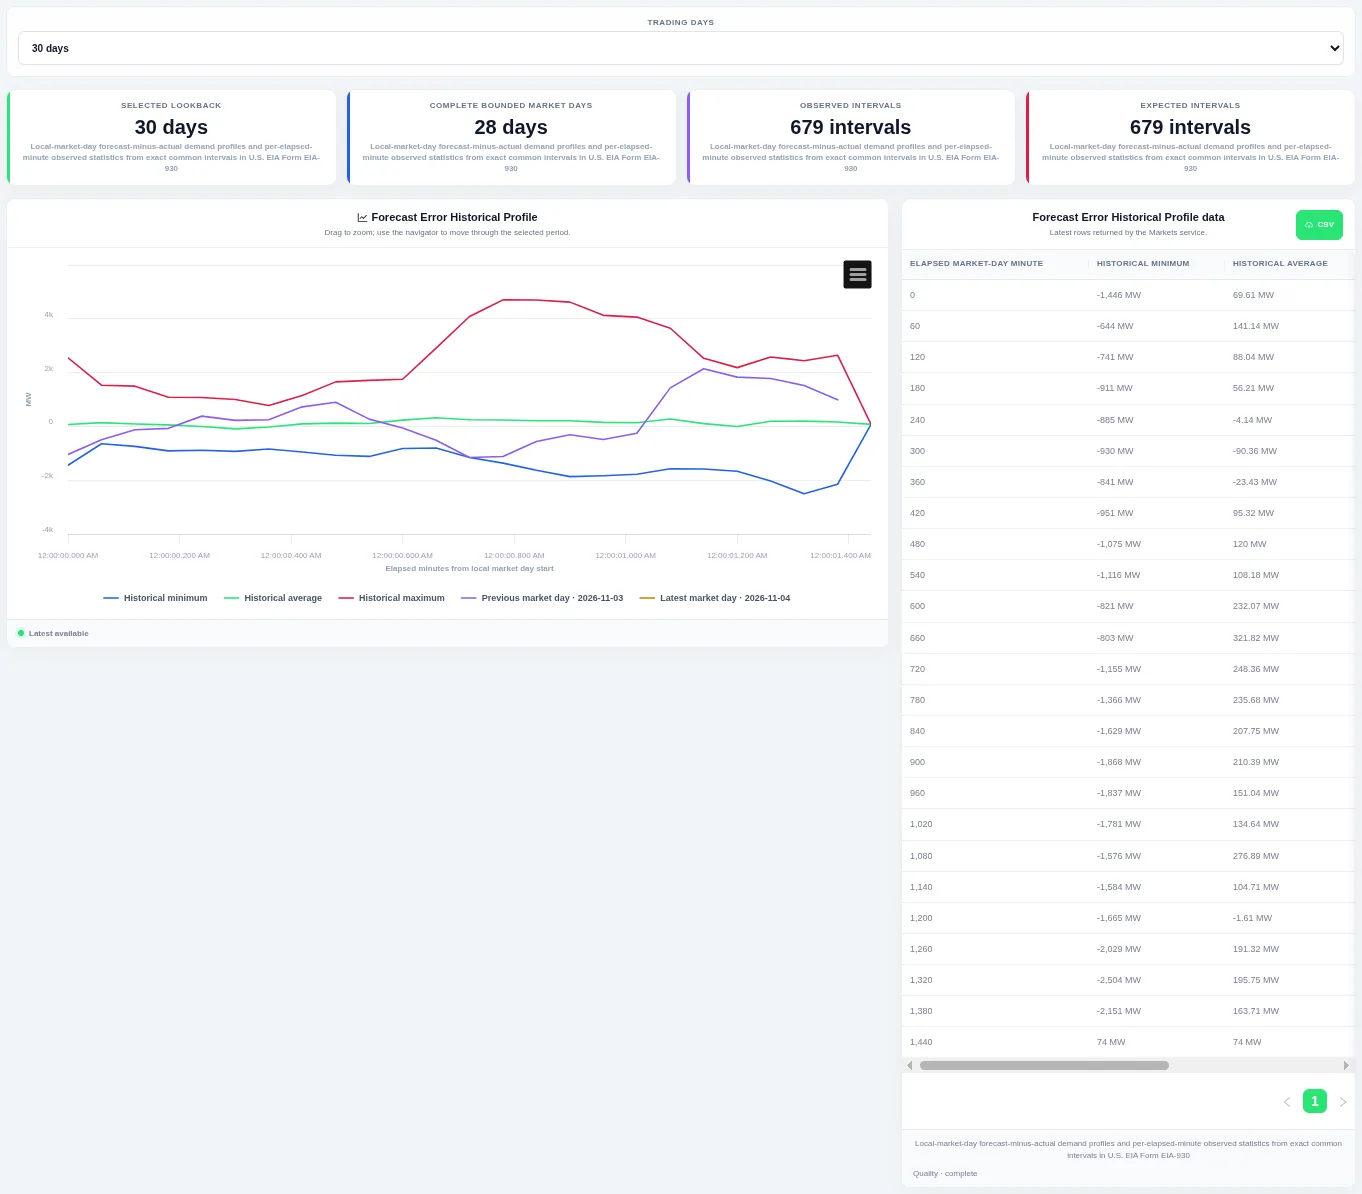
The previous and latest trading days are drawn on top so you can see whether today is unusual. Choose how many trading days to compare at the top; the table beside the chart lists the rows behind it and can be downloaded as CSV.
Shown for ERCOT. Available in: ERCOT, CAISO, PJM, MISO, NYISO, ISO-NE, SPP, Great Britain, Germany, Ireland (SEM).
Forecast Error–Demand Scatter
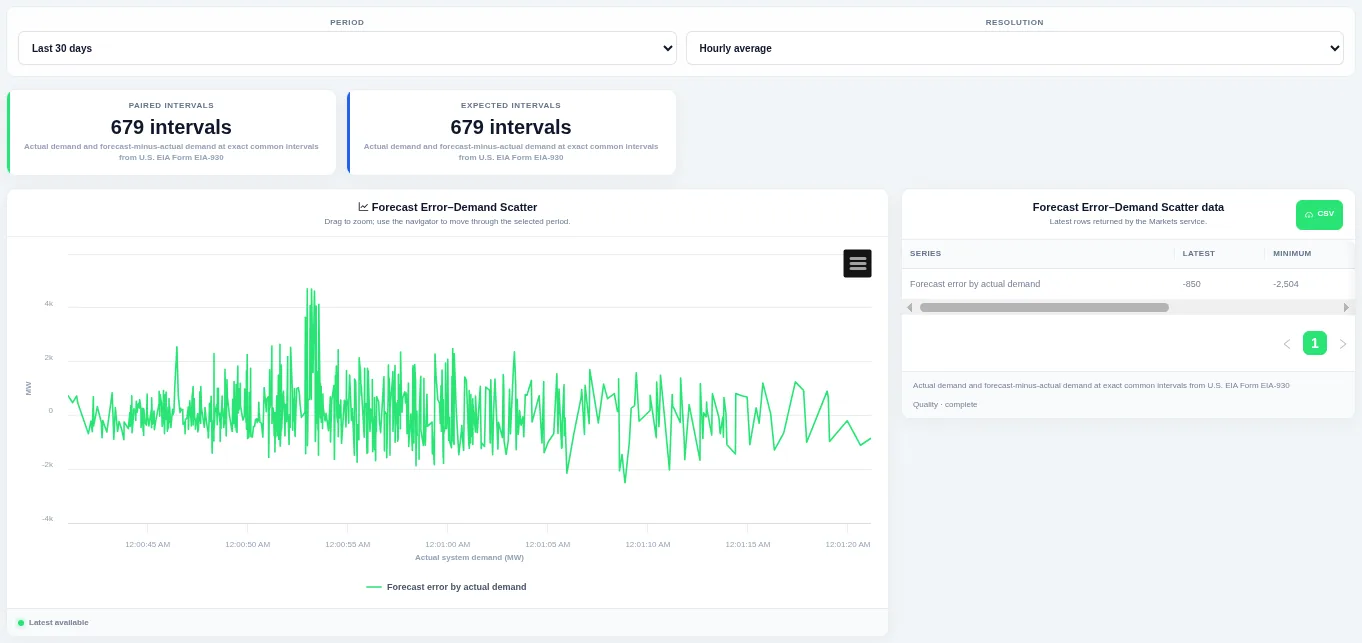
The point cloud shows whether forecasts miss more at high or low demand. Choose the period and the resolution at the top; the table beside the chart lists the rows behind it and can be downloaded as CSV.
Shown for ERCOT. Available in: ERCOT, CAISO, PJM, MISO, NYISO, ISO-NE, SPP, Great Britain, Germany, Ireland (SEM).
Generation and mix
Generation
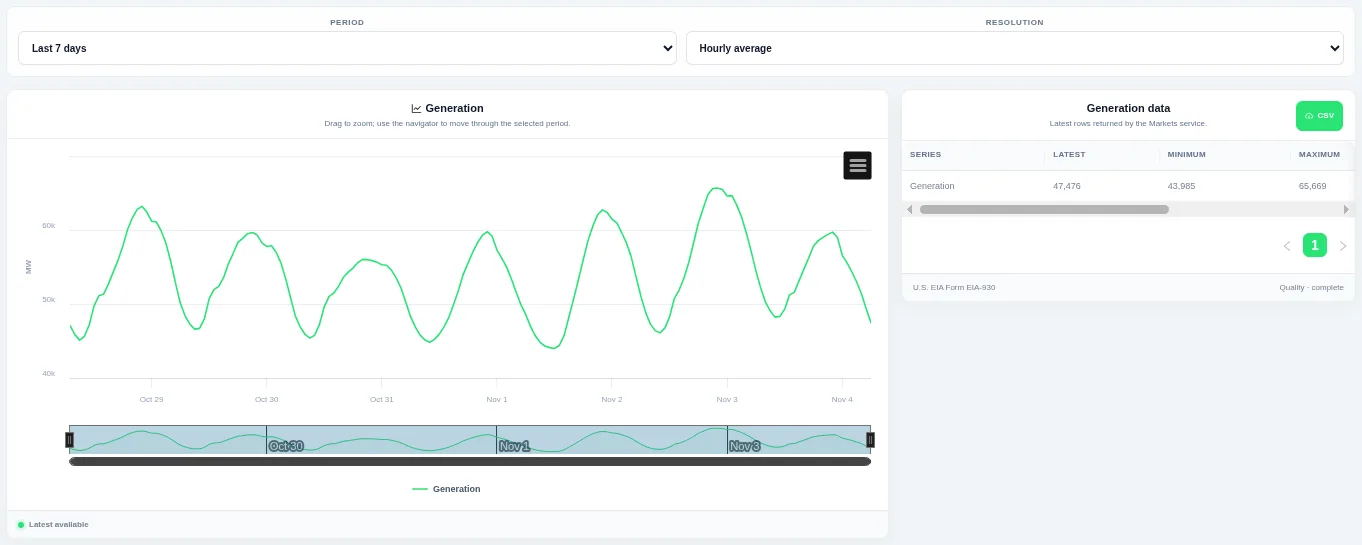
Drag on the chart or the navigator to zoom into part of the period. Choose the period and the resolution at the top; the table beside the chart lists the rows behind it and can be downloaded as CSV.
Shown for ERCOT. Available in: ERCOT, CAISO, PJM, MISO, NYISO, ISO-NE, SPP, Germany, New Zealand, AESO (Alberta), Ireland (SEM).
Daily Generation Profiles
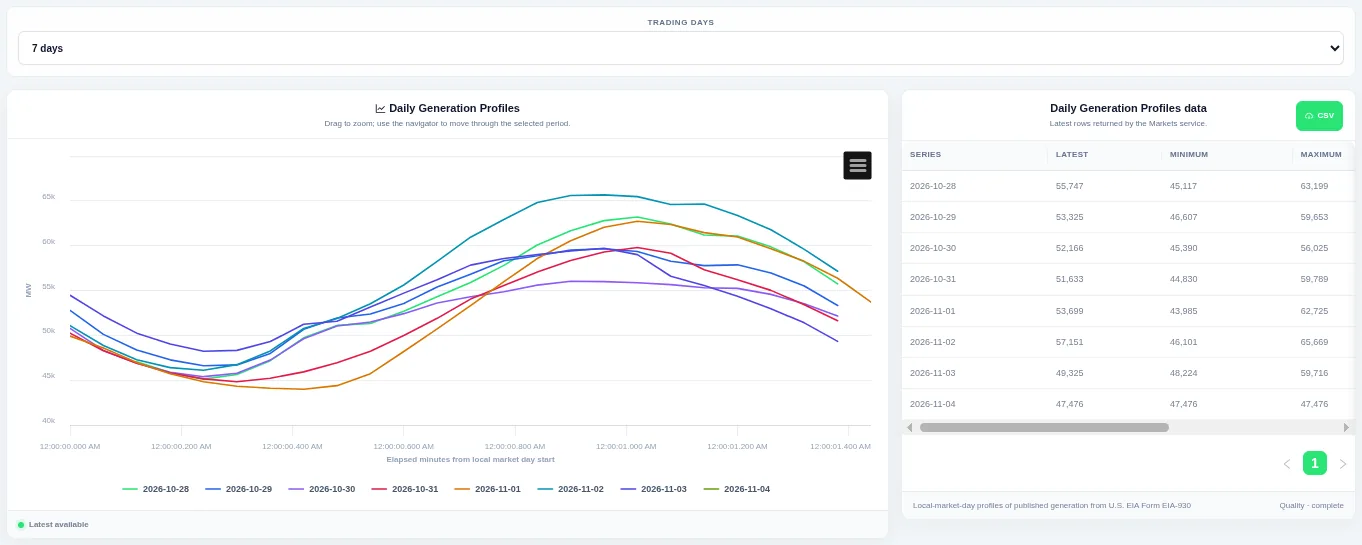
Each line is one trading day, so you can compare the daily shape. Choose how many trading days to compare at the top; the table beside the chart lists the rows behind it and can be downloaded as CSV.
Shown for ERCOT. Available in: ERCOT, CAISO, PJM, MISO, NYISO, ISO-NE, SPP, Germany, New Zealand, AESO (Alberta), Ireland (SEM).
Generation Historical Profile
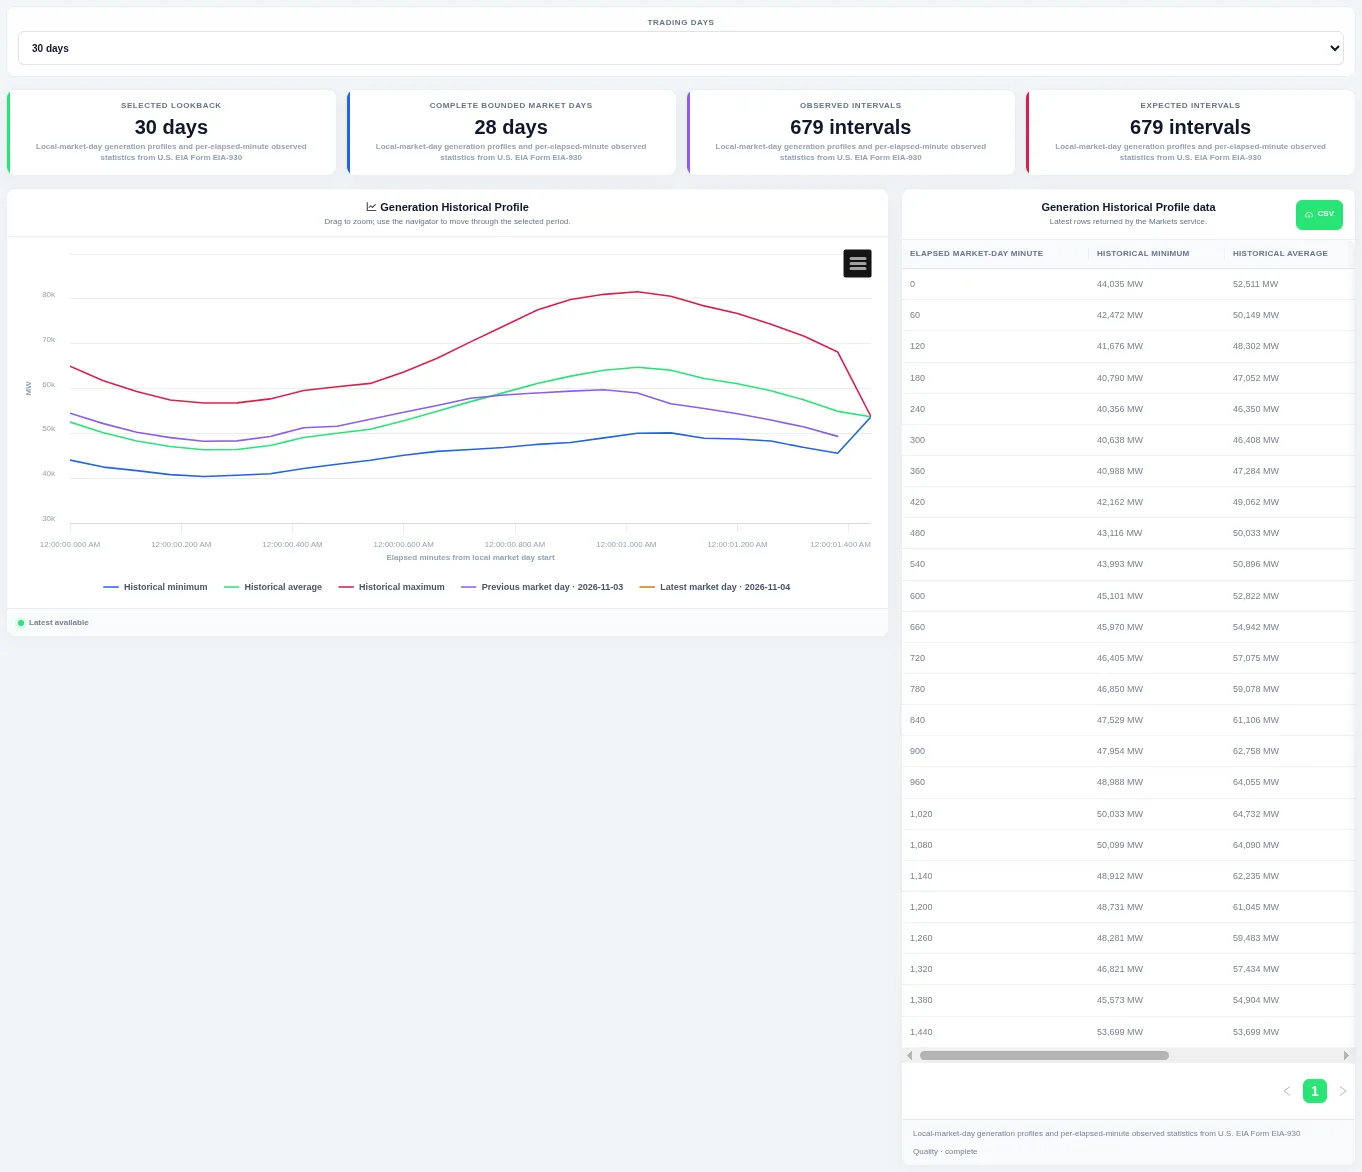
The previous and latest trading days are drawn on top so you can see whether today is unusual. Choose how many trading days to compare at the top; the table beside the chart lists the rows behind it and can be downloaded as CSV.
Shown for ERCOT. Available in: ERCOT, CAISO, PJM, MISO, NYISO, ISO-NE, SPP, Germany, New Zealand, AESO (Alberta), Ireland (SEM).
Generation Distribution
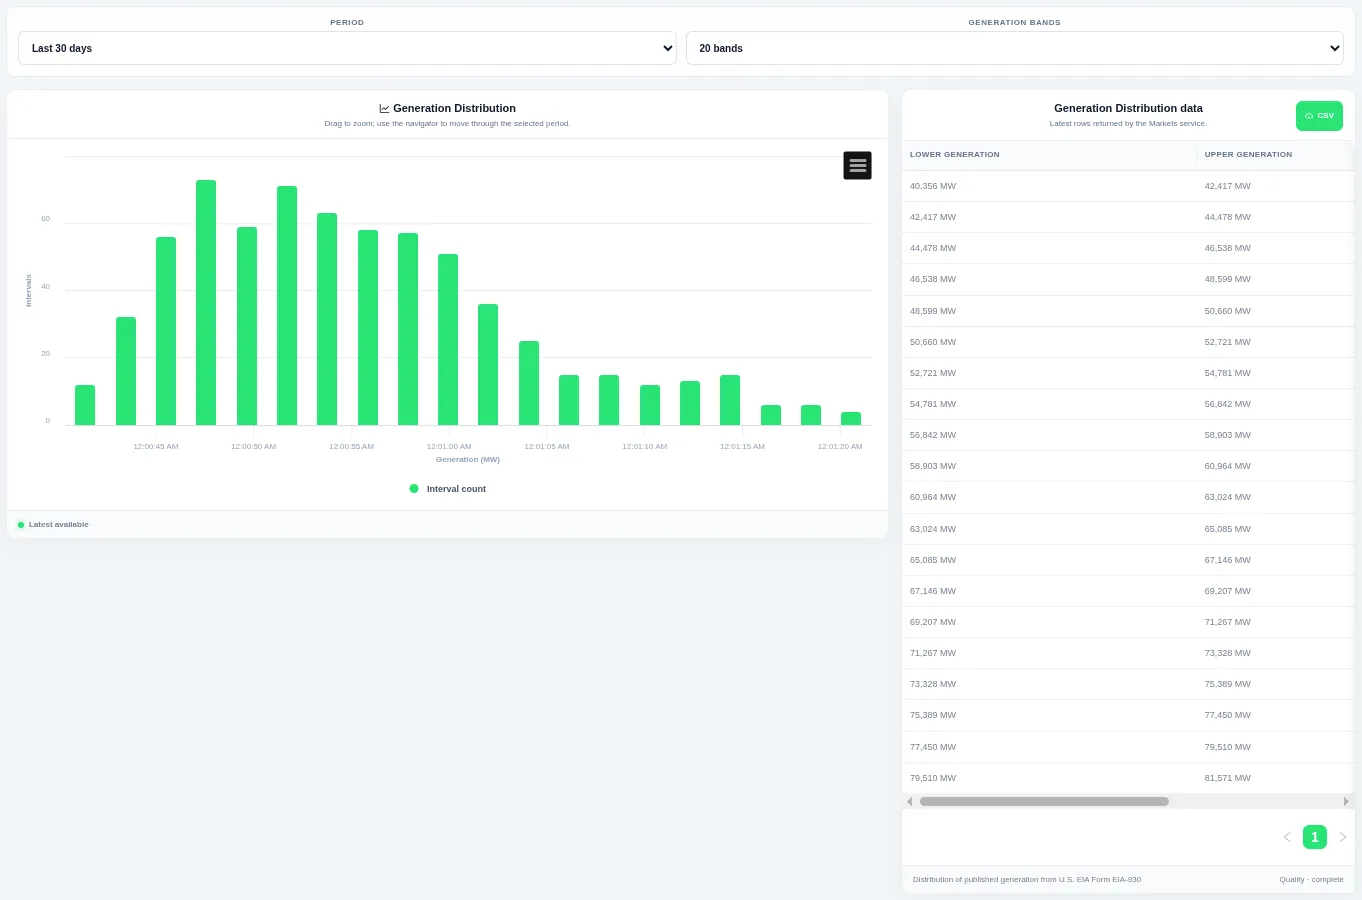
Taller bars show the levels that occur most often over the chosen period. Choose the period and the number of bands at the top; the table beside the chart lists the rows behind it and can be downloaded as CSV.
Shown for ERCOT. Available in: ERCOT, CAISO, PJM, MISO, NYISO, ISO-NE, SPP, Germany, New Zealand, AESO (Alberta), Ireland (SEM).
Generation Duration Curve
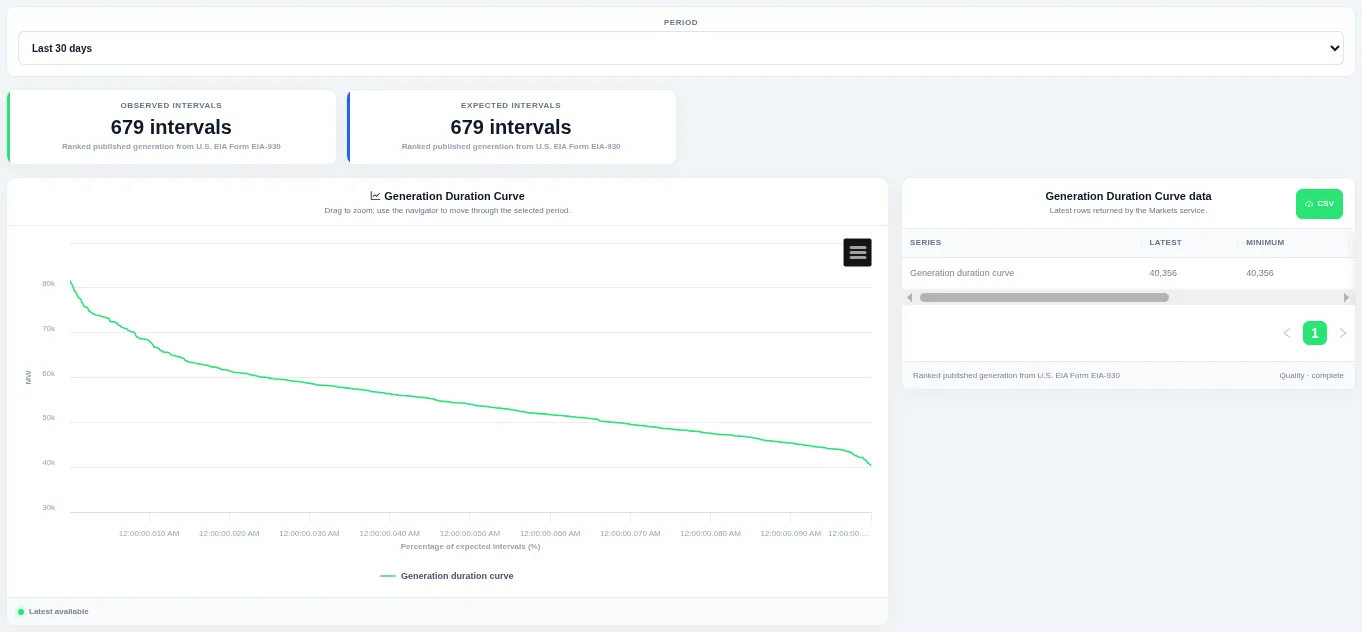
The curve shows how much of the time a level was met or exceeded. Choose the period at the top; the table beside the chart lists the rows behind it and can be downloaded as CSV.
Shown for ERCOT. Available in: ERCOT, CAISO, PJM, MISO, NYISO, ISO-NE, SPP, Germany, New Zealand, AESO (Alberta), Ireland (SEM).
Generation Interval Change
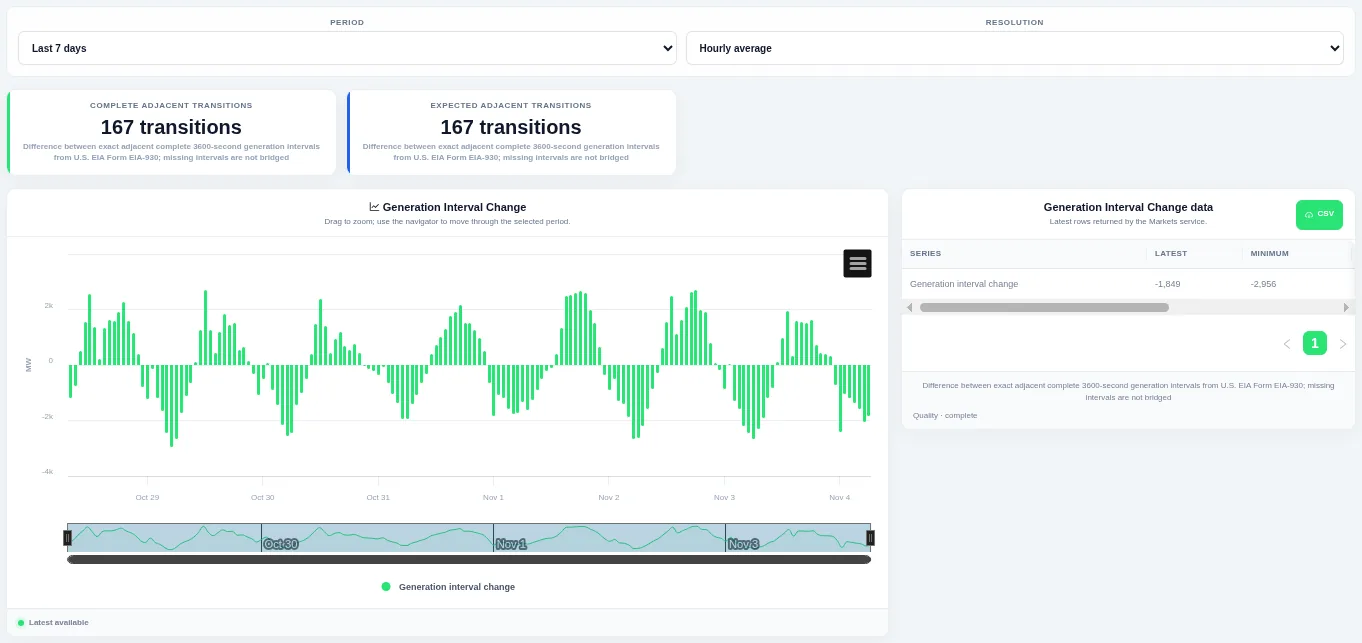
Bars above zero are rises and bars below zero are falls, so ramps stand out. Choose the period and the resolution at the top; the table beside the chart lists the rows behind it and can be downloaded as CSV.
Shown for ERCOT. Available in: ERCOT, CAISO, PJM, MISO, NYISO, ISO-NE, SPP, Germany, New Zealand, AESO (Alberta), Ireland (SEM).
Generation Change Distribution
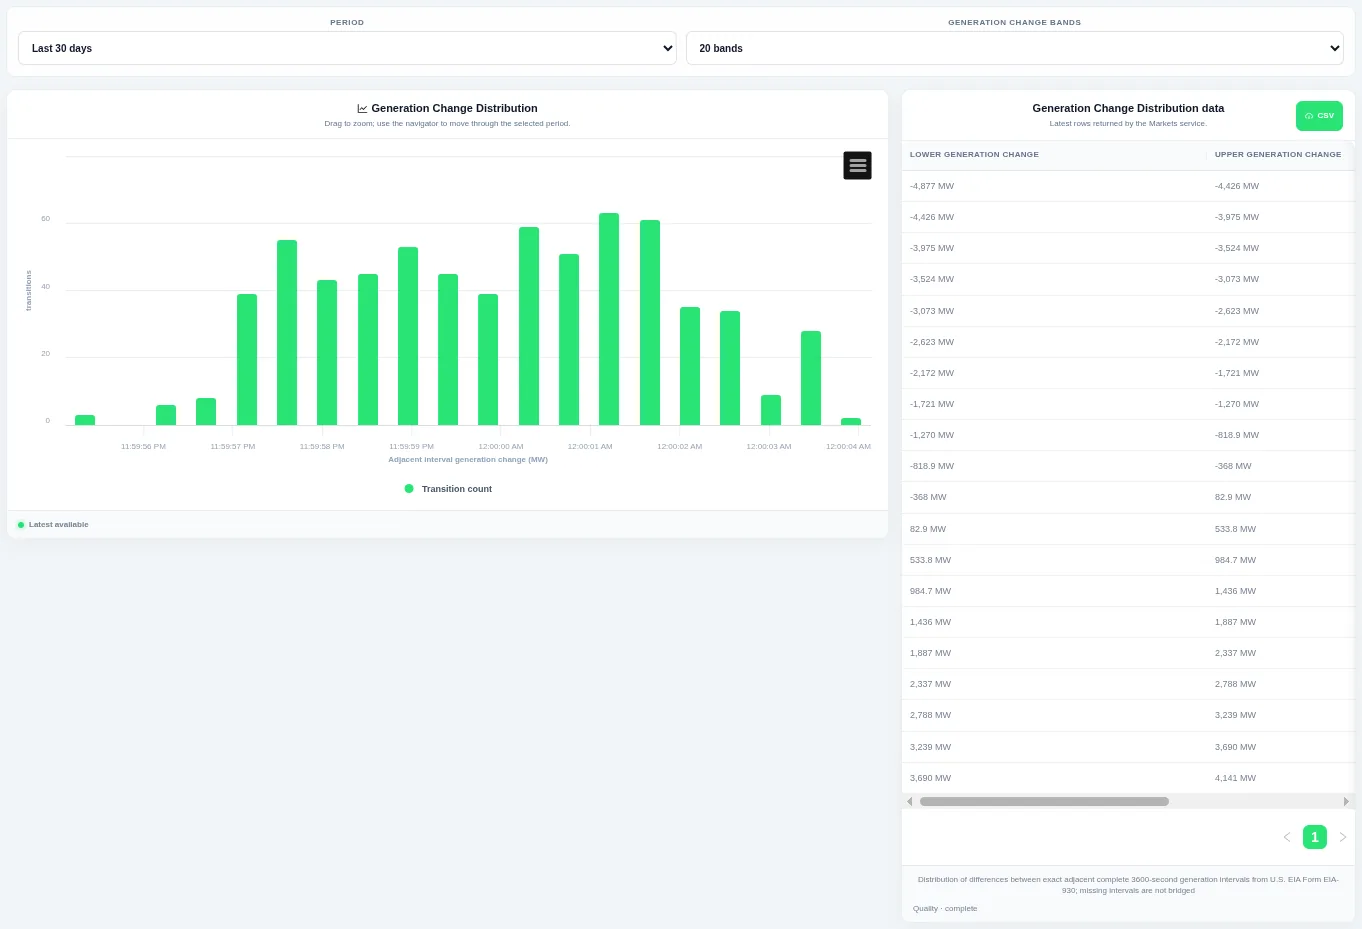
Taller bars show the size of change that happens most often, and the tails show rare large steps. Choose the period and the number of bands at the top; the table beside the chart lists the rows behind it and can be downloaded as CSV.
Shown for ERCOT. Available in: ERCOT, CAISO, PJM, MISO, NYISO, ISO-NE, SPP, Germany, New Zealand, AESO (Alberta), Ireland (SEM).
Generation Change Duration Curve
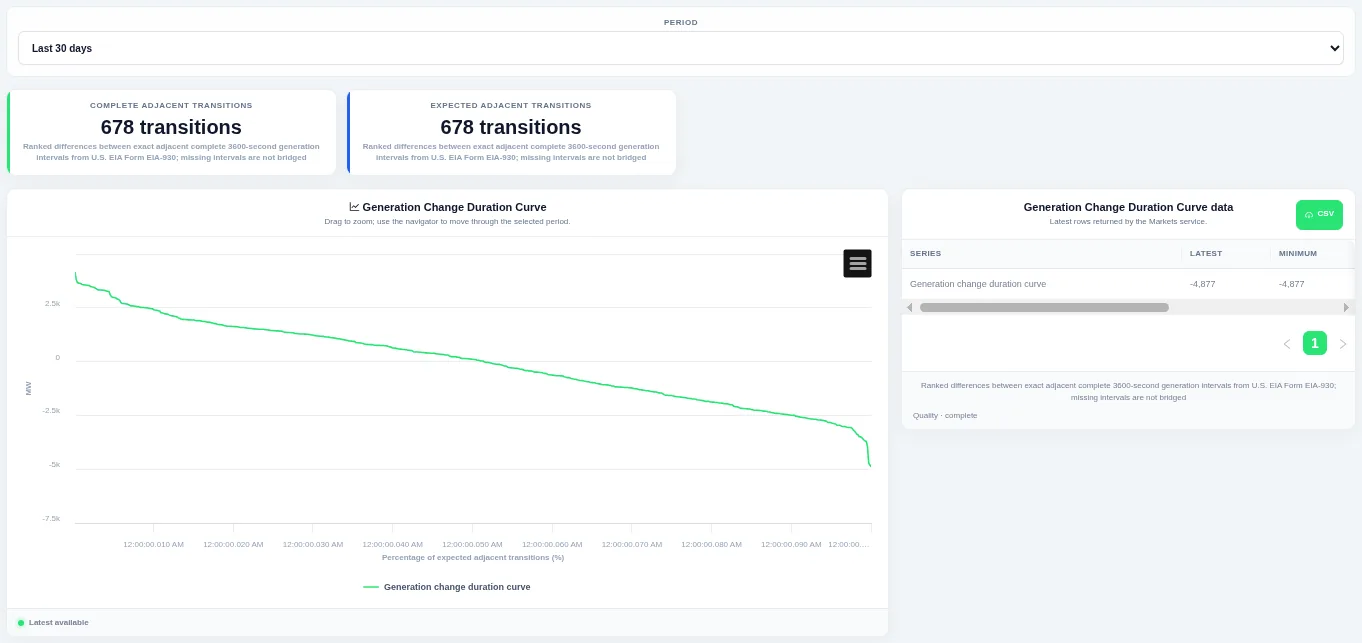
The steep ends of the curve show how often large ramps happen. Choose the period at the top; the table beside the chart lists the rows behind it and can be downloaded as CSV.
Shown for ERCOT. Available in: ERCOT, CAISO, PJM, MISO, NYISO, ISO-NE, SPP, Germany, New Zealand, AESO (Alberta), Ireland (SEM).
Generation Mix over Time
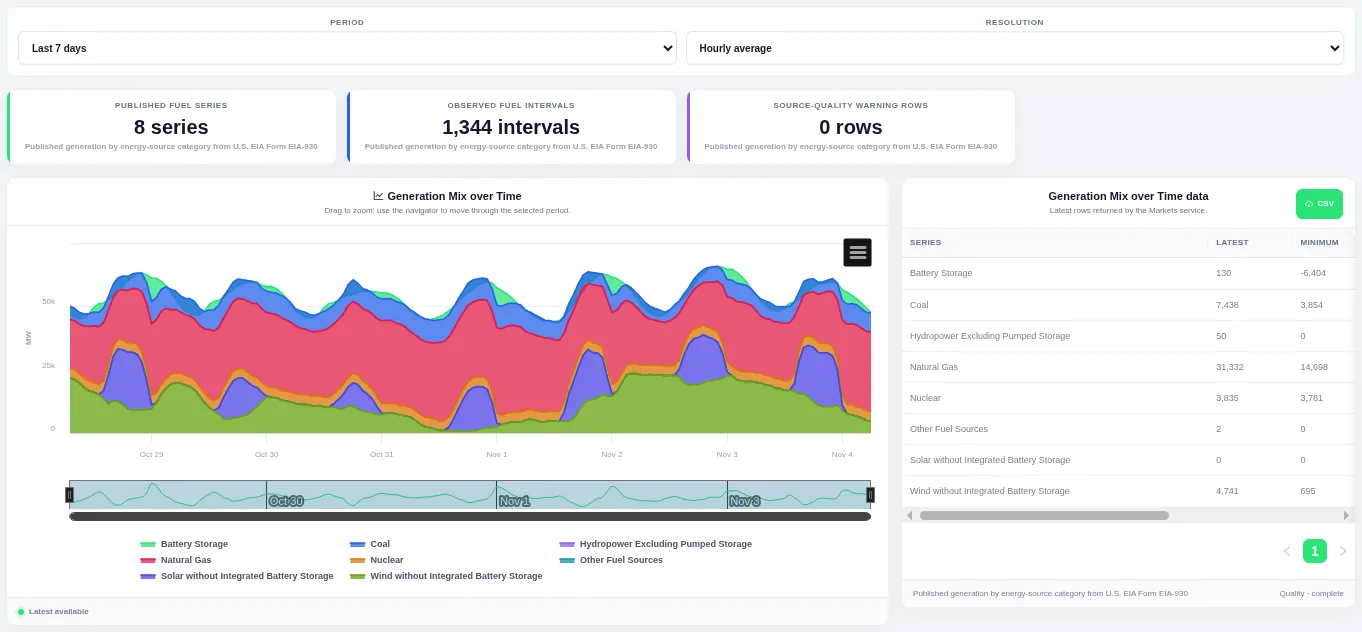
Drag on the chart or the navigator to zoom into part of the period. Choose the period and the resolution at the top; the table beside the chart lists the rows behind it and can be downloaded as CSV.
Shown for ERCOT. Available in: ERCOT, CAISO, PJM, MISO, NYISO, ISO-NE, SPP, Great Britain, Germany, IESO (Ontario), AESO (Alberta).
Generation Mix Historical Profile
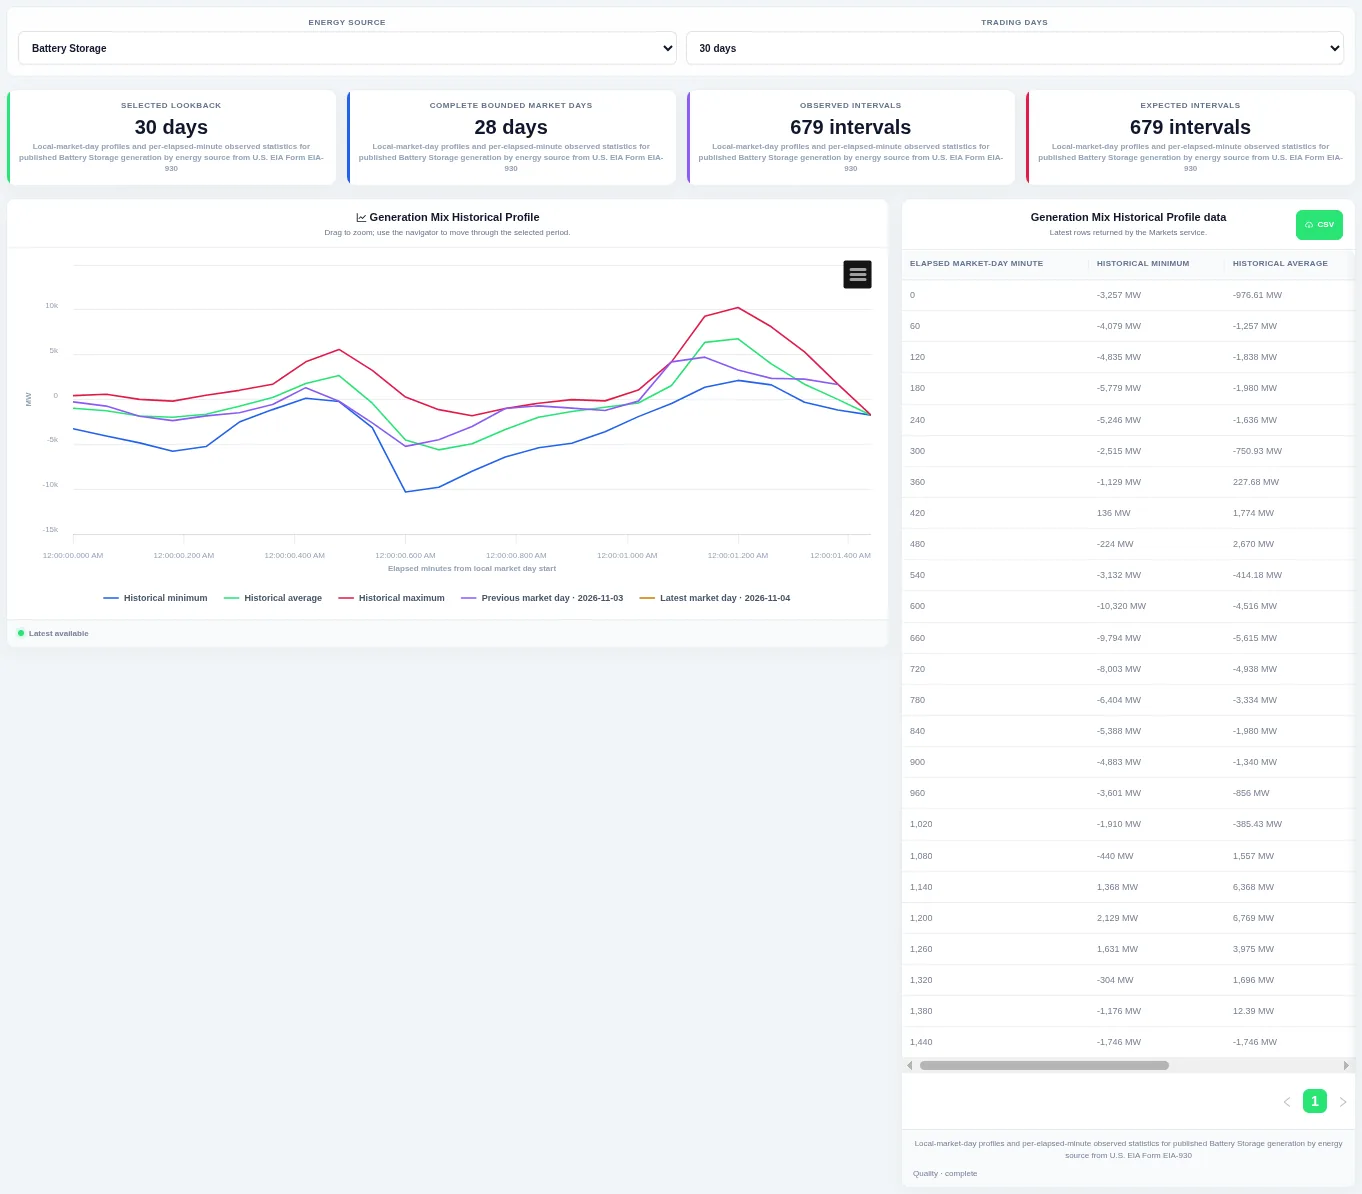
The previous and latest trading days are drawn on top so you can see whether today is unusual. Choose the energy source and how many trading days to compare at the top; the table beside the chart lists the rows behind it and can be downloaded as CSV.
Shown for ERCOT. Available in: ERCOT, CAISO, PJM, MISO, NYISO, ISO-NE, SPP, Great Britain, Germany, IESO (Ontario), AESO (Alberta).
Latest Generation Mix
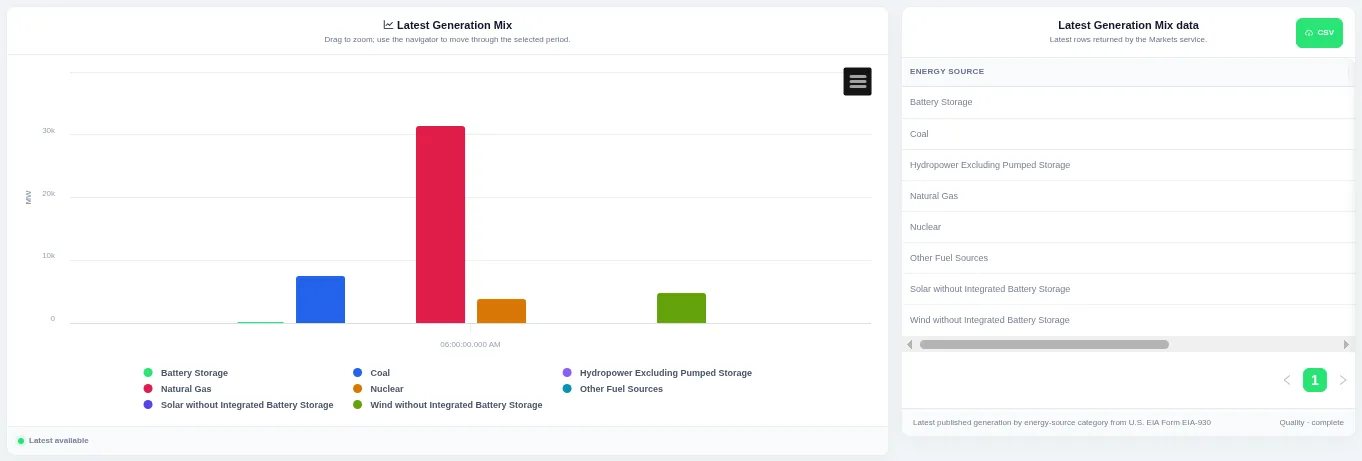
Each bar is one series for the most recent interval. The view always shows the latest published interval, and the table beside the chart lists the rows behind it with a CSV download.
Shown for ERCOT. Available in: ERCOT, CAISO, PJM, MISO, NYISO, ISO-NE, SPP, Great Britain, Germany, IESO (Ontario), AESO (Alberta).
Generation Mix Duration Curves
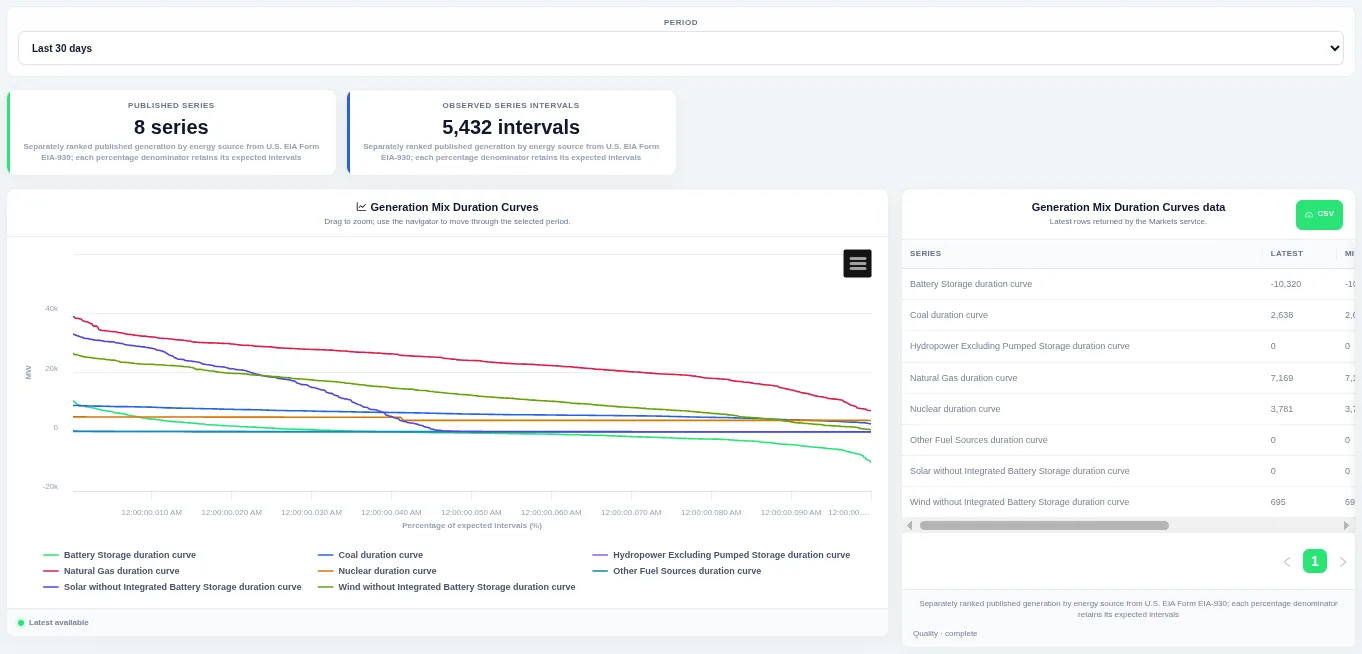
The curve shows how much of the time a level was met or exceeded. Choose the period at the top; the table beside the chart lists the rows behind it and can be downloaded as CSV.
Shown for ERCOT. Available in: ERCOT, CAISO, PJM, MISO, NYISO, ISO-NE, SPP, Great Britain, Germany, IESO (Ontario), AESO (Alberta).
Generation Mix Interval Change
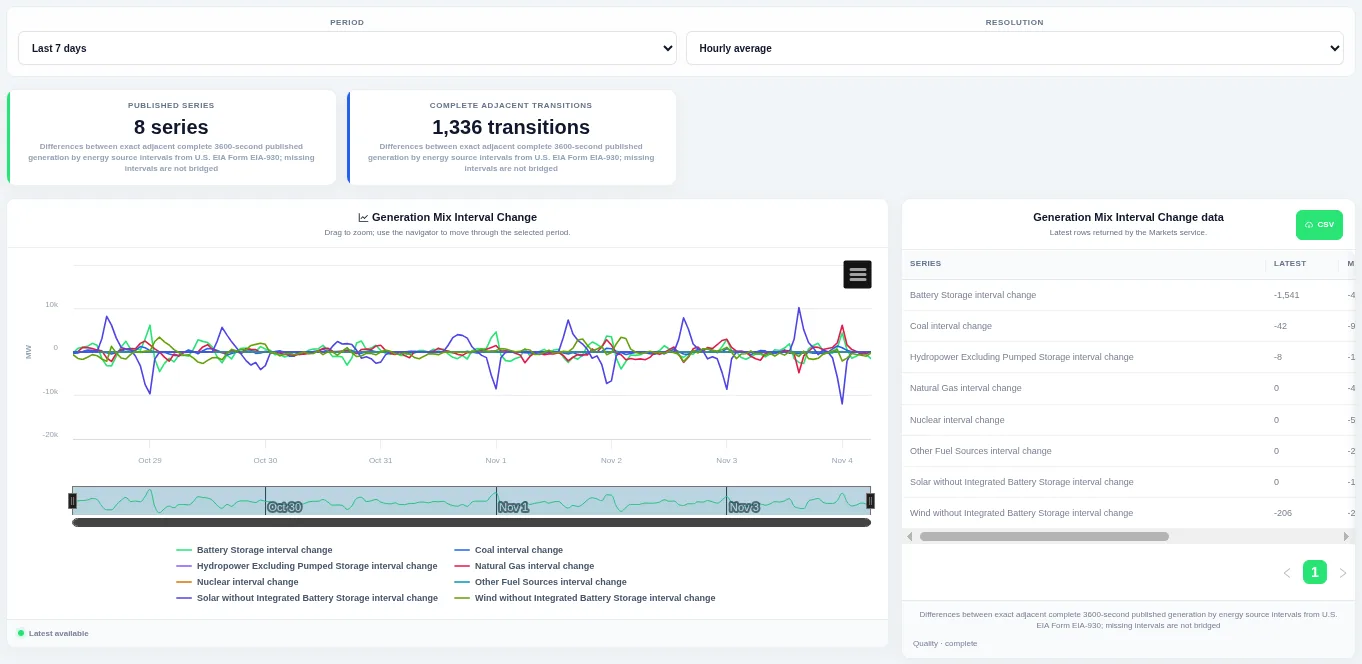
Bars above zero are rises and bars below zero are falls, so ramps stand out. Choose the period and the resolution at the top; the table beside the chart lists the rows behind it and can be downloaded as CSV.
Shown for ERCOT. Available in: ERCOT, CAISO, PJM, MISO, NYISO, ISO-NE, SPP, Great Britain, Germany, IESO (Ontario), AESO (Alberta).
Generation Mix Change Duration Curves
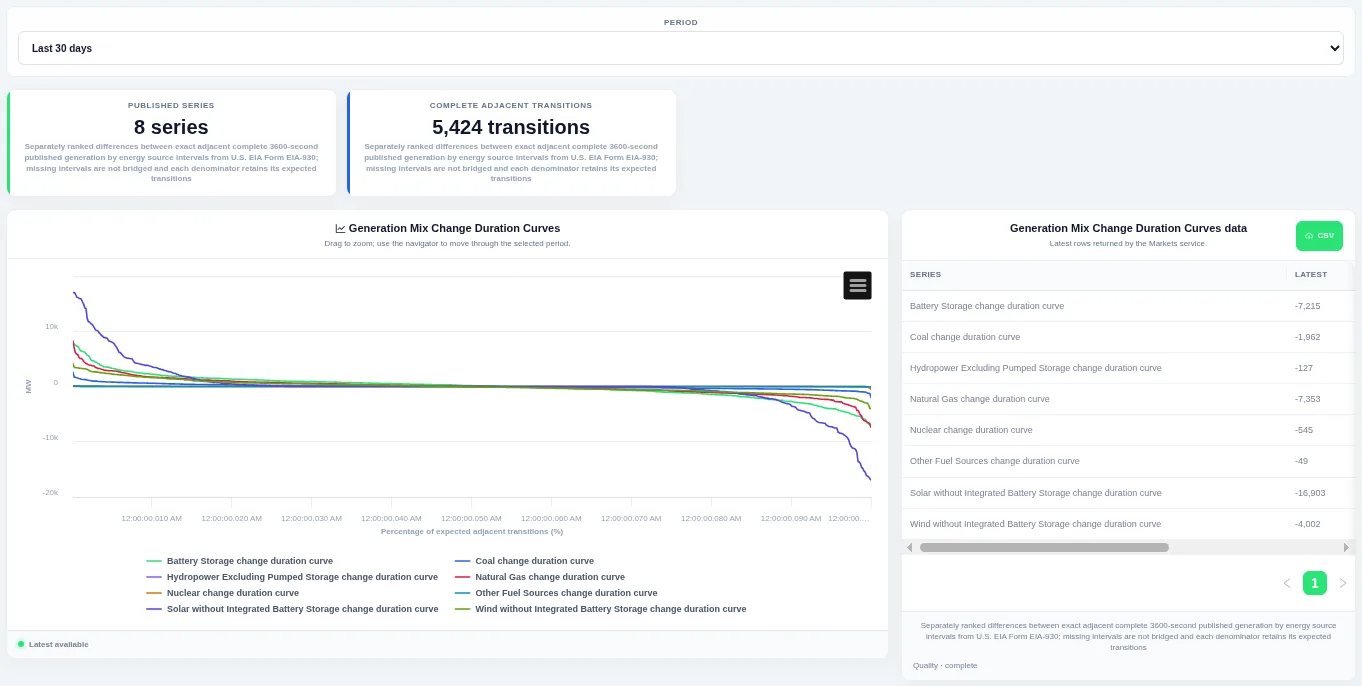
The steep ends of the curve show how often large ramps happen. Choose the period at the top; the table beside the chart lists the rows behind it and can be downloaded as CSV.
Shown for ERCOT. Available in: ERCOT, CAISO, PJM, MISO, NYISO, ISO-NE, SPP, Great Britain, Germany, IESO (Ontario), AESO (Alberta).
Latest Generation Mix Changes
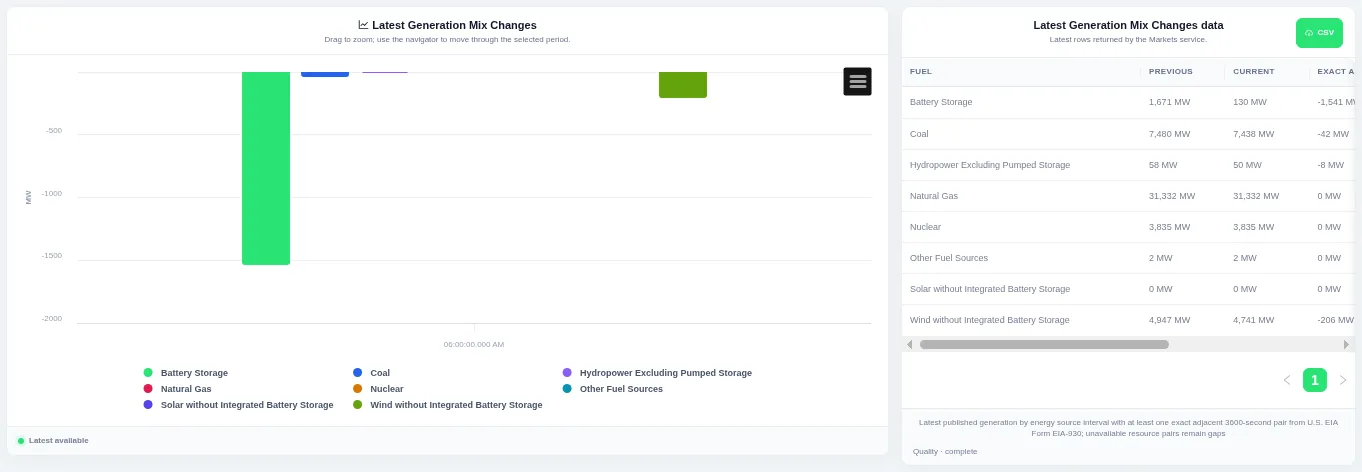
Each bar is one series, above zero for a rise and below zero for a fall. The view always shows the latest published interval, and the table beside the chart lists the rows behind it with a CSV download.
Shown for ERCOT. Available in: ERCOT, CAISO, PJM, MISO, NYISO, ISO-NE, SPP, Great Britain, Germany, IESO (Ontario), AESO (Alberta).
Demand–Generation Scatter
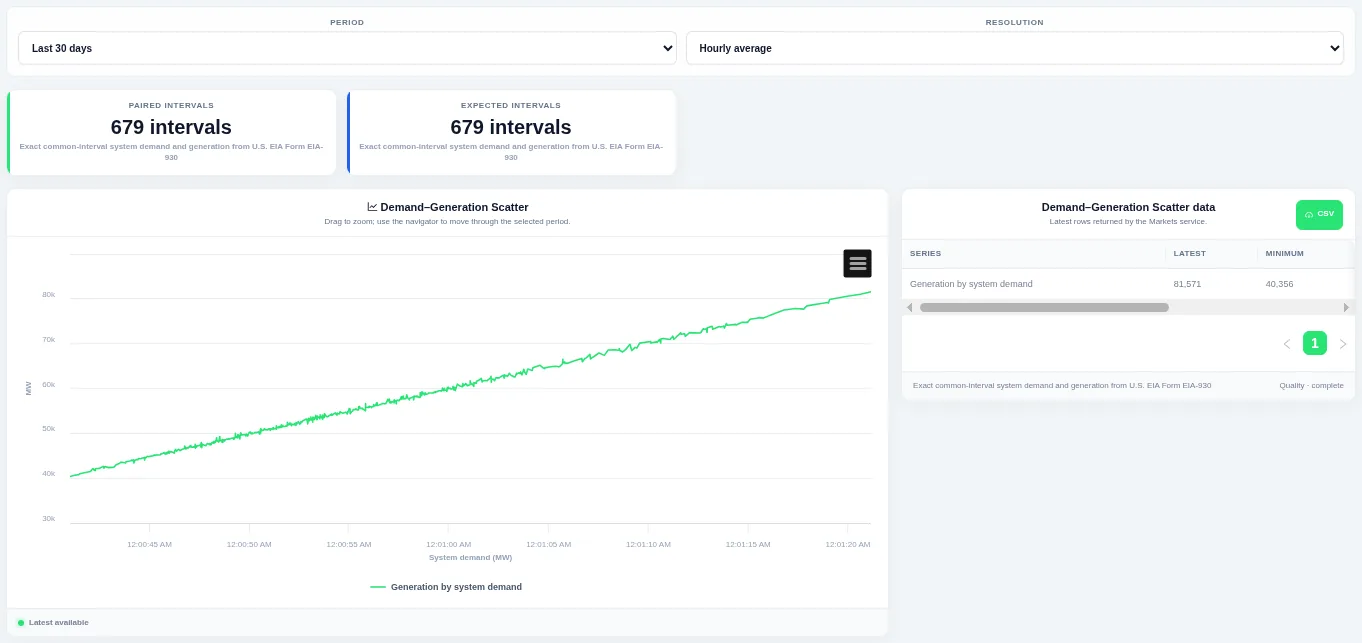
The shape of the point cloud shows how closely the two move together. Choose the period and the resolution at the top; the table beside the chart lists the rows behind it and can be downloaded as CSV.
Shown for ERCOT. Available in: ERCOT, CAISO, PJM, MISO, NYISO, ISO-NE, SPP, Germany, New Zealand, AESO (Alberta), Ireland (SEM).
Interchange
Total Interchange
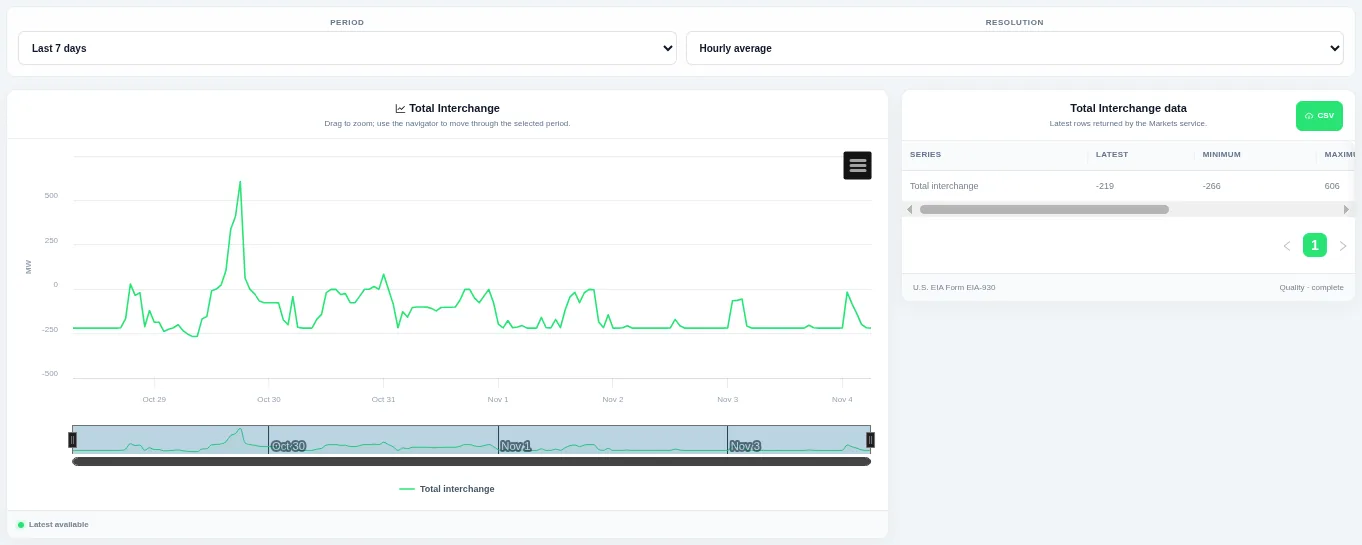
Drag on the chart or the navigator to zoom into part of the period. Choose the period and the resolution at the top; the table beside the chart lists the rows behind it and can be downloaded as CSV.
Shown for ERCOT. Available in: ERCOT, CAISO, PJM, MISO, NYISO, ISO-NE, SPP, Germany, IESO (Ontario).
Daily Interchange Profiles
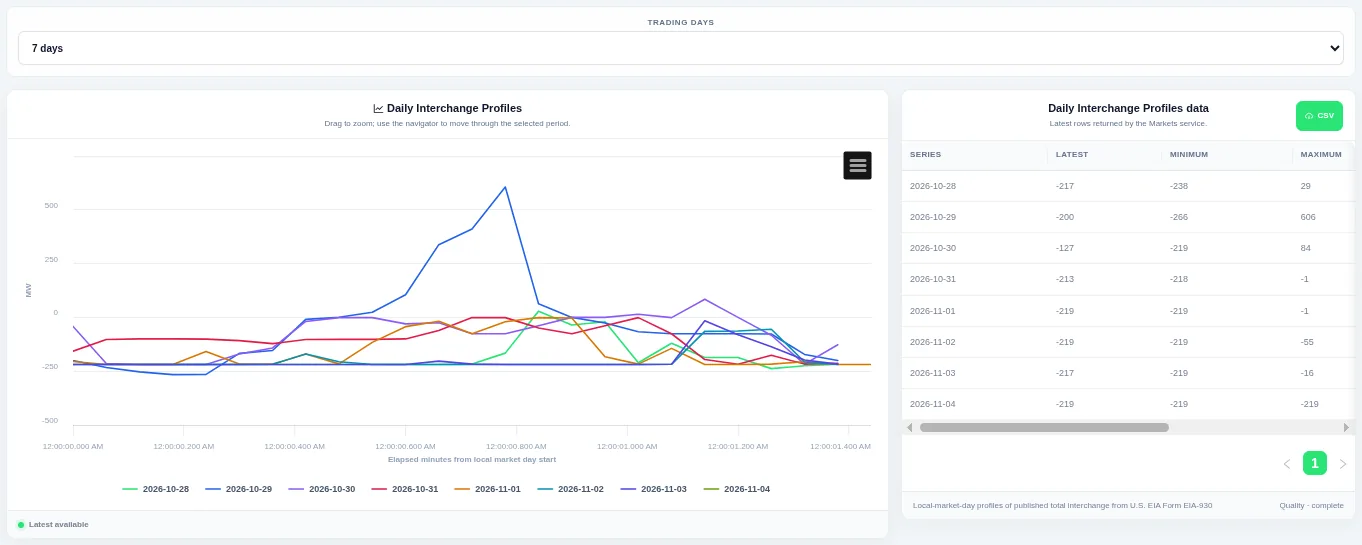
Each line is one trading day, so you can compare the daily shape. Choose how many trading days to compare at the top; the table beside the chart lists the rows behind it and can be downloaded as CSV.
Shown for ERCOT. Available in: ERCOT, CAISO, PJM, MISO, NYISO, ISO-NE, SPP, Germany, IESO (Ontario).
Interchange Historical Profile
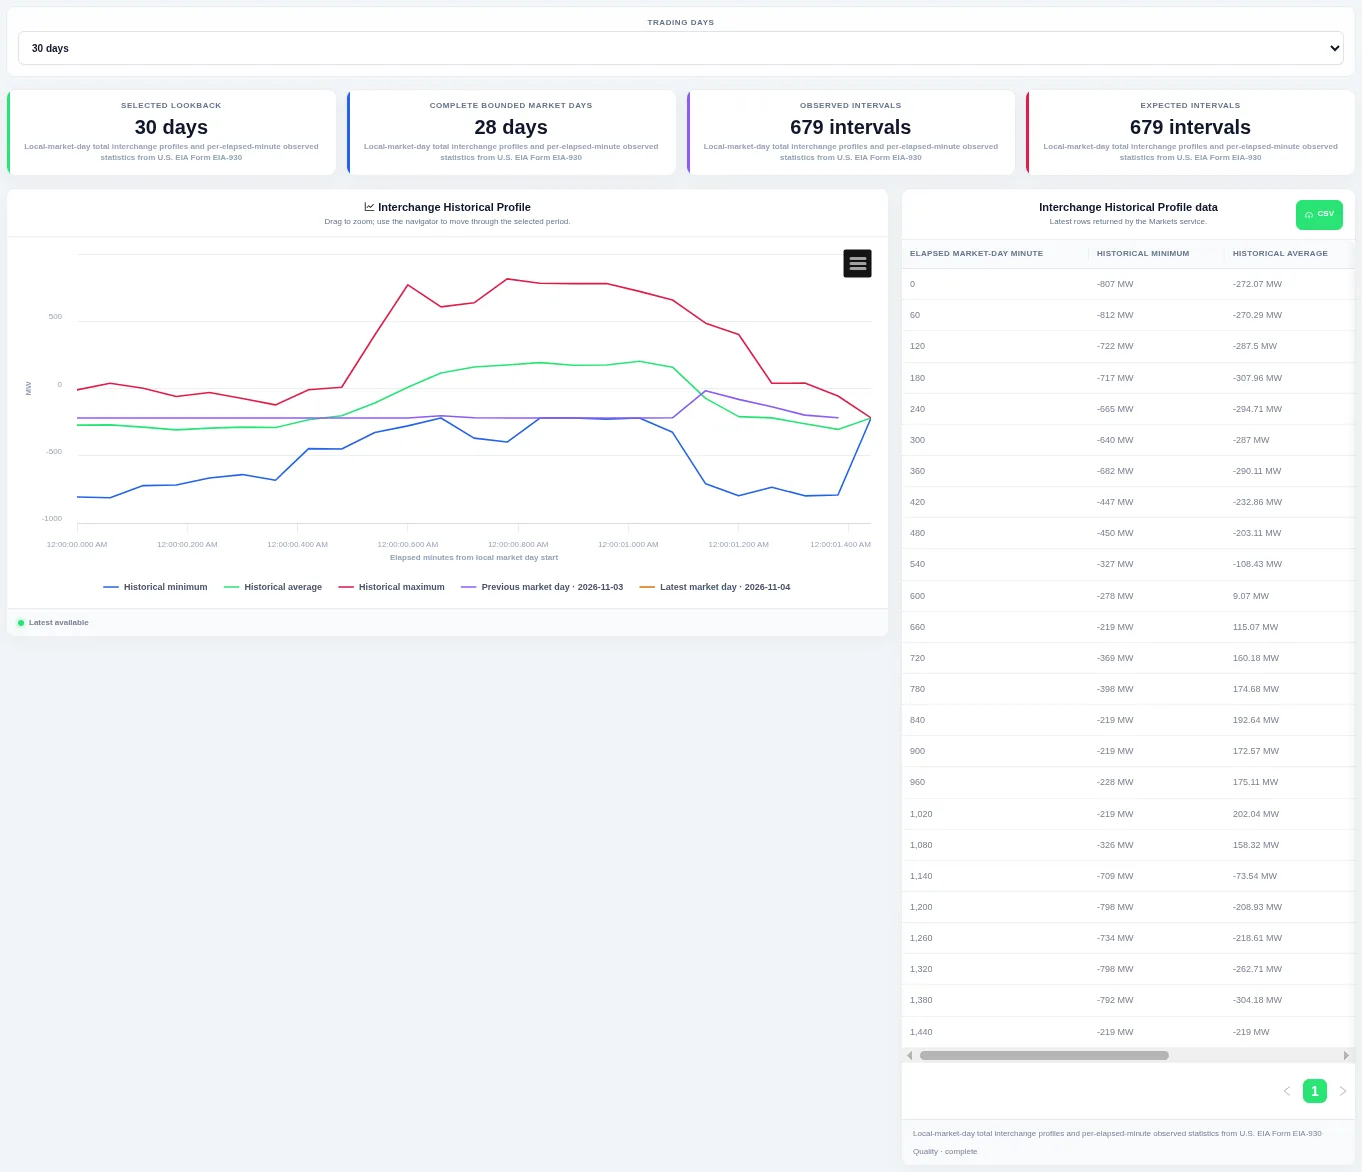
The previous and latest trading days are drawn on top so you can see whether today is unusual. Choose how many trading days to compare at the top; the table beside the chart lists the rows behind it and can be downloaded as CSV.
Shown for ERCOT. Available in: ERCOT, CAISO, PJM, MISO, NYISO, ISO-NE, SPP, Germany, IESO (Ontario).
Interchange Distribution
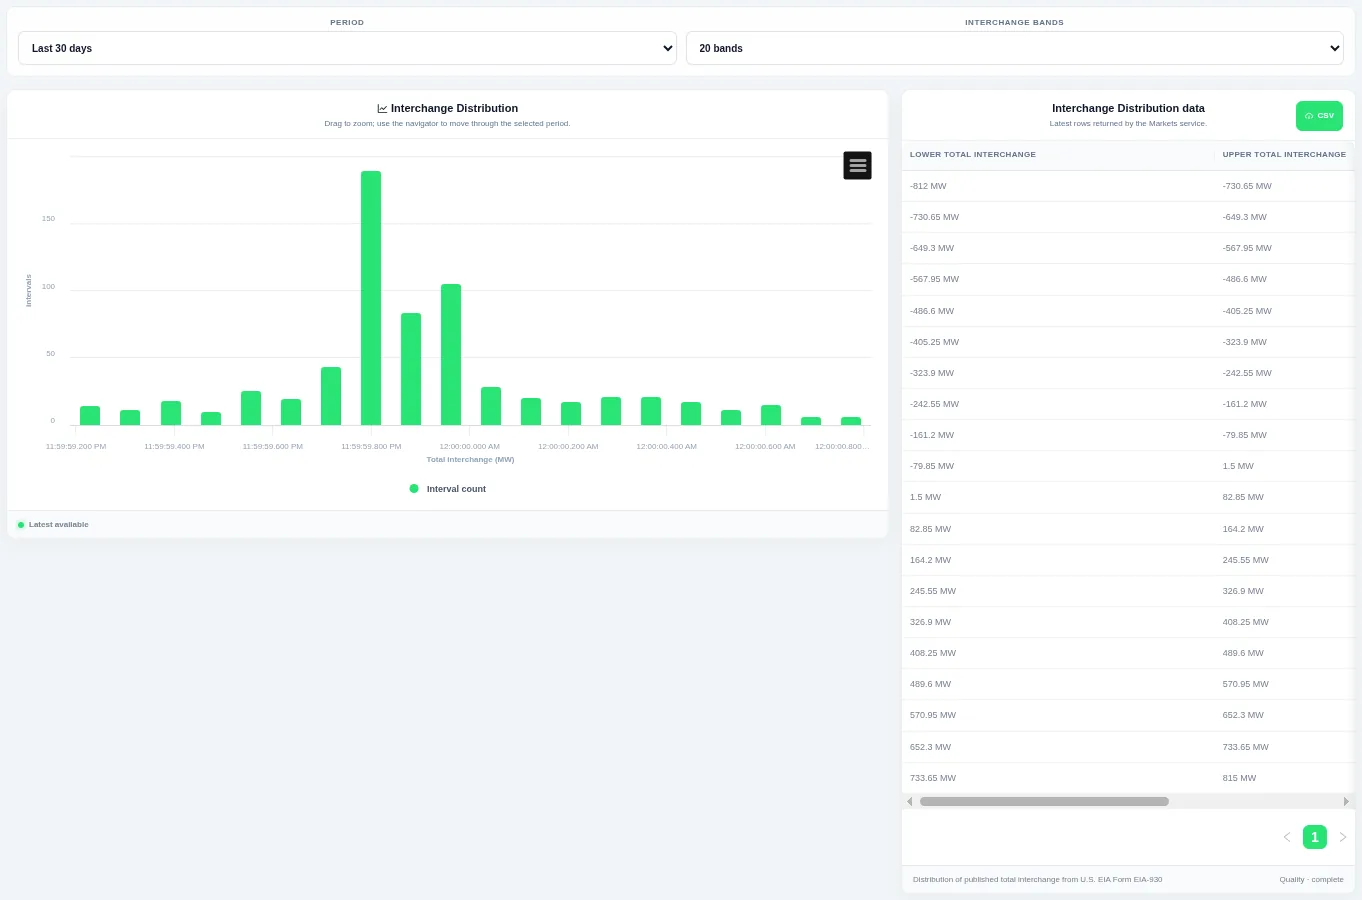
Taller bars show the levels that occur most often over the chosen period. Choose the period and the number of bands at the top; the table beside the chart lists the rows behind it and can be downloaded as CSV.
Shown for ERCOT. Available in: ERCOT, CAISO, PJM, MISO, NYISO, ISO-NE, SPP, Germany, IESO (Ontario).
Interchange Duration Curve
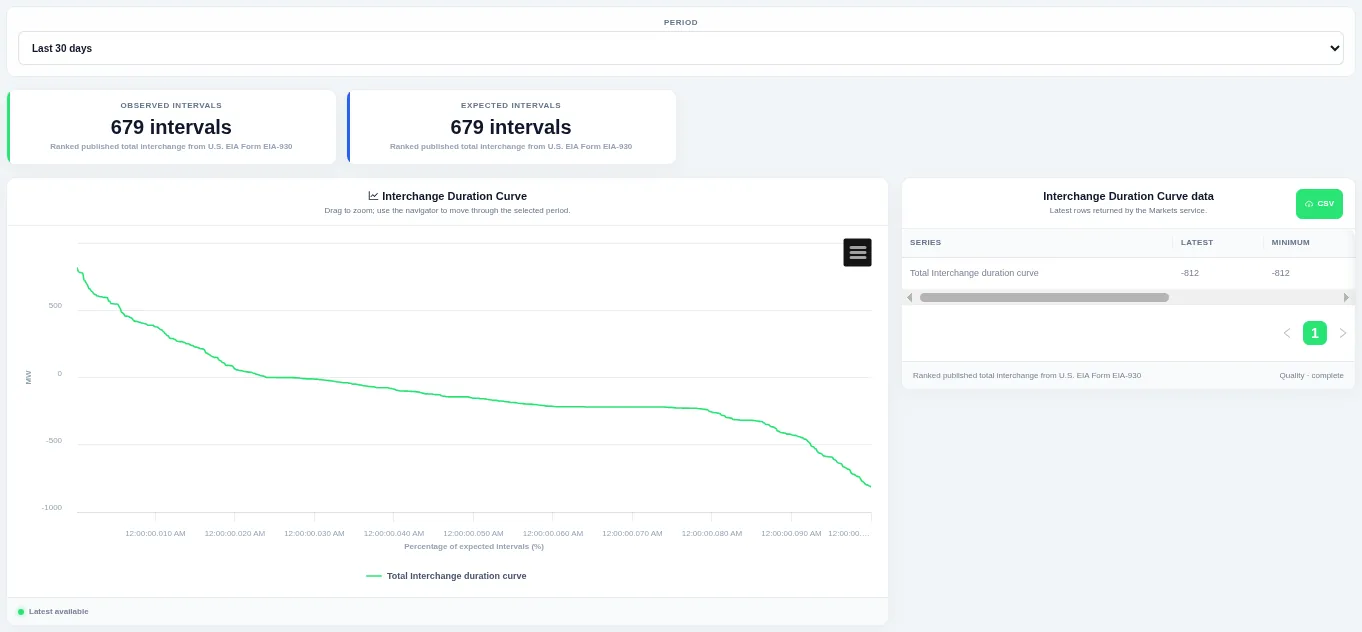
The curve shows how much of the time a level was met or exceeded. Choose the period at the top; the table beside the chart lists the rows behind it and can be downloaded as CSV.
Shown for ERCOT. Available in: ERCOT, CAISO, PJM, MISO, NYISO, ISO-NE, SPP, Germany, IESO (Ontario).
Interchange Interval Change
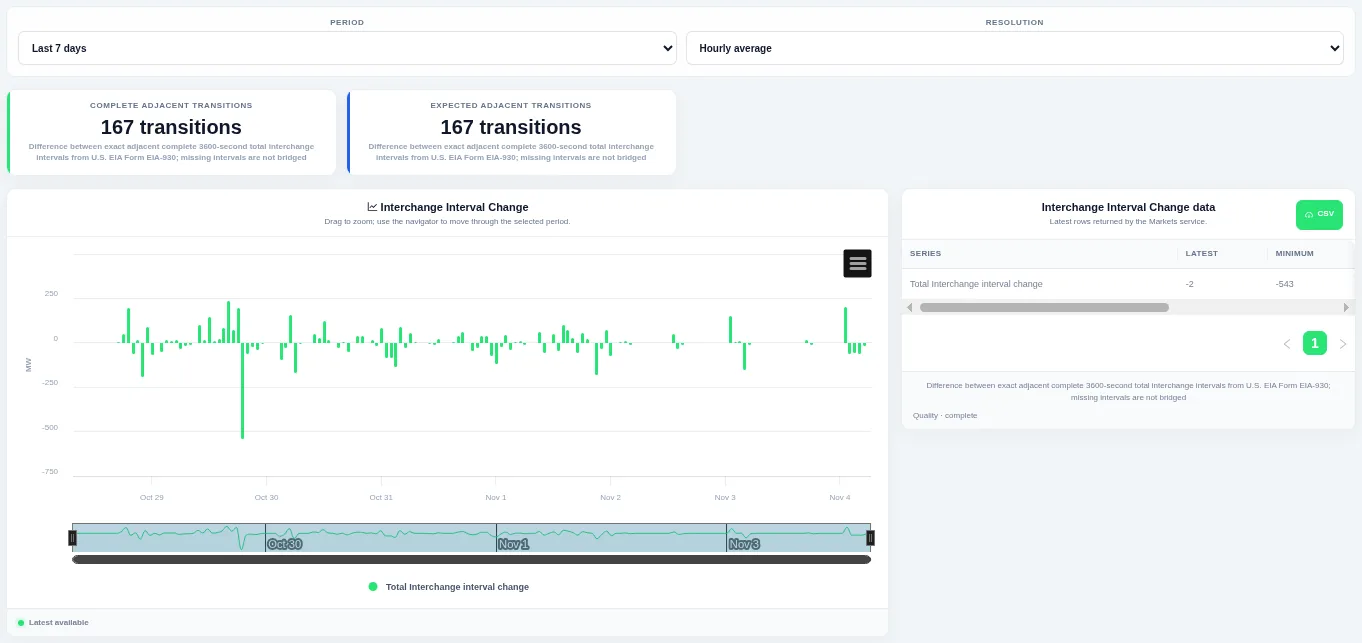
Bars above zero are rises and bars below zero are falls, so ramps stand out. Choose the period and the resolution at the top; the table beside the chart lists the rows behind it and can be downloaded as CSV.
Shown for ERCOT. Available in: ERCOT, CAISO, PJM, MISO, NYISO, ISO-NE, SPP, Germany, IESO (Ontario).
Interchange Change Distribution
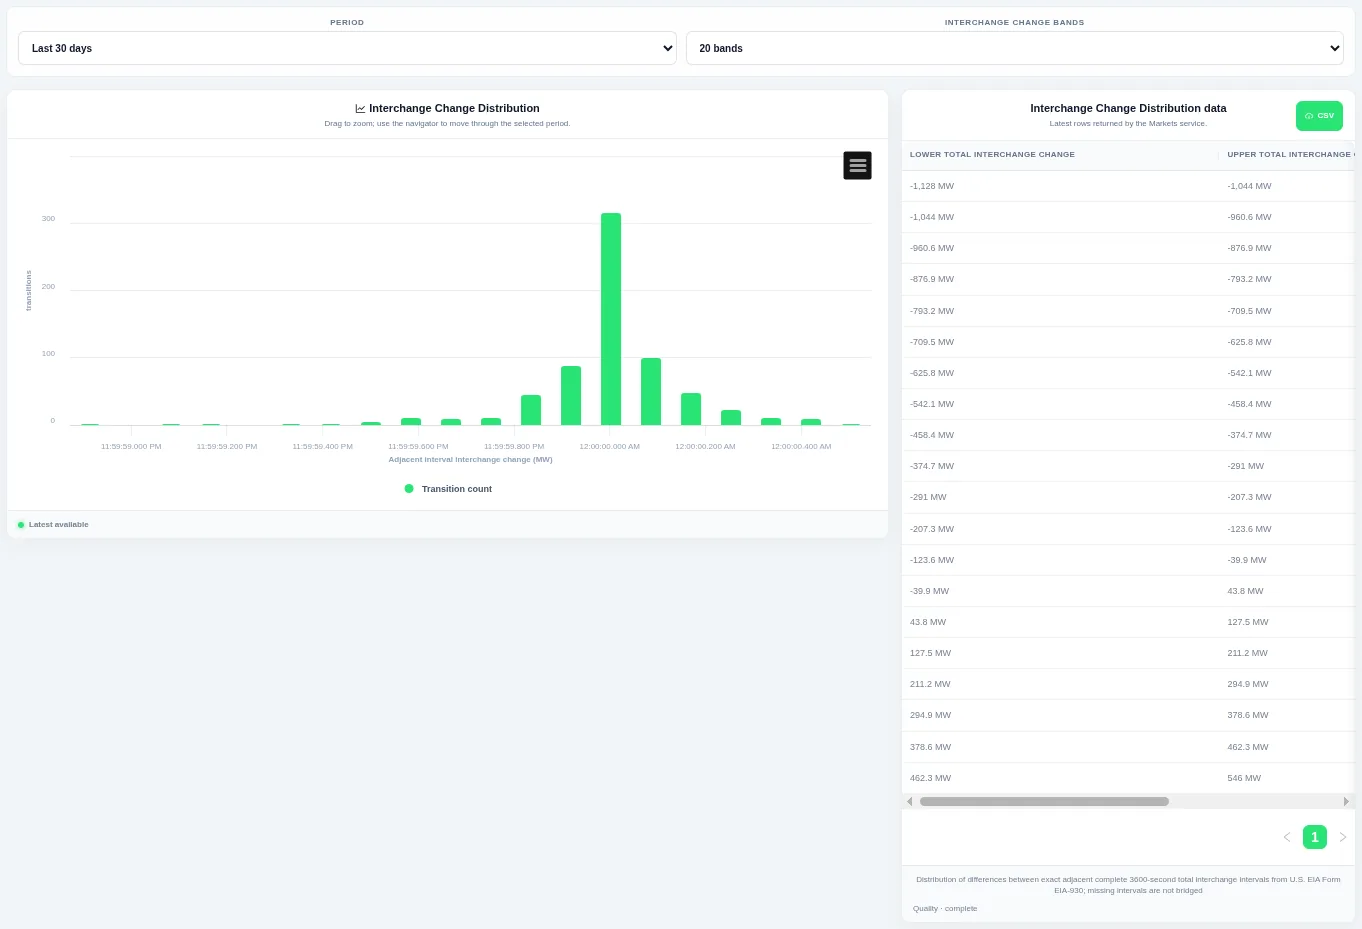
Taller bars show the size of change that happens most often, and the tails show rare large steps. Choose the period and the number of bands at the top; the table beside the chart lists the rows behind it and can be downloaded as CSV.
Shown for ERCOT. Available in: ERCOT, CAISO, PJM, MISO, NYISO, ISO-NE, SPP, Germany, IESO (Ontario).
Interchange Change Duration Curve
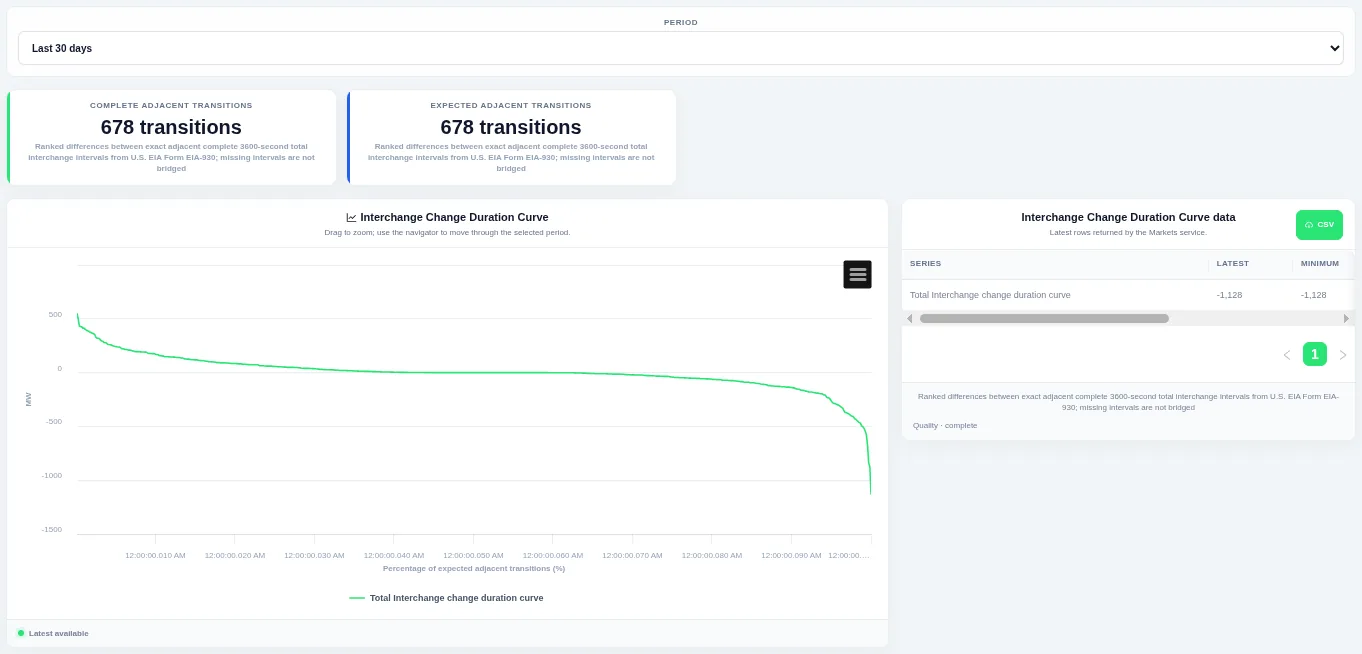
The steep ends of the curve show how often large ramps happen. Choose the period at the top; the table beside the chart lists the rows behind it and can be downloaded as CSV.
Shown for ERCOT. Available in: ERCOT, CAISO, PJM, MISO, NYISO, ISO-NE, SPP, Germany, IESO (Ontario).
Named Interchange Flows
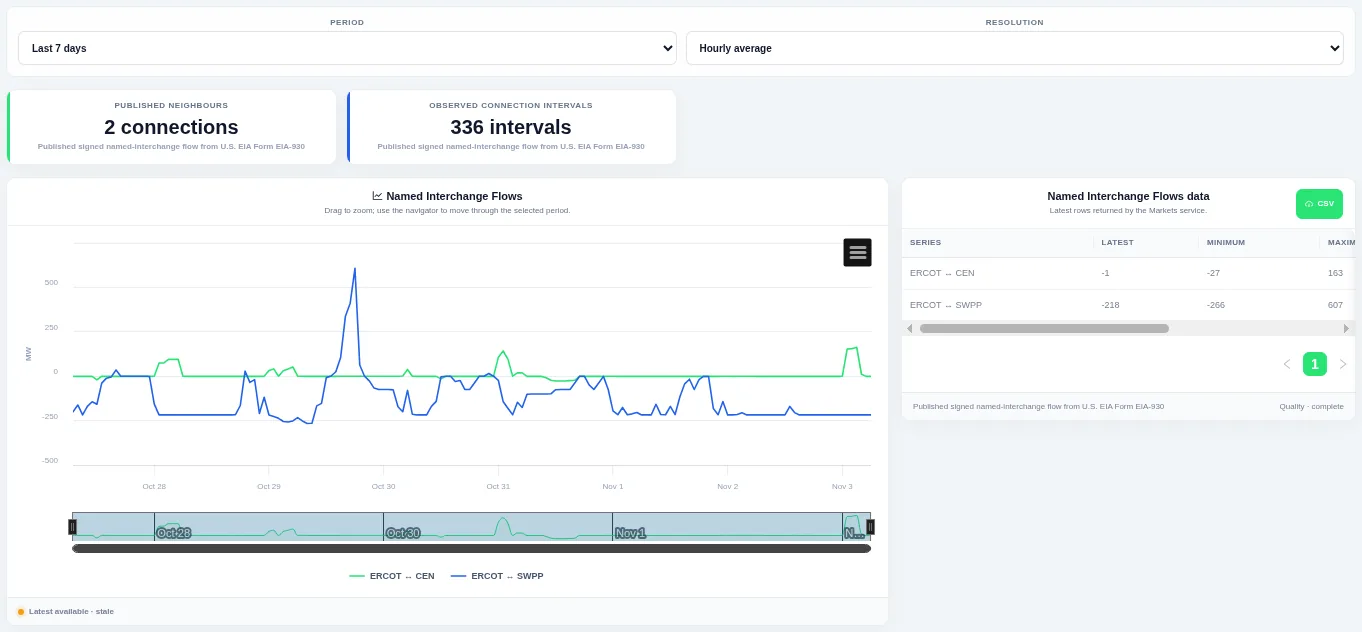
Drag on the chart or the navigator to zoom into part of the period. Choose the period and the resolution at the top; the table beside the chart lists the rows behind it and can be downloaded as CSV.
Shown for ERCOT. Available in: ERCOT, CAISO, PJM, MISO, NYISO, ISO-NE, SPP, Great Britain, Germany, New Zealand, IESO (Ontario).
Named Interchange Historical Profile
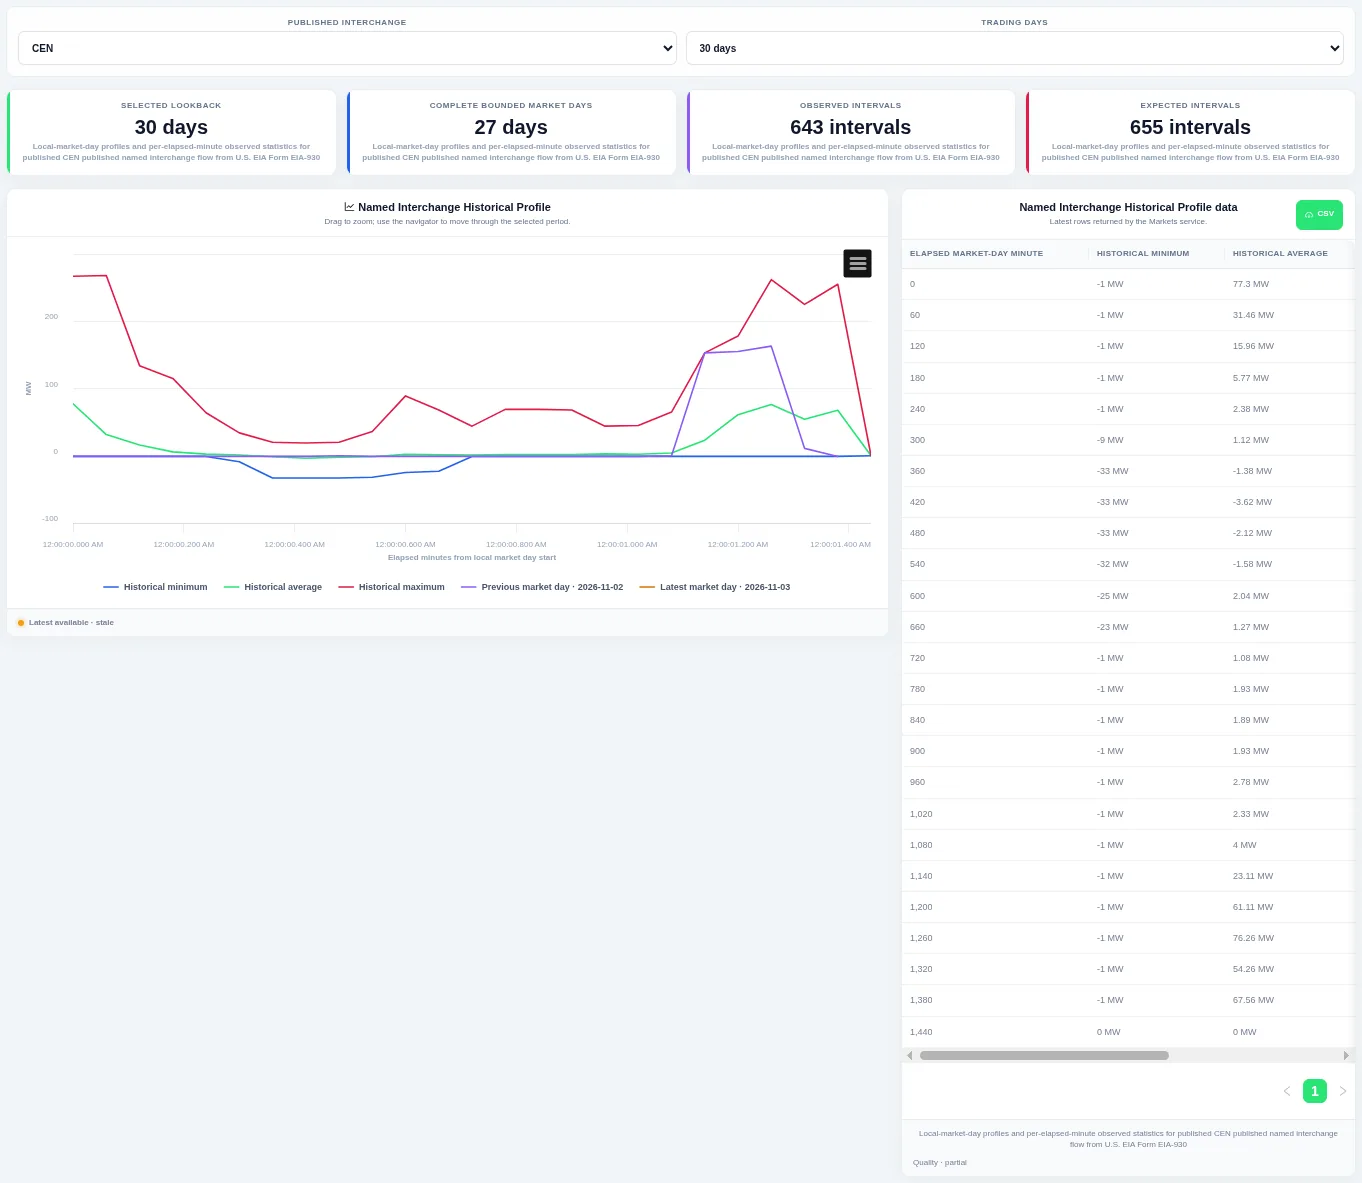
The previous and latest trading days are drawn on top so you can see whether today is unusual. Choose the published interchange and how many trading days to compare at the top; the table beside the chart lists the rows behind it and can be downloaded as CSV.
Shown for ERCOT. Available in: ERCOT, CAISO, PJM, MISO, NYISO, ISO-NE, SPP, Great Britain, Germany, New Zealand, IESO (Ontario).
Named Interchange Duration Curves
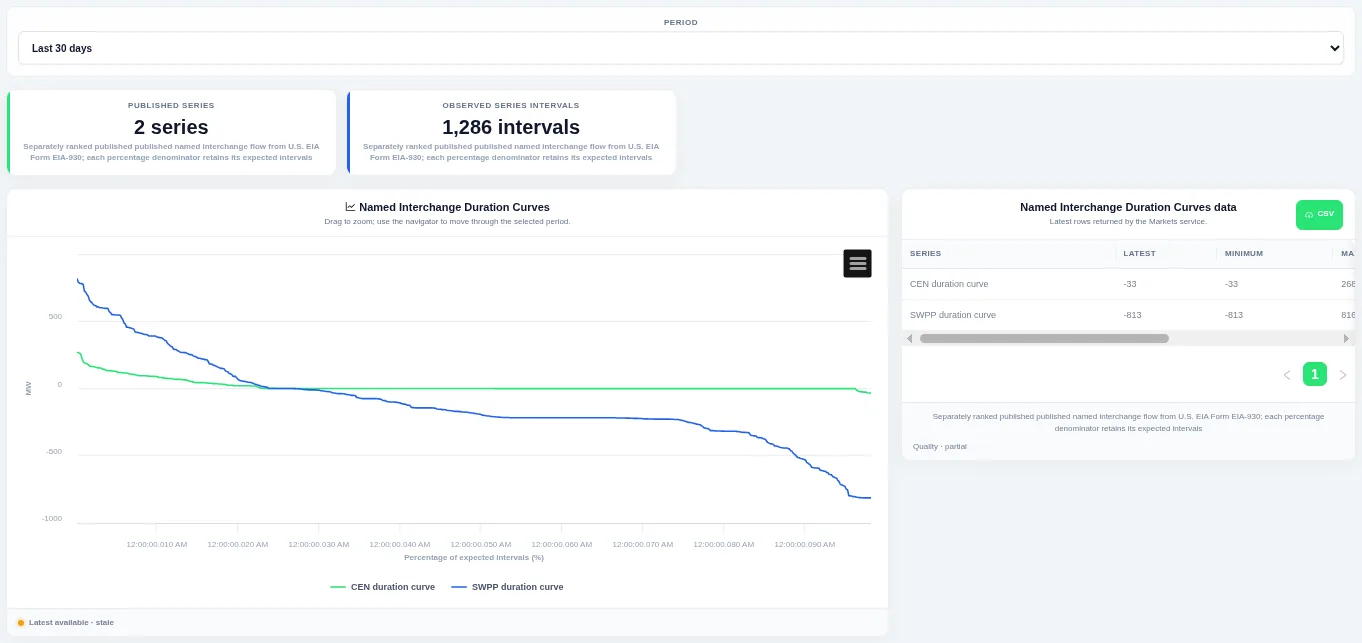
The curve shows how much of the time a level was met or exceeded. Choose the period at the top; the table beside the chart lists the rows behind it and can be downloaded as CSV.
Shown for ERCOT. Available in: ERCOT, CAISO, PJM, MISO, NYISO, ISO-NE, SPP, Great Britain, Germany, New Zealand, IESO (Ontario).
Named Interchange Interval Change
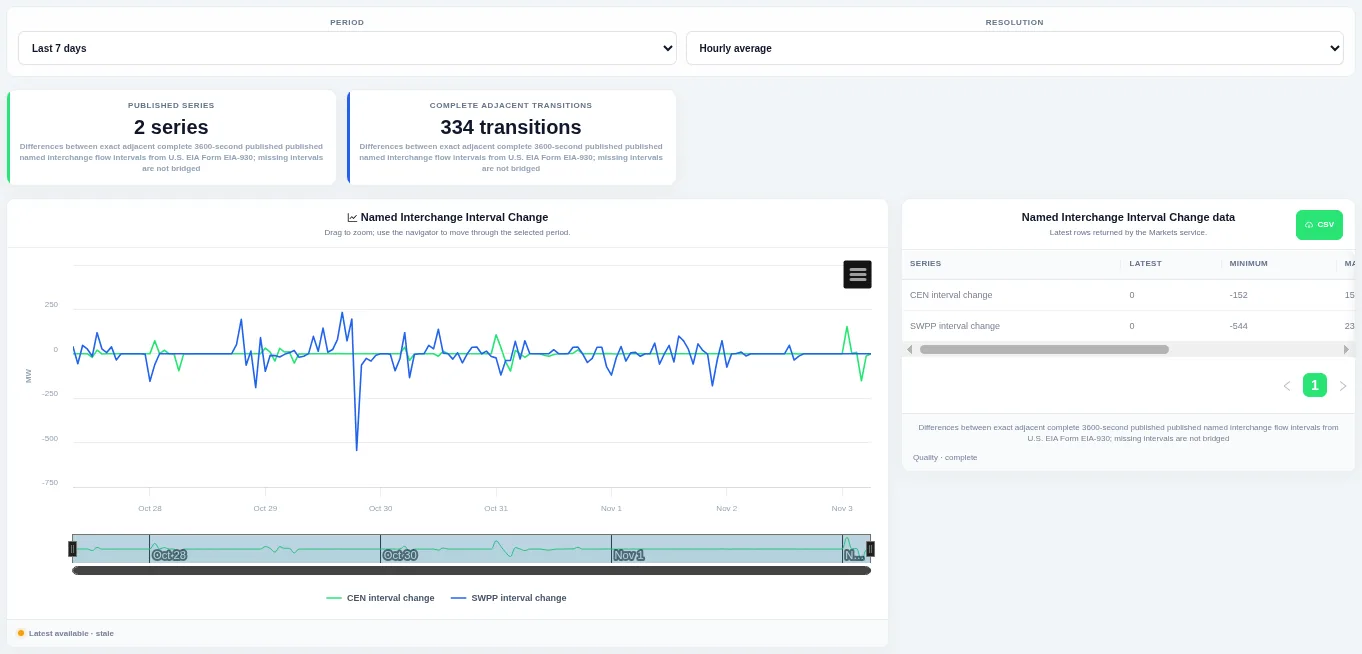
Bars above zero are rises and bars below zero are falls, so ramps stand out. Choose the period and the resolution at the top; the table beside the chart lists the rows behind it and can be downloaded as CSV.
Shown for ERCOT. Available in: ERCOT, CAISO, PJM, MISO, NYISO, ISO-NE, SPP, Great Britain, Germany, New Zealand, IESO (Ontario).
Latest Named Interchanges
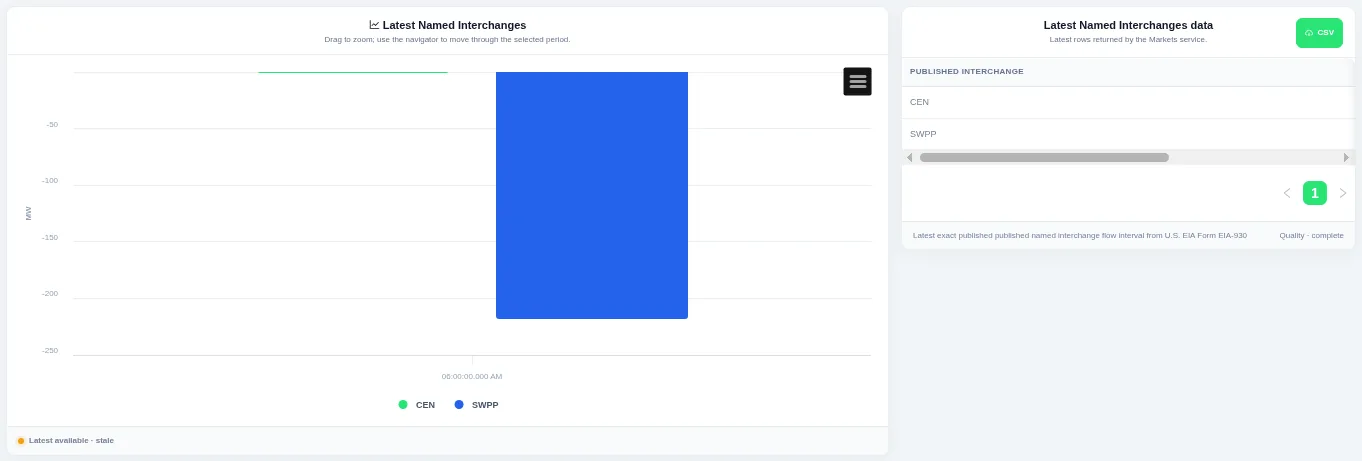
Each bar is one series for the most recent interval. The view always shows the latest published interval, and the table beside the chart lists the rows behind it with a CSV download.
Shown for ERCOT. Available in: ERCOT, CAISO, PJM, MISO, NYISO, ISO-NE, SPP, Great Britain, Germany, New Zealand, IESO (Ontario).
Named Interchange Change Duration Curves
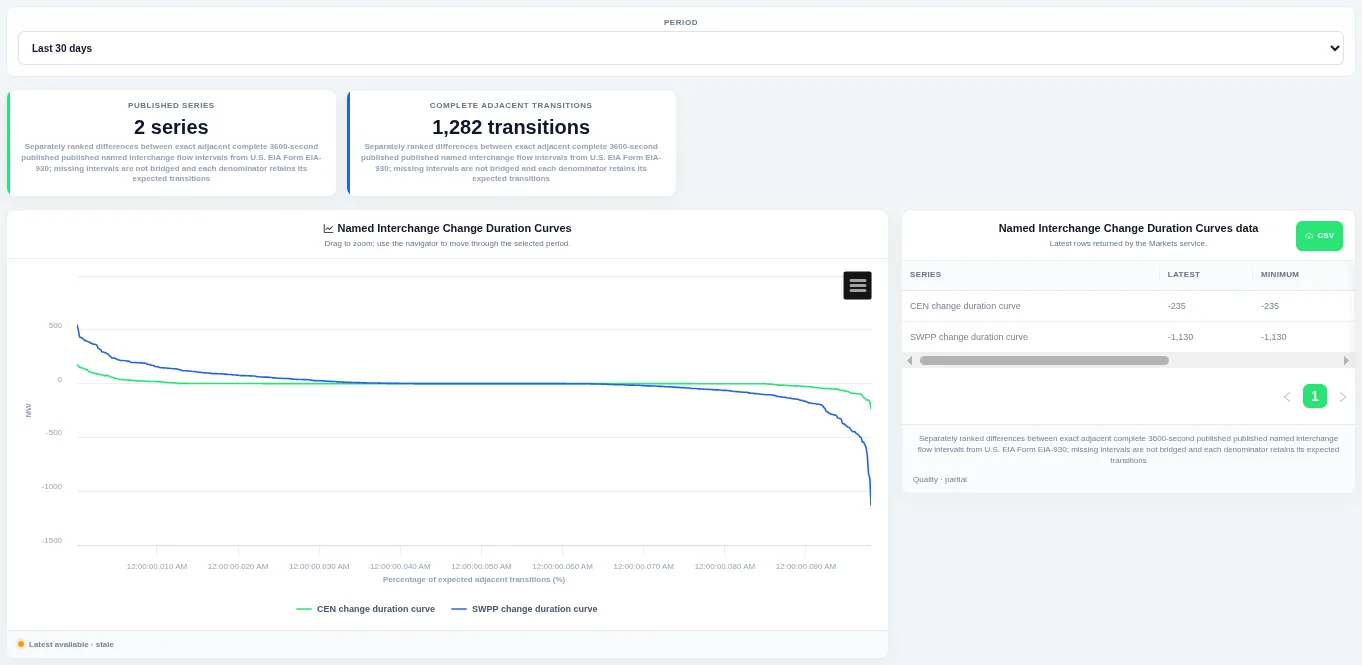
The steep ends of the curve show how often large ramps happen. Choose the period at the top; the table beside the chart lists the rows behind it and can be downloaded as CSV.
Shown for ERCOT. Available in: ERCOT, CAISO, PJM, MISO, NYISO, ISO-NE, SPP, Great Britain, Germany, New Zealand, IESO (Ontario).
Latest Named Interchange Changes
Each named interchange's flow at the previous and latest intervals, and the change between them.
Available in: ERCOT, CAISO, PJM, MISO, NYISO, ISO-NE, SPP, Great Britain, Germany, New Zealand, IESO (Ontario).
Demand–Interchange Scatter
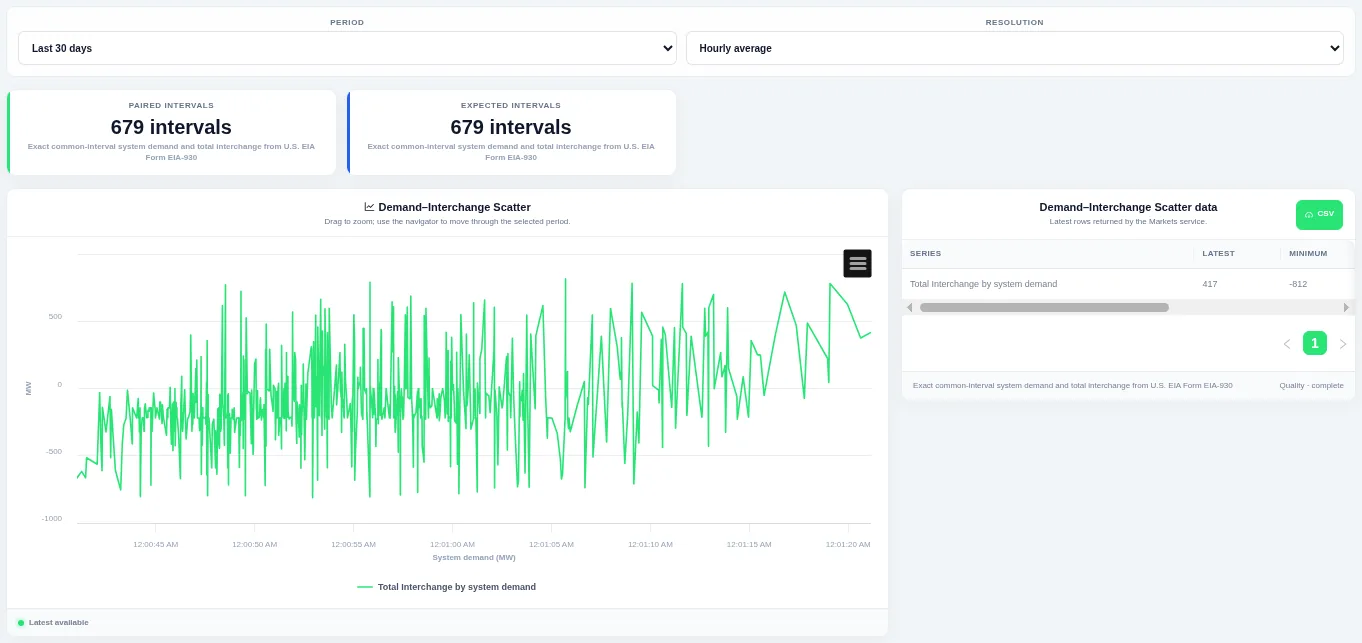
The shape of the point cloud shows how closely the two move together. Choose the period and the resolution at the top; the table beside the chart lists the rows behind it and can be downloaded as CSV.
Shown for ERCOT. Available in: ERCOT, CAISO, PJM, MISO, NYISO, ISO-NE, SPP, Germany, IESO (Ontario).
Generation–Interchange Scatter
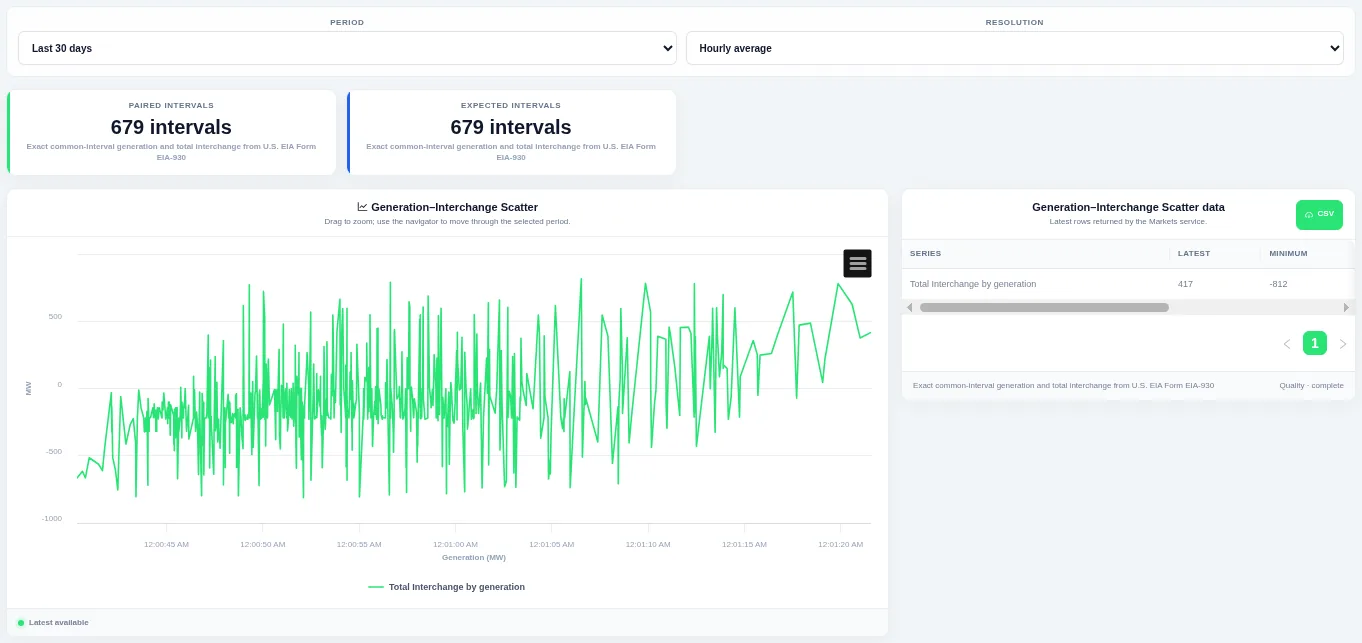
The shape of the point cloud shows how closely the two move together. Choose the period and the resolution at the top; the table beside the chart lists the rows behind it and can be downloaded as CSV.
Shown for ERCOT. Available in: ERCOT, CAISO, PJM, MISO, NYISO, ISO-NE, SPP, Germany.
Carbon
Grid Carbon Intensity
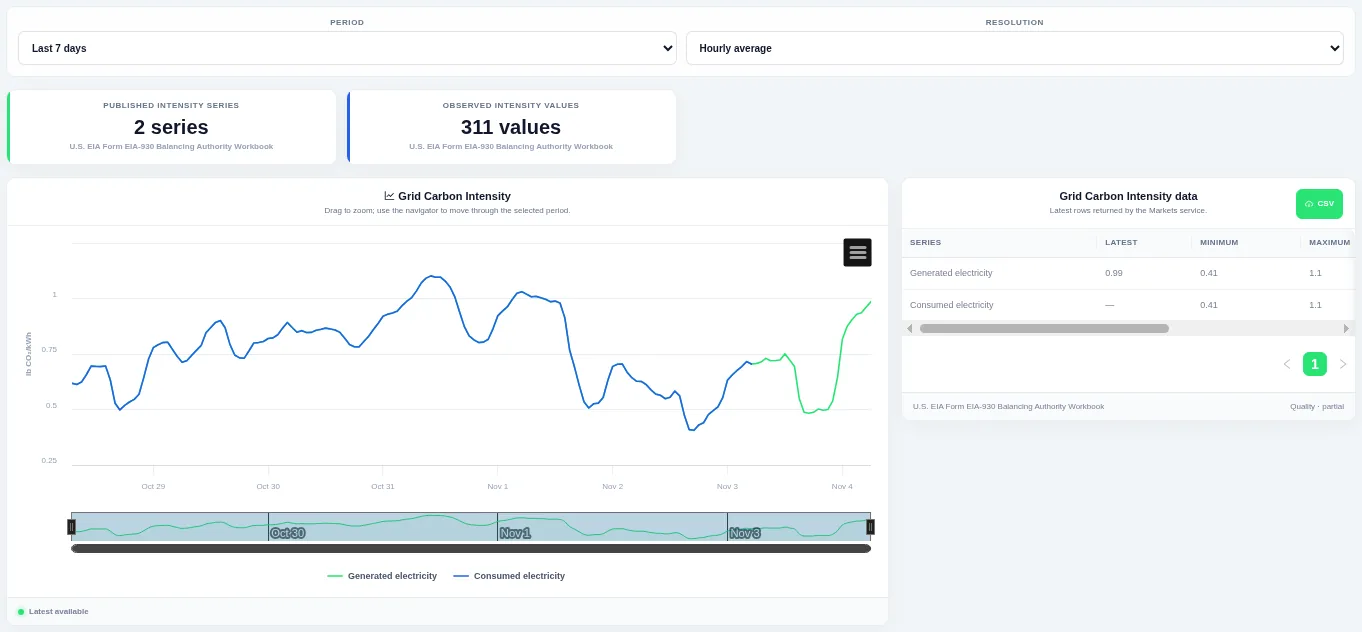
Drag on the chart or the navigator to zoom into part of the period. Choose the period and the resolution at the top; the table beside the chart lists the rows behind it and can be downloaded as CSV.
Shown for ERCOT. Available in: ERCOT, CAISO, PJM, MISO, NYISO, ISO-NE, SPP.
Daily Carbon Intensity Profiles
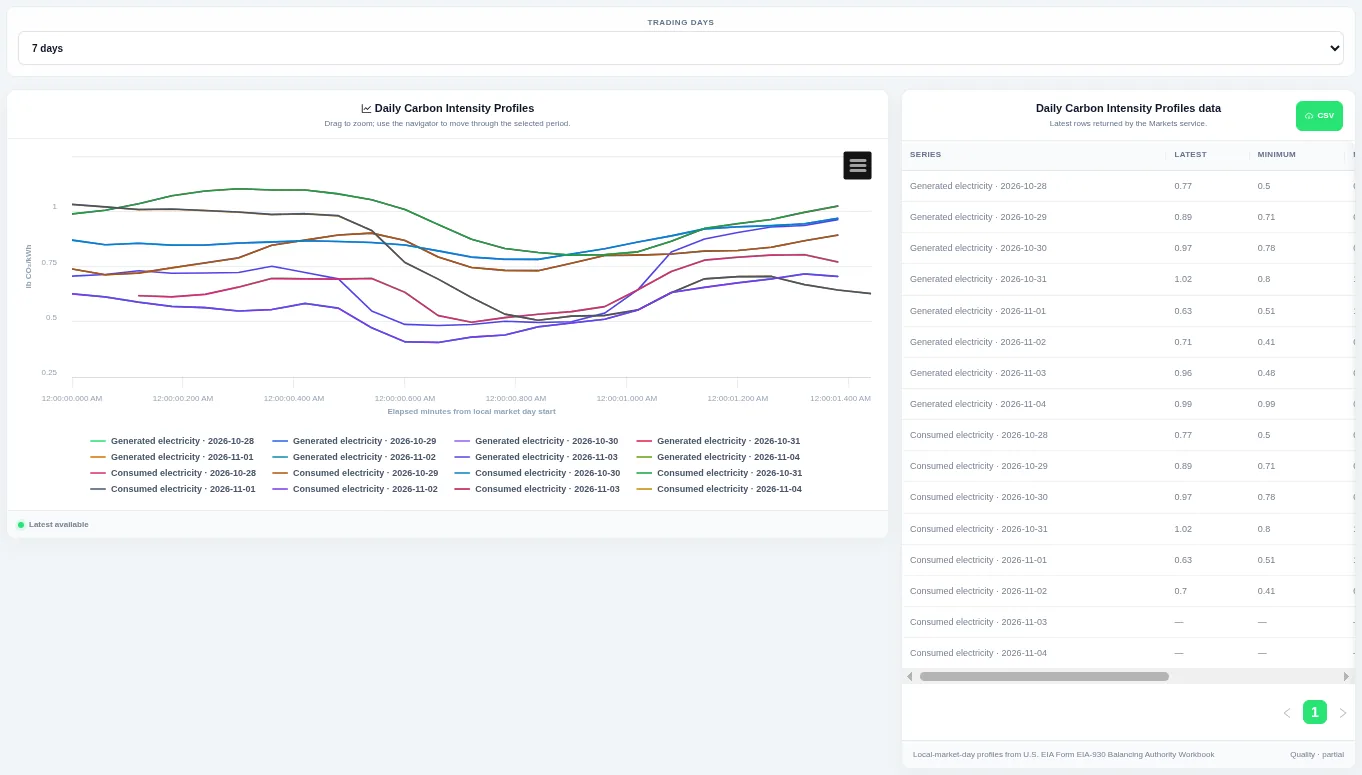
Each line is one trading day, so you can compare the daily shape. Choose how many trading days to compare at the top; the table beside the chart lists the rows behind it and can be downloaded as CSV.
Shown for ERCOT. Available in: ERCOT, CAISO, PJM, MISO, NYISO, ISO-NE, SPP.
Carbon Intensity Distribution
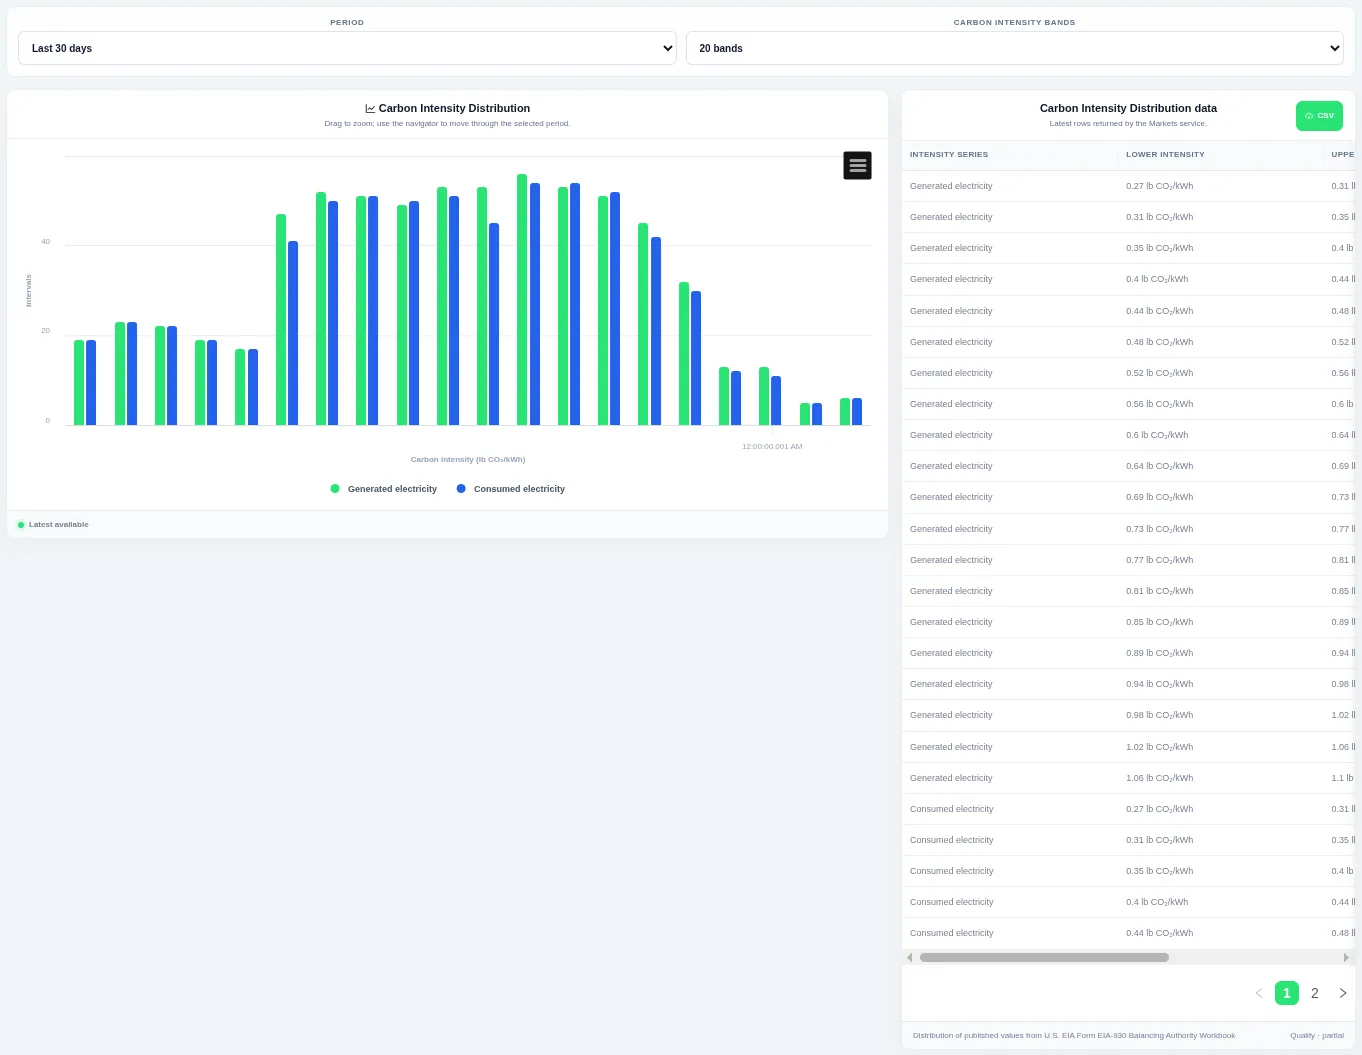
Taller bars show the levels that occur most often over the chosen period. Choose the period and the number of bands at the top; the table beside the chart lists the rows behind it and can be downloaded as CSV.
Shown for ERCOT. Available in: ERCOT, CAISO, PJM, MISO, NYISO, ISO-NE, SPP.
Carbon Intensity Duration Curves
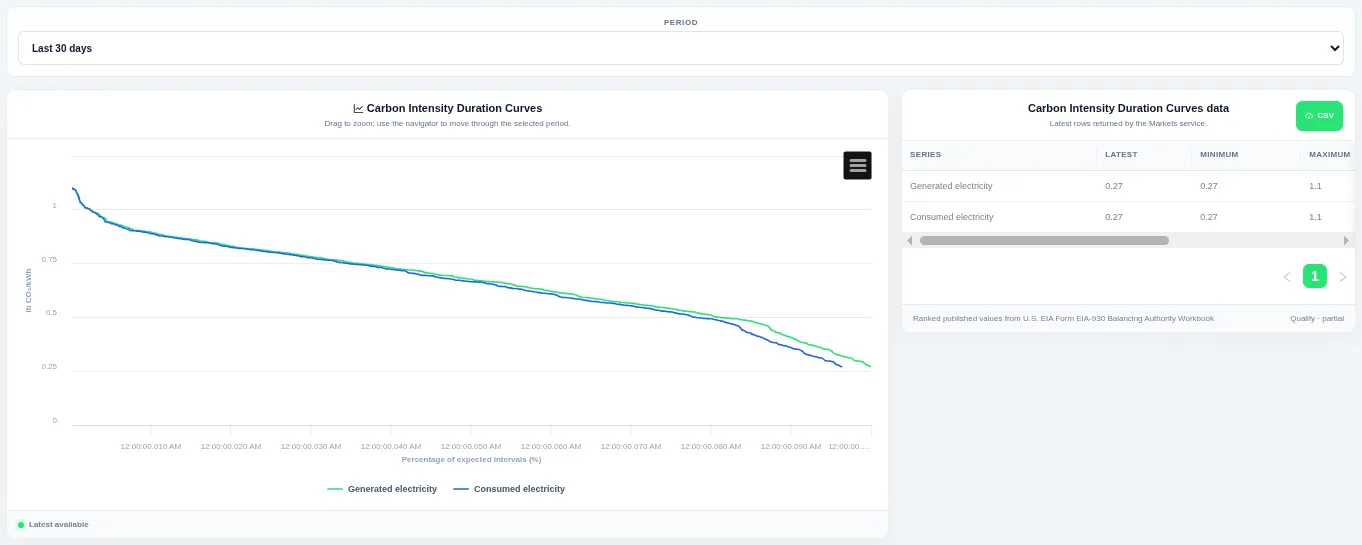
The curve shows how much of the time a level was met or exceeded. Choose the period at the top; the table beside the chart lists the rows behind it and can be downloaded as CSV.
Shown for ERCOT. Available in: ERCOT, CAISO, PJM, MISO, NYISO, ISO-NE, SPP.
Carbon Intensity Interval Change
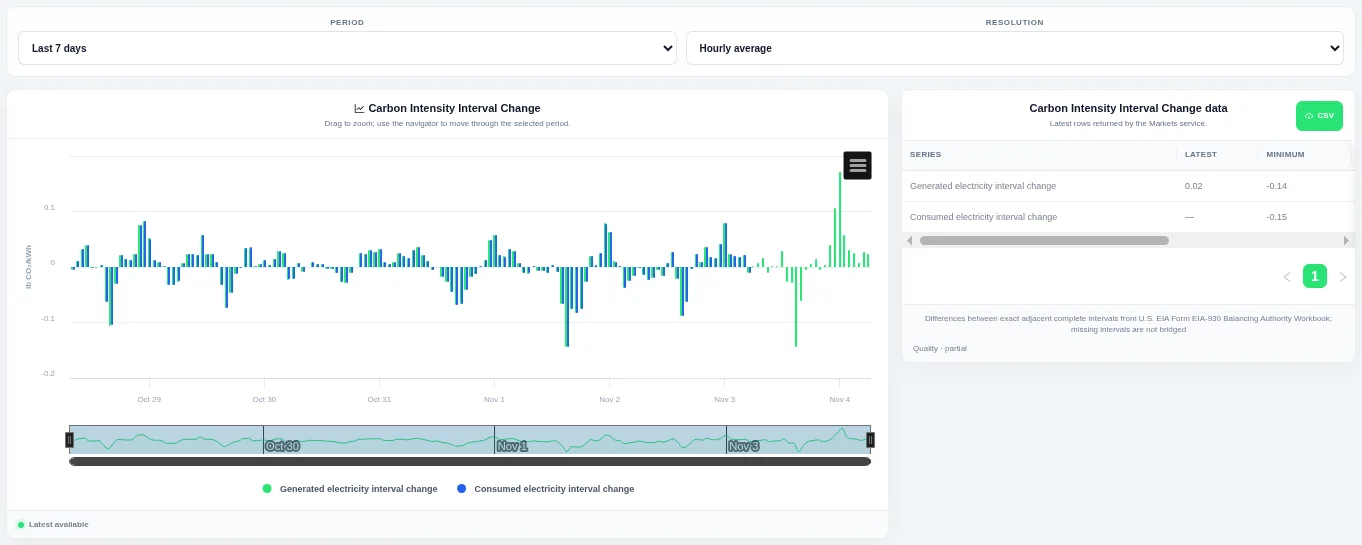
Bars above zero are rises and bars below zero are falls, so ramps stand out. Choose the period and the resolution at the top; the table beside the chart lists the rows behind it and can be downloaded as CSV.
Shown for ERCOT. Available in: ERCOT, CAISO, PJM, MISO, NYISO, ISO-NE, SPP.
Carbon Intensity Change Distributions
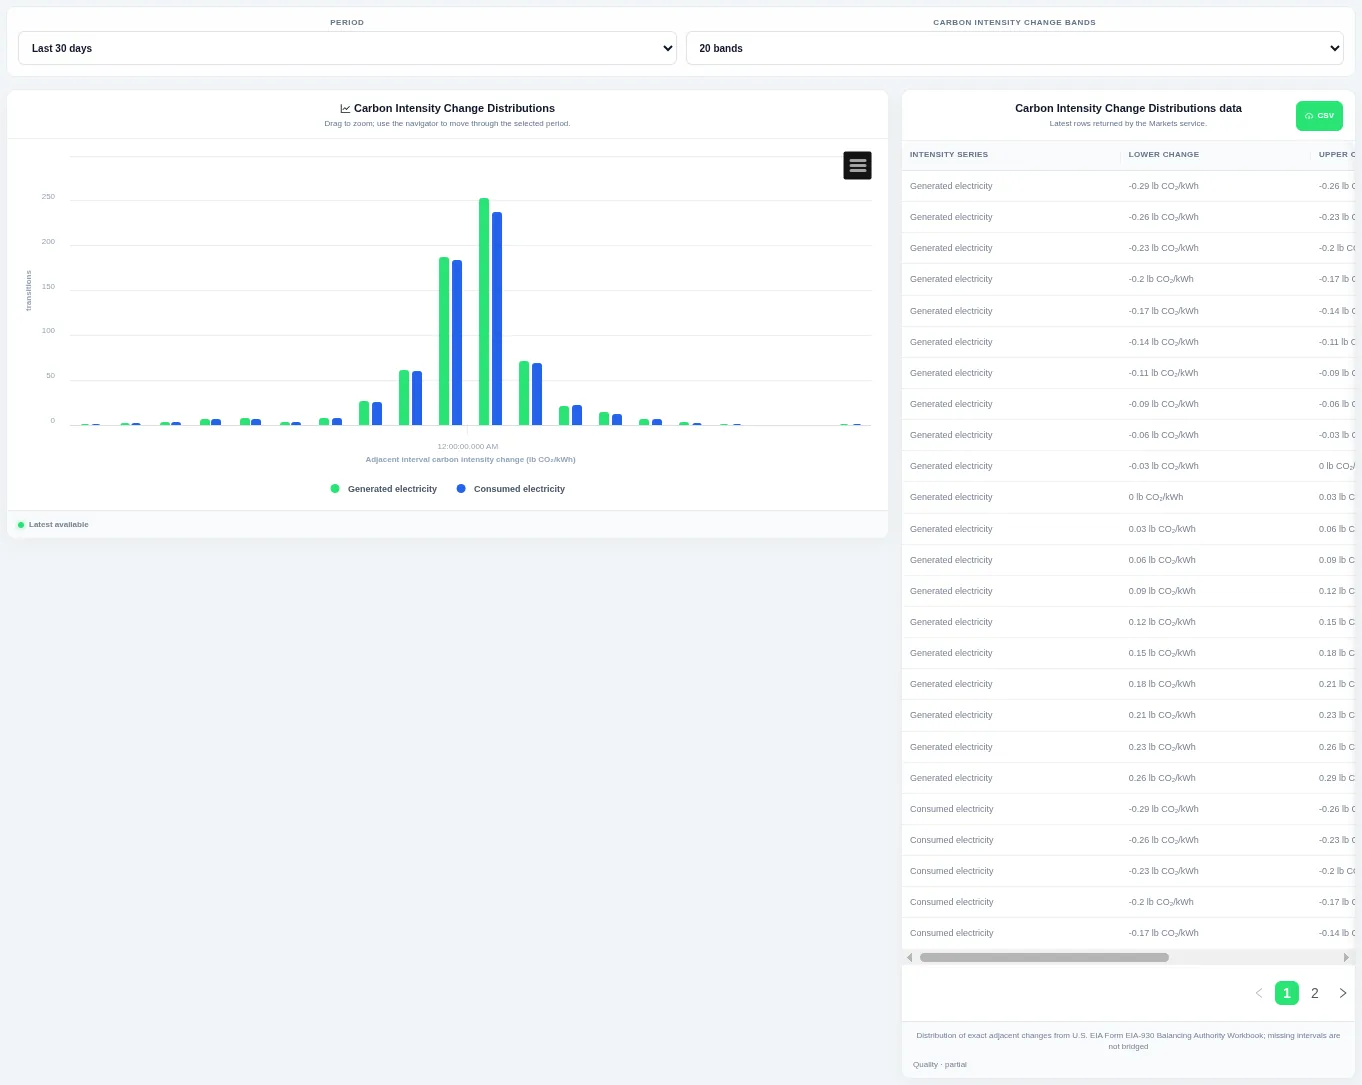
Taller bars show the size of change that happens most often, and the tails show rare large steps. Choose the period and the number of bands at the top; the table beside the chart lists the rows behind it and can be downloaded as CSV.
Shown for ERCOT. Available in: ERCOT, CAISO, PJM, MISO, NYISO, ISO-NE, SPP.
Carbon Intensity Change Duration Curves
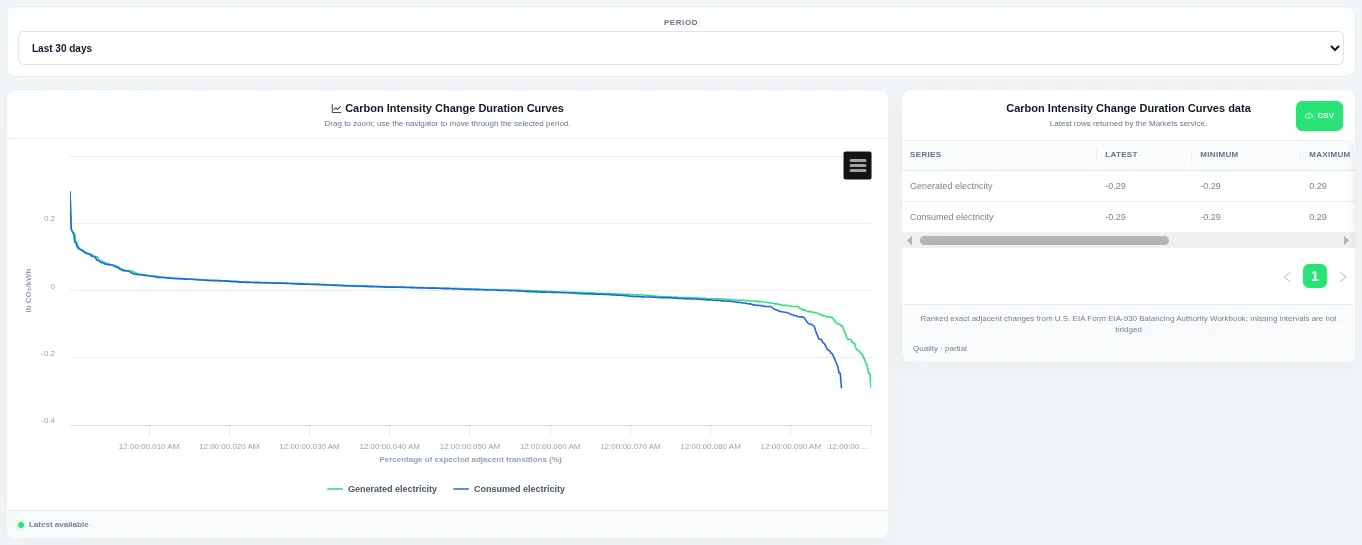
The steep ends of the curve show how often large ramps happen. Choose the period at the top; the table beside the chart lists the rows behind it and can be downloaded as CSV.
Shown for ERCOT. Available in: ERCOT, CAISO, PJM, MISO, NYISO, ISO-NE, SPP.
Latest Carbon Intensity
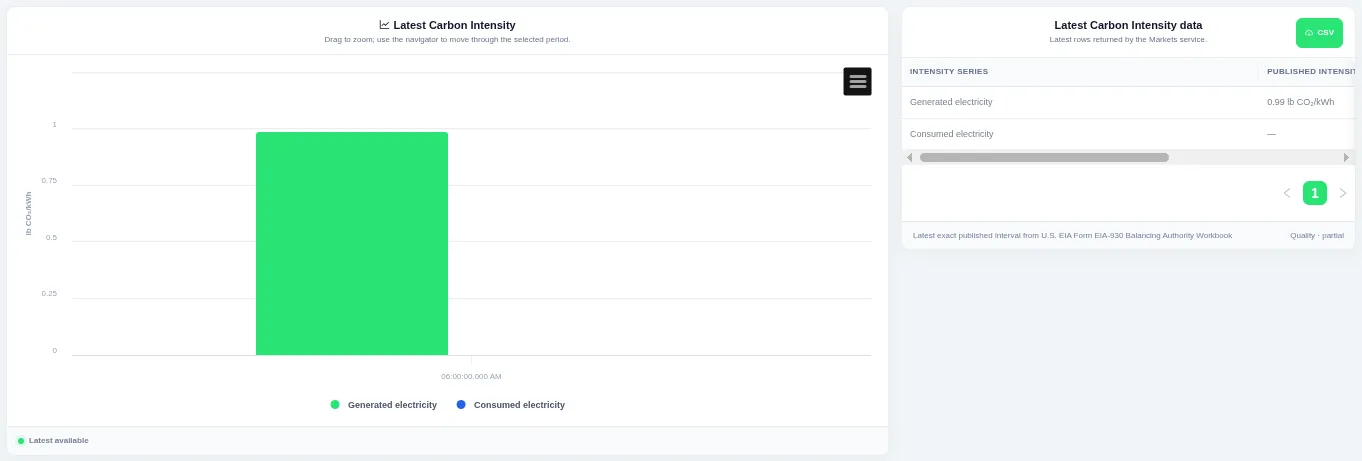
Each bar is one series for the most recent interval. The view always shows the latest published interval, and the table beside the chart lists the rows behind it with a CSV download.
Shown for ERCOT. Available in: ERCOT, CAISO, PJM, MISO, NYISO, ISO-NE, SPP.
Generated–Consumed Carbon Scatter
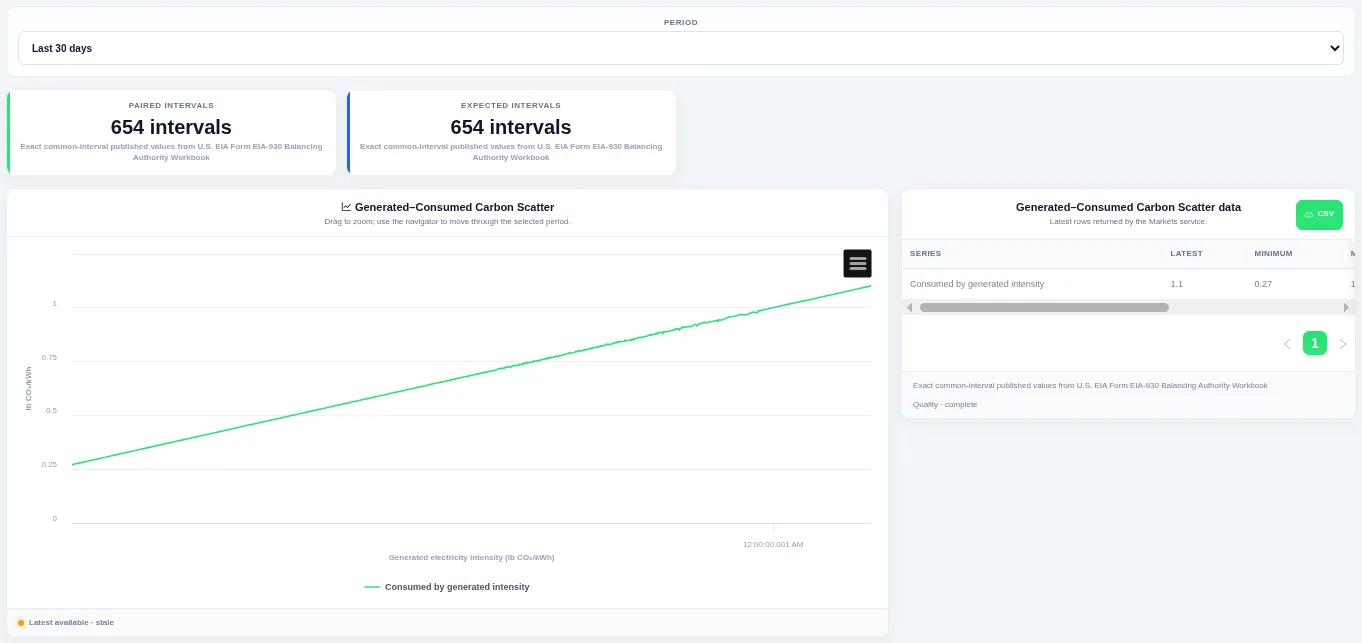
Points off the diagonal show when imports or exports moved the carbon intensity of consumed electricity away from local generation. Choose the period at the top.
Shown for ERCOT. Available in: ERCOT, CAISO, PJM, MISO, NYISO, ISO-NE, SPP.
Wholesale price
Wholesale Energy Price
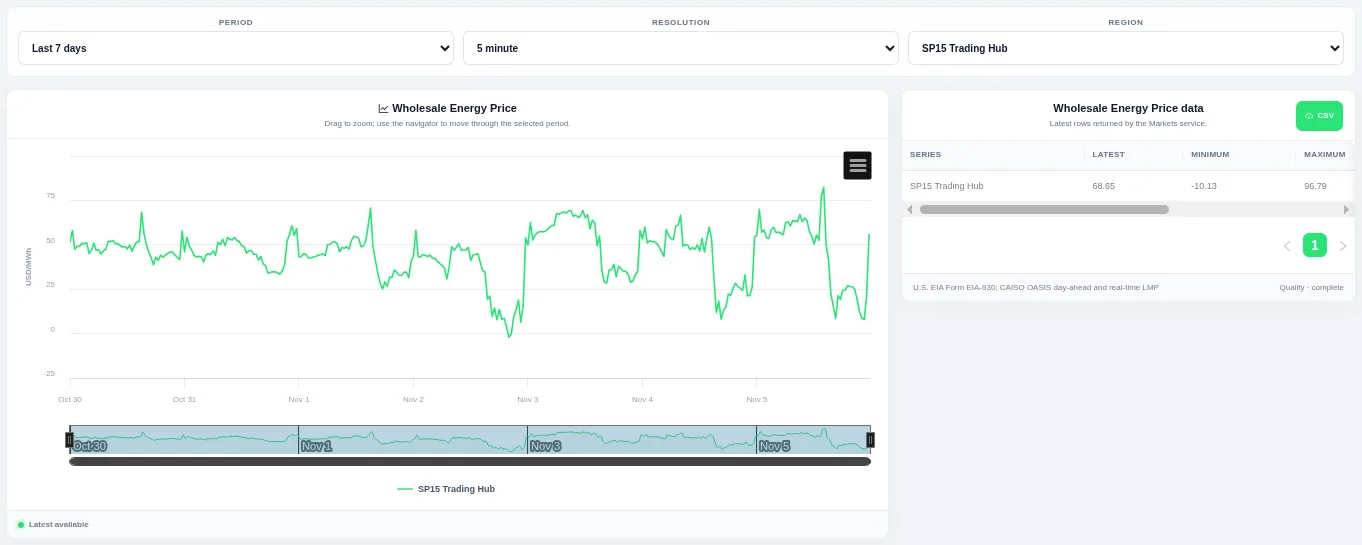
Drag on the chart or the navigator to zoom into part of the period. Choose the period, the resolution and the region or pricing hub at the top; the table beside the chart lists the rows behind it and can be downloaded as CSV.
Shown for CAISO. Available in: CAISO, MISO, NYISO, ISO-NE, Great Britain, Germany, New Zealand, IESO (Ontario), AESO (Alberta), Ireland (SEM).
Daily Price Profiles
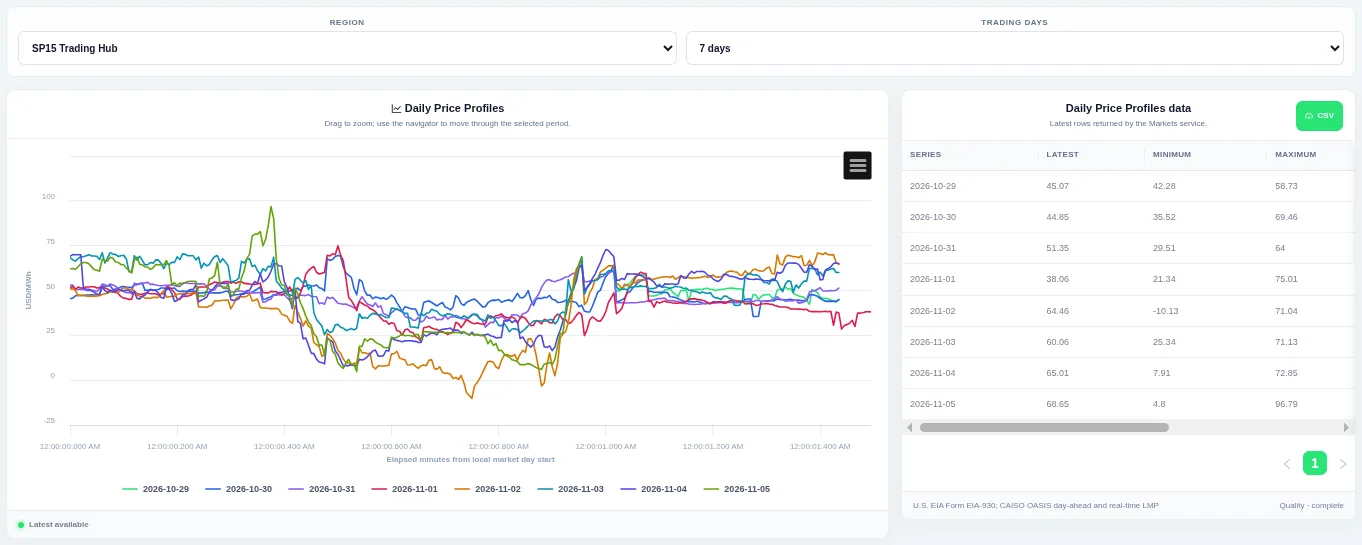
Each line is one trading day, so you can compare the daily shape. Choose the region or pricing hub and how many trading days to compare at the top; the table beside the chart lists the rows behind it and can be downloaded as CSV.
Shown for CAISO. Available in: CAISO, MISO, NYISO, ISO-NE, Great Britain, Germany, New Zealand, IESO (Ontario), AESO (Alberta), Ireland (SEM).
Daily Price Heatmap
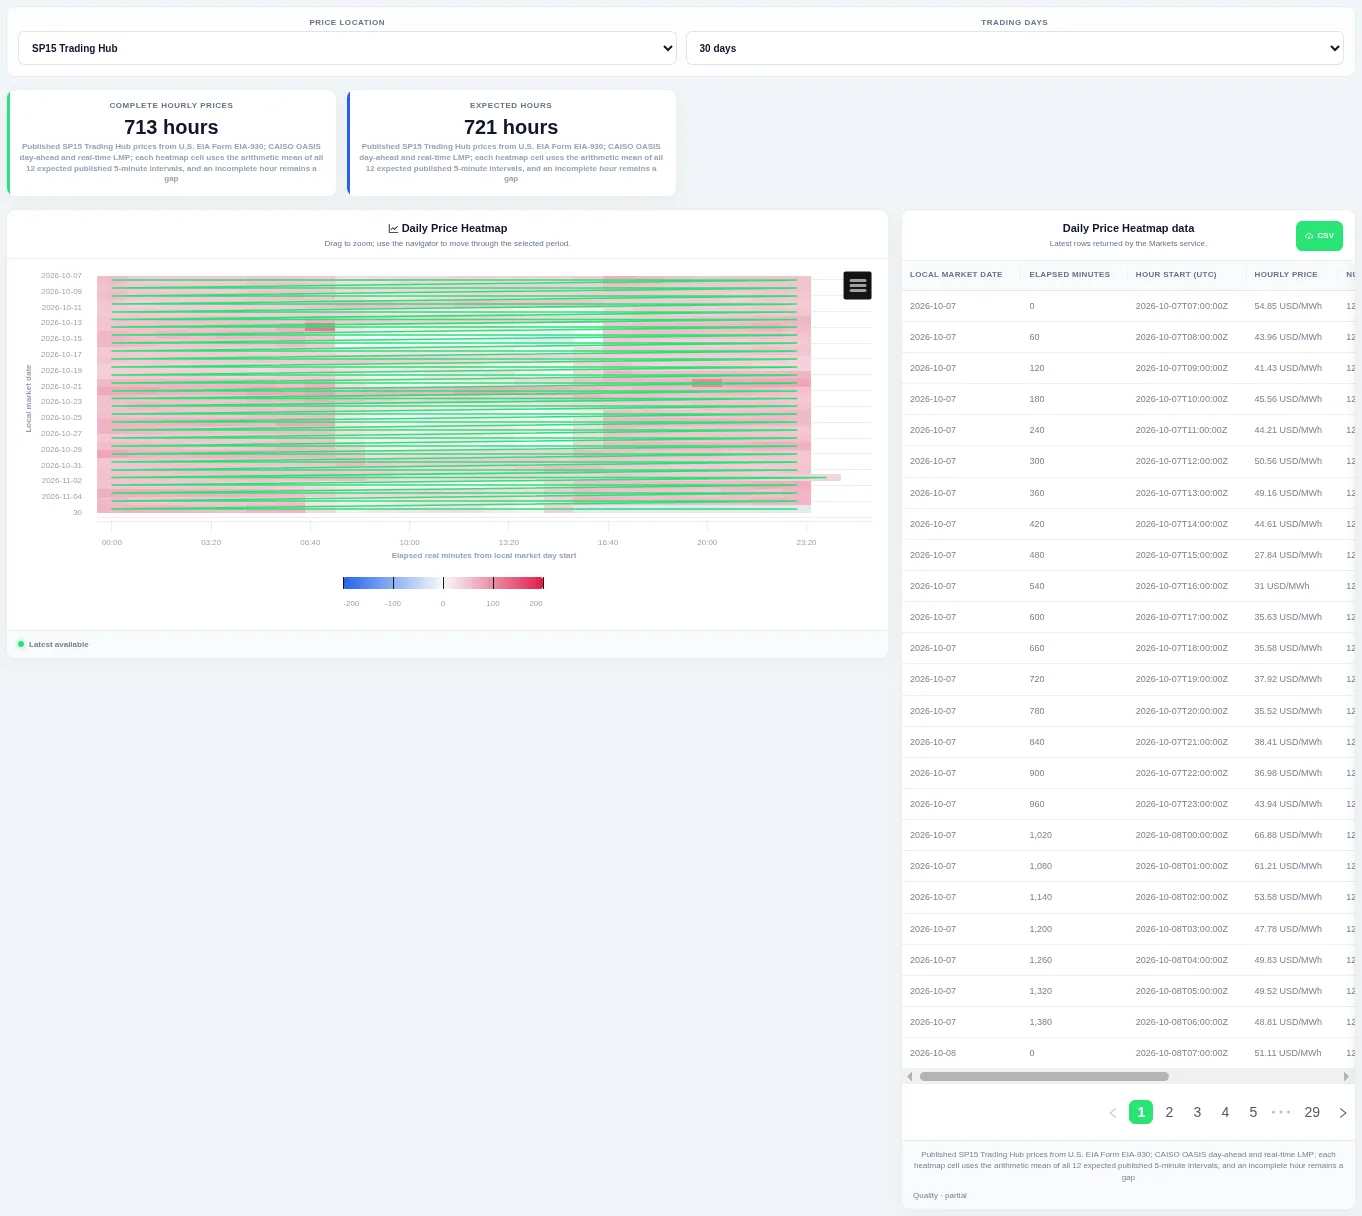
Each row is one trading day and colour shows the price level, which makes daily peaks and unusual days easy to spot. Choose the price location and how many trading days to show at the top.
Shown for CAISO. Available in: CAISO, MISO, NYISO, ISO-NE, Great Britain, Germany, New Zealand, IESO (Ontario), AESO (Alberta), Ireland (SEM).
Price Interquartile Profile
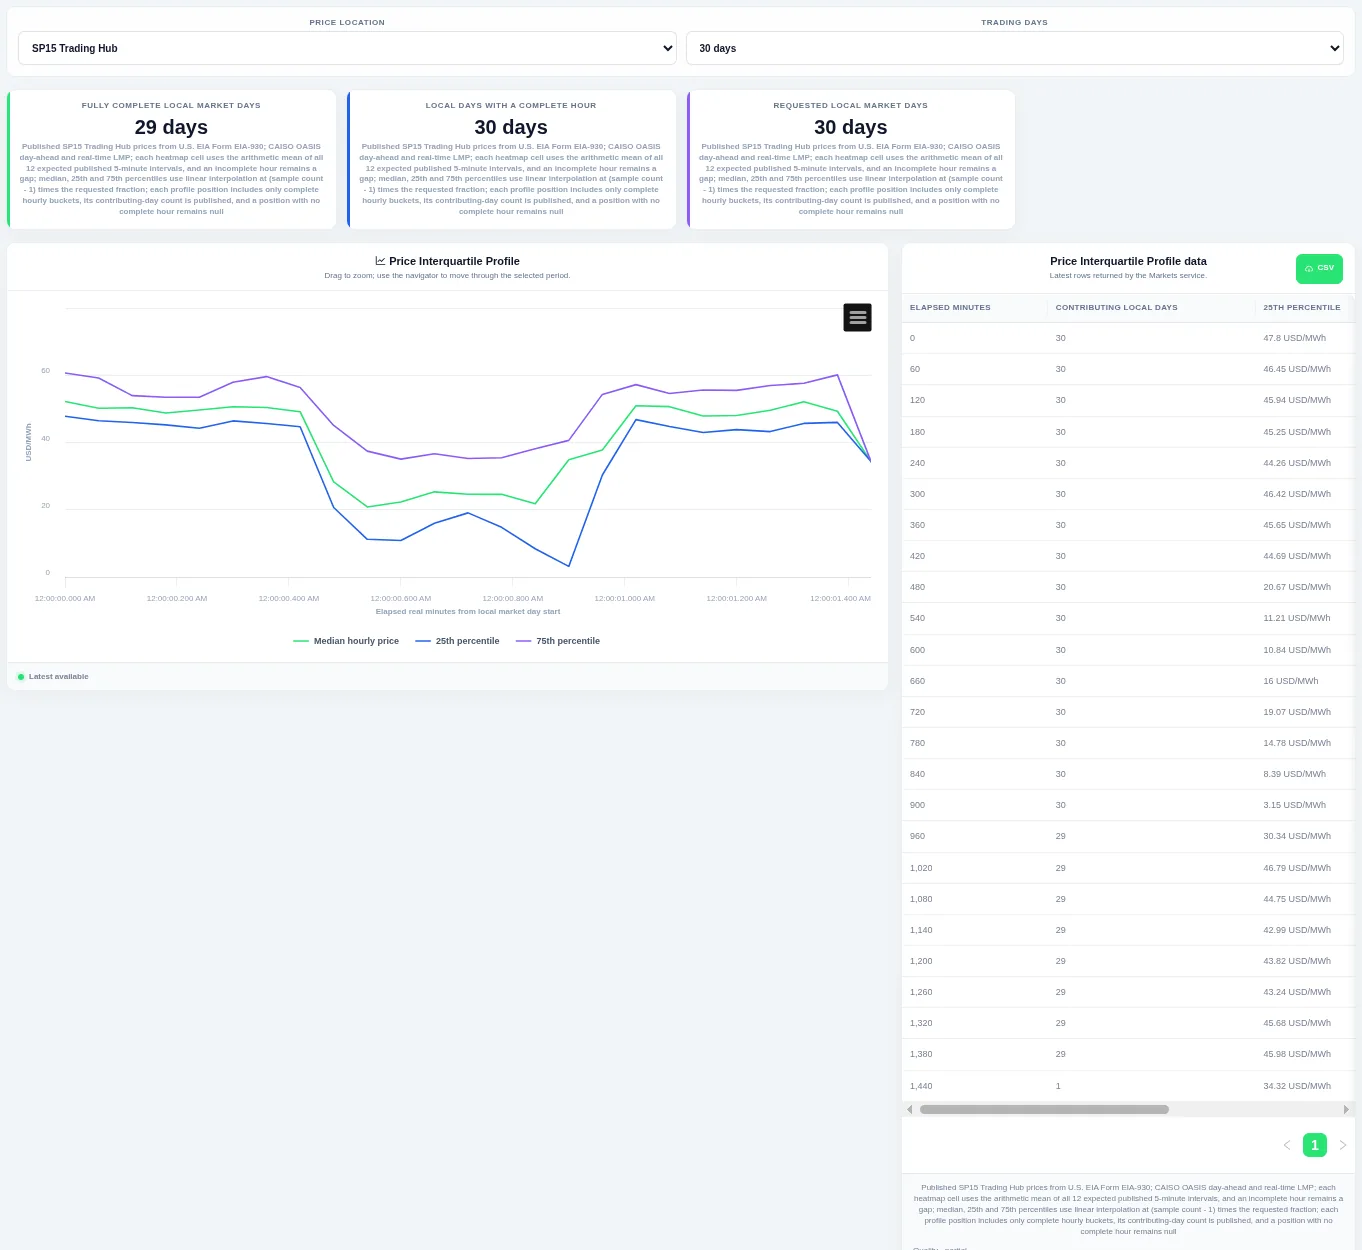
The median line sits between the lower and upper quartile lines, showing the normal spread at each time of day. Choose the price location and how many trading days to include at the top.
Shown for CAISO. Available in: CAISO, MISO, NYISO, ISO-NE, Great Britain, Germany, New Zealand, IESO (Ontario), AESO (Alberta), Ireland (SEM).
Daily Intraday Price Range
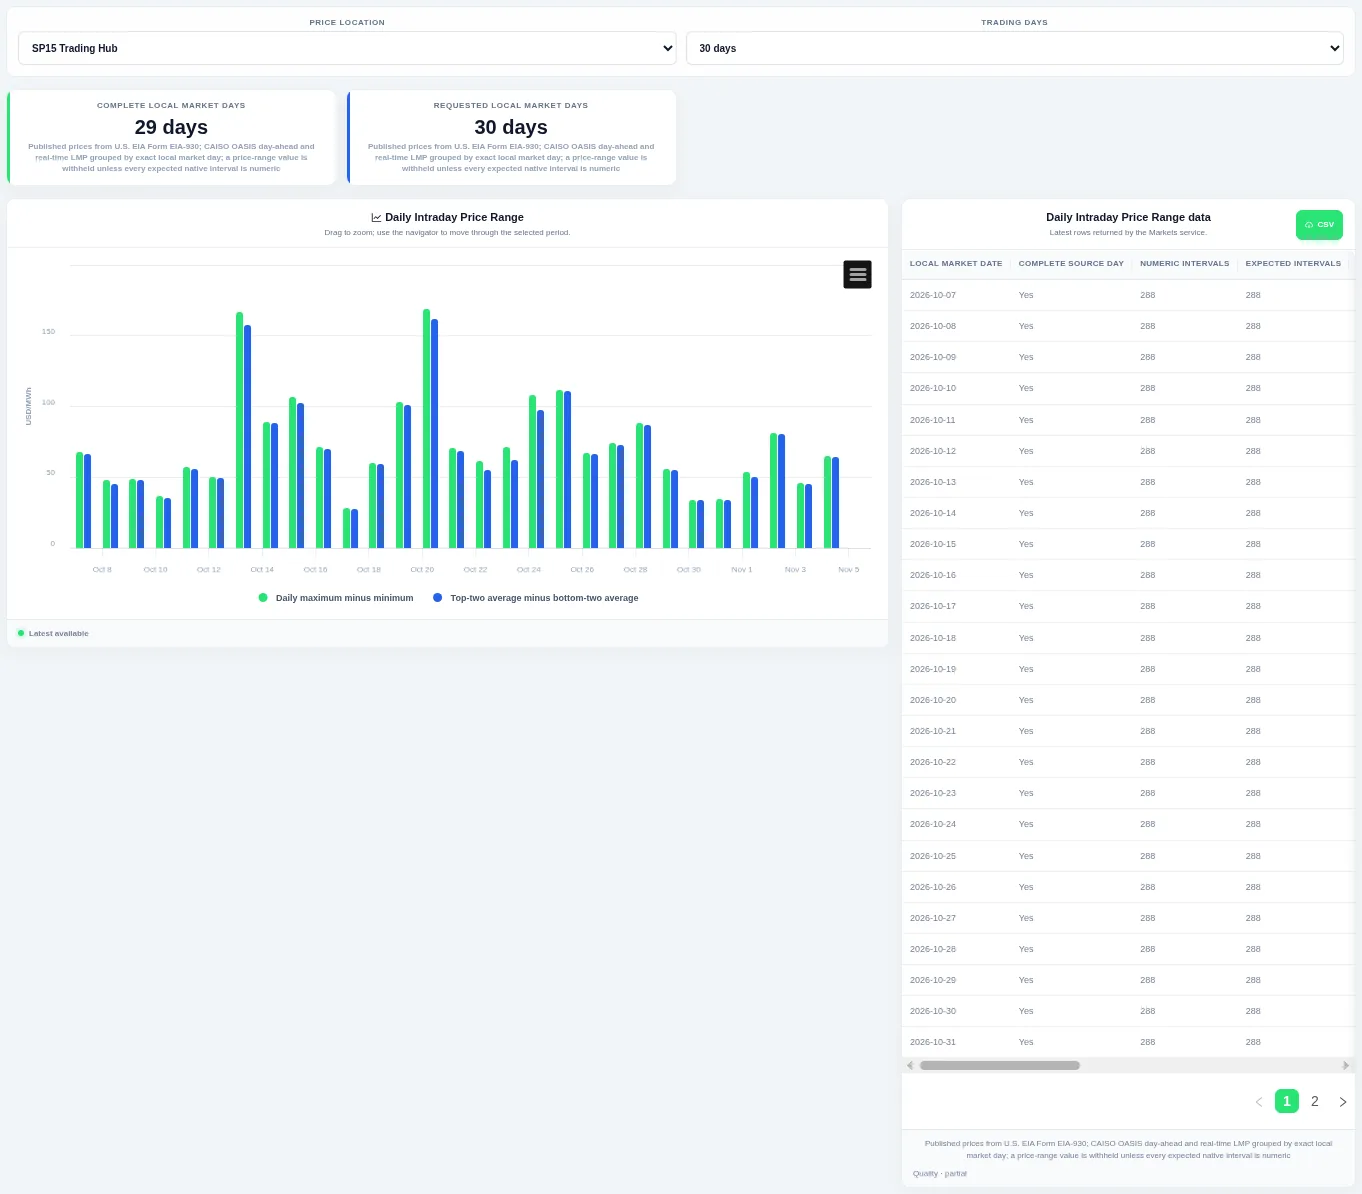
Bars compare the spread between the highest and lowest interval of each day with how far the average sits from the low. Choose the price location and how many trading days to include at the top.
Shown for CAISO. Available in: CAISO, MISO, NYISO, ISO-NE, Great Britain, Germany, New Zealand, IESO (Ontario), AESO (Alberta), Ireland (SEM).
Price Historical Profile
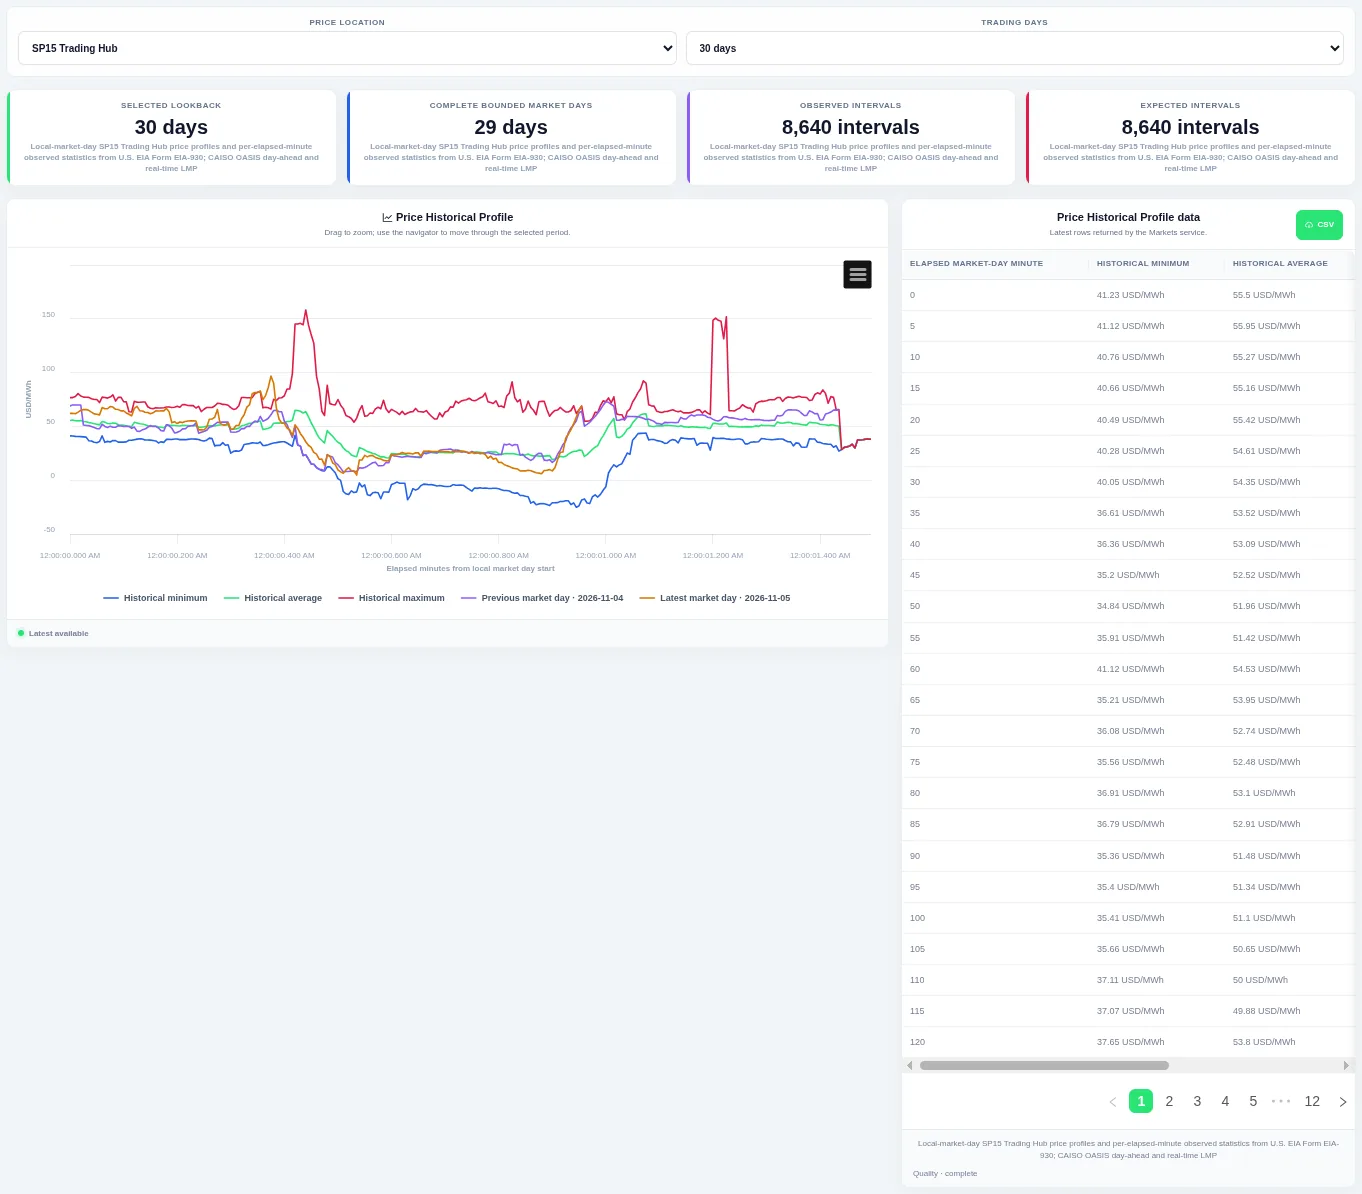
The previous and latest trading days are drawn on top so you can see whether today is unusual. Choose the price location and how many trading days to compare at the top; the table beside the chart lists the rows behind it and can be downloaded as CSV.
Shown for CAISO. Available in: CAISO, MISO, NYISO, ISO-NE, Great Britain, Germany, New Zealand, IESO (Ontario), AESO (Alberta), Ireland (SEM).
Price Volatility
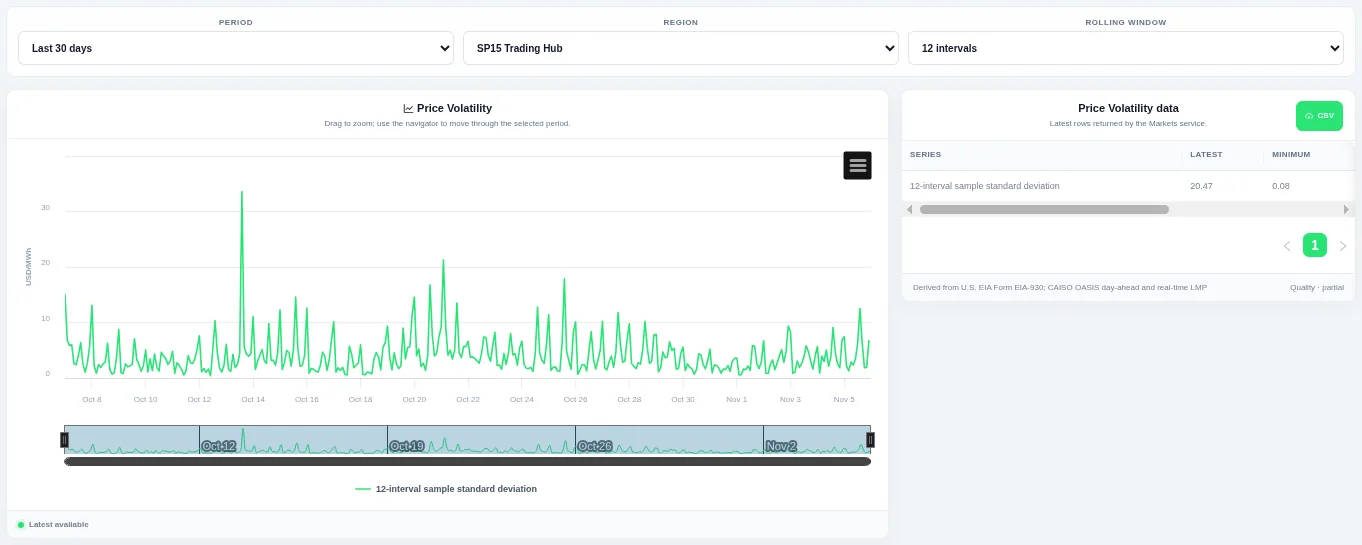
The line shows how much the price is swinging over a moving window, so calm and stressed periods stand out. Choose the period, pricing hub and rolling window at the top and drag to zoom.
Shown for CAISO. Available in: CAISO, MISO, NYISO, ISO-NE, Great Britain, Germany, New Zealand, IESO (Ontario), AESO (Alberta), Ireland (SEM).
Price Distribution
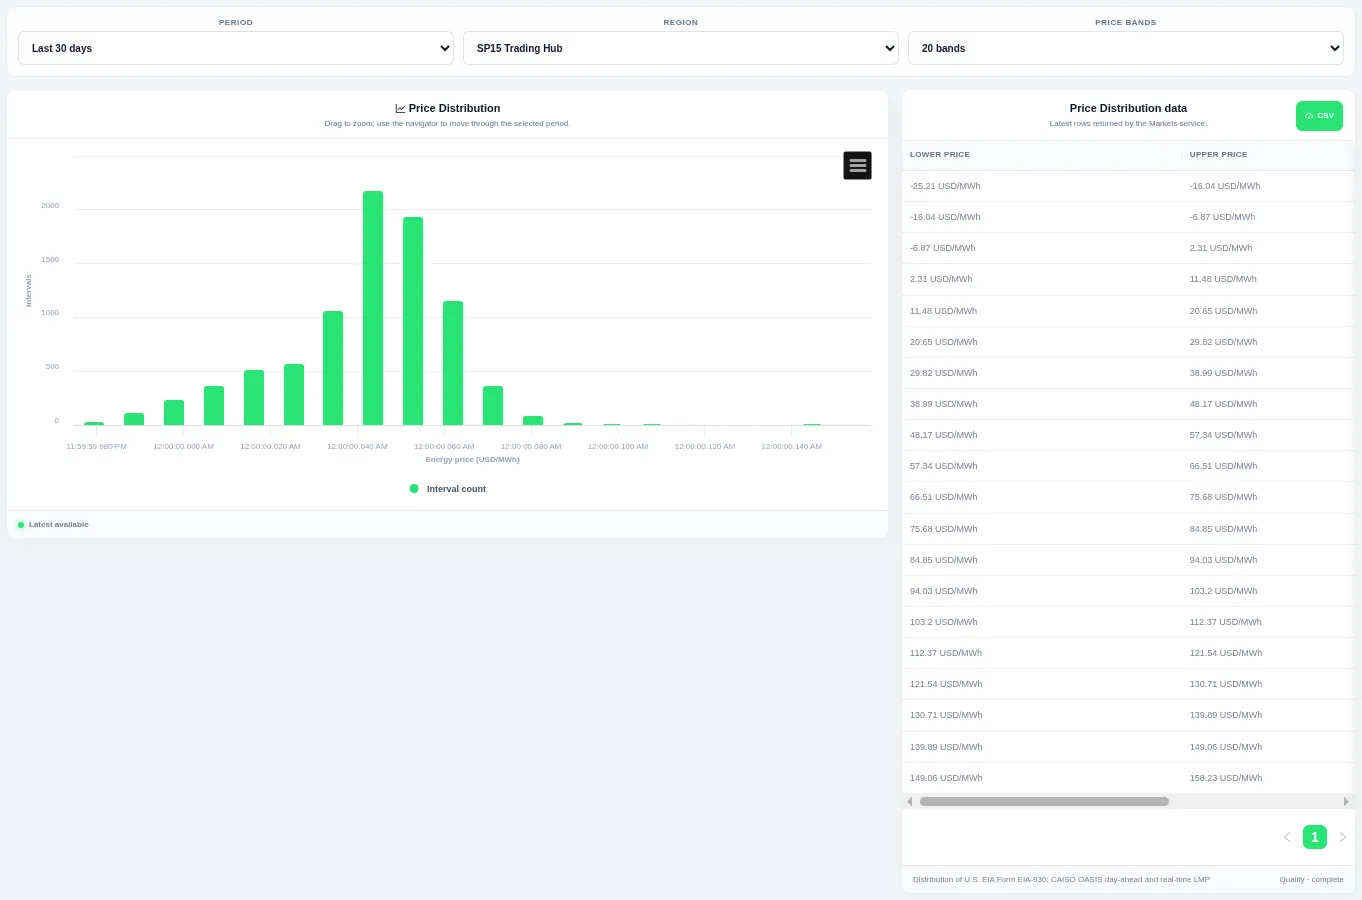
Taller bars show the levels that occur most often over the chosen period. Choose the period, the region or pricing hub and the number of bands at the top; the table beside the chart lists the rows behind it and can be downloaded as CSV.
Shown for CAISO. Available in: CAISO, MISO, NYISO, ISO-NE, Great Britain, Germany, New Zealand, IESO (Ontario), AESO (Alberta), Ireland (SEM).
Price Duration Curve
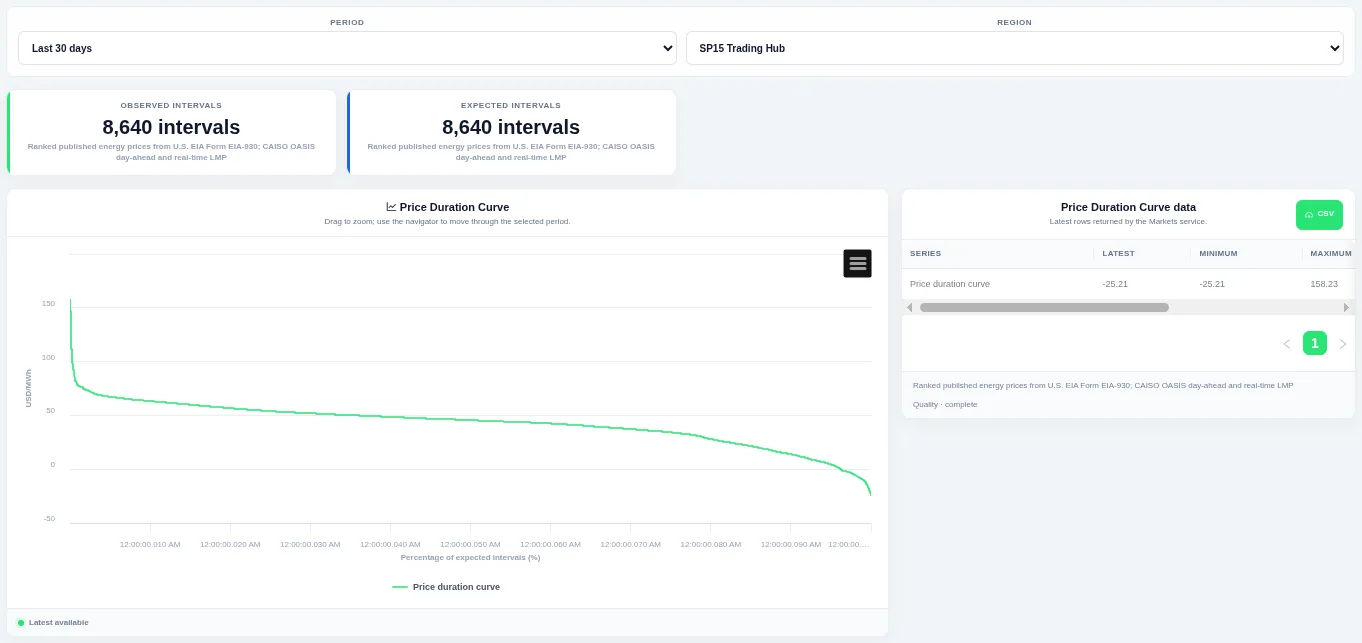
The curve shows how much of the time a level was met or exceeded. Choose the period and the region or pricing hub at the top; the table beside the chart lists the rows behind it and can be downloaded as CSV.
Shown for CAISO. Available in: CAISO, MISO, NYISO, ISO-NE, Great Britain, Germany, New Zealand, IESO (Ontario), AESO (Alberta), Ireland (SEM).
Price Interval Change
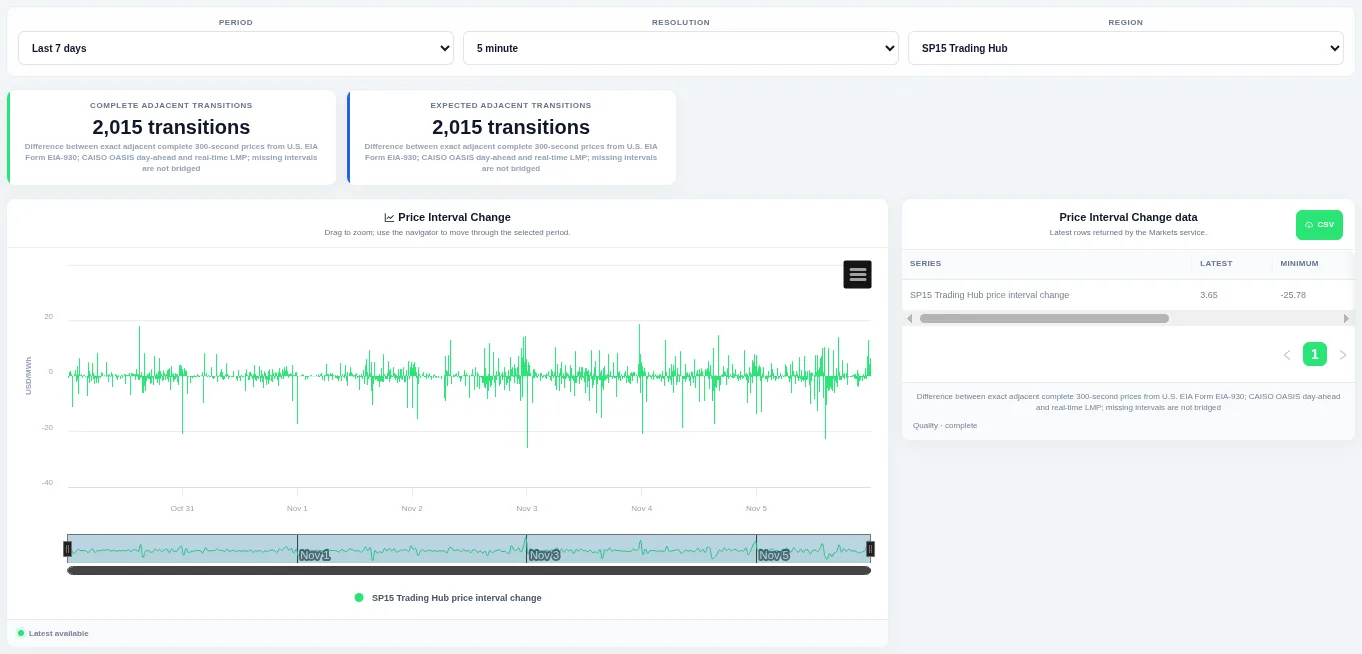
Bars above zero are rises and bars below zero are falls, so ramps stand out. Choose the period, the resolution and the region or pricing hub at the top; the table beside the chart lists the rows behind it and can be downloaded as CSV.
Shown for CAISO. Available in: CAISO, MISO, NYISO, ISO-NE, Great Britain, Germany, New Zealand, IESO (Ontario), AESO (Alberta), Ireland (SEM).
Price Change Distribution
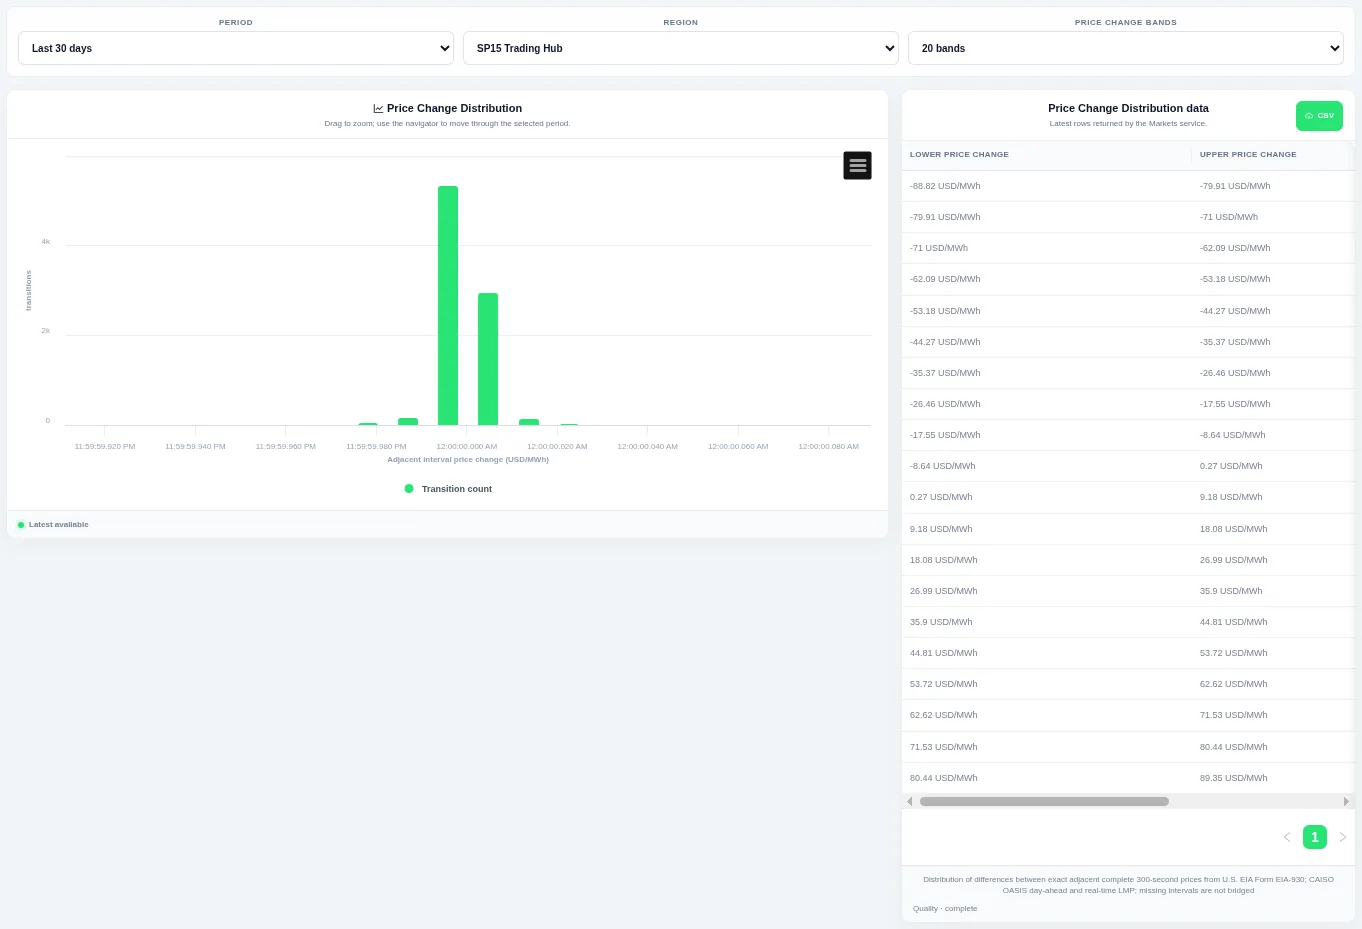
Taller bars show the size of change that happens most often, and the tails show rare large steps. Choose the period, the region or pricing hub and the number of bands at the top; the table beside the chart lists the rows behind it and can be downloaded as CSV.
Shown for CAISO. Available in: CAISO, MISO, NYISO, ISO-NE, Great Britain, Germany, New Zealand, IESO (Ontario), AESO (Alberta), Ireland (SEM).
Price Change Duration Curve
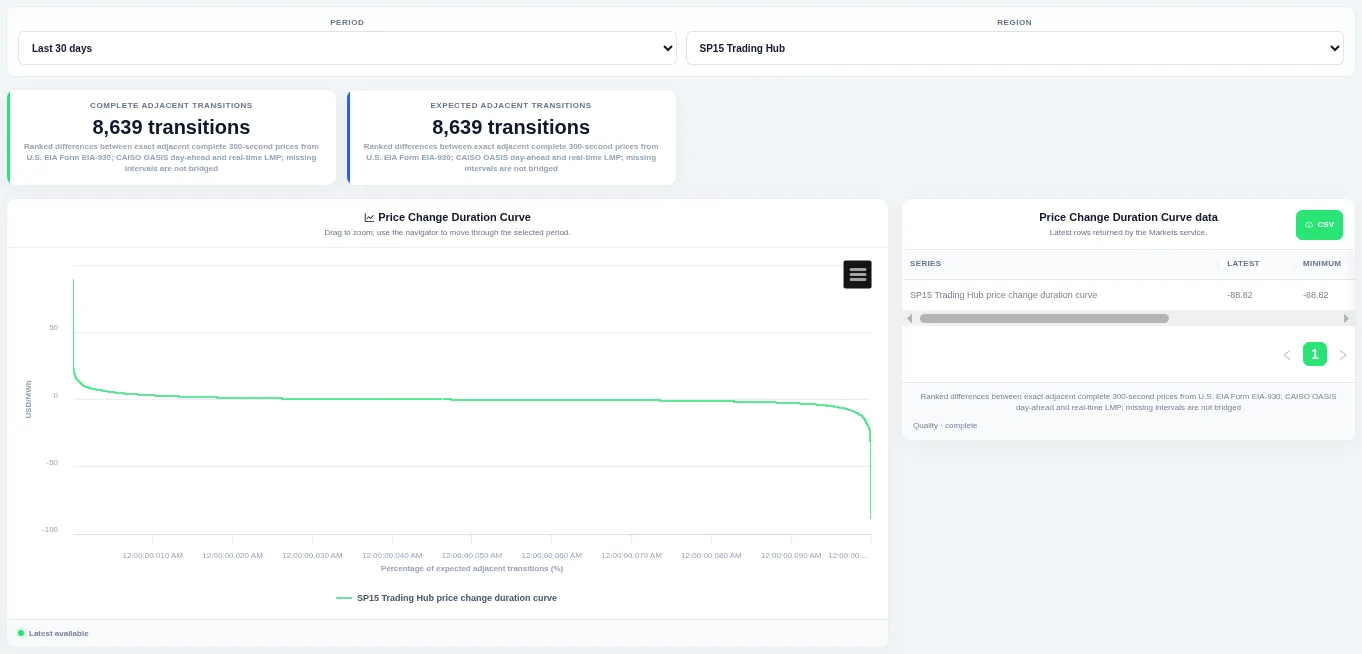
The steep ends of the curve show how often large ramps happen. Choose the period and the region or pricing hub at the top; the table beside the chart lists the rows behind it and can be downloaded as CSV.
Shown for CAISO. Available in: CAISO, MISO, NYISO, ISO-NE, Great Britain, Germany, New Zealand, IESO (Ontario), AESO (Alberta), Ireland (SEM).
Price–Demand Scatter
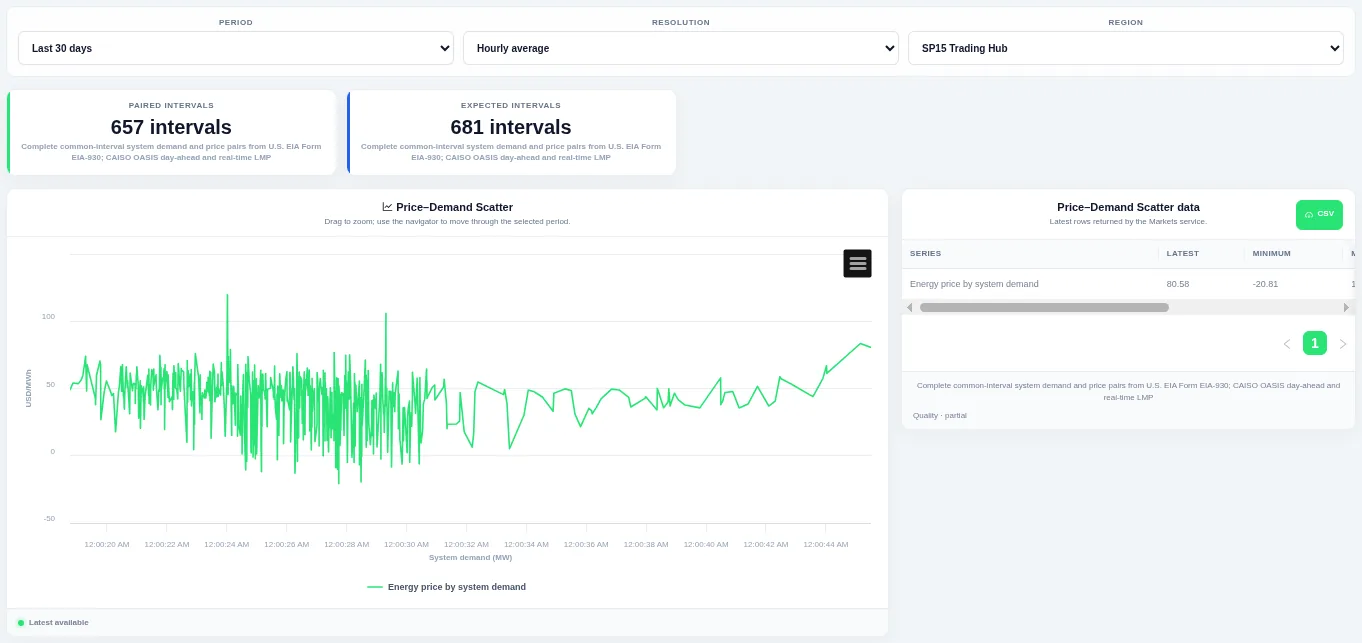
The shape of the point cloud shows how closely the two move together. Choose the period, the resolution and the region or pricing hub at the top; the table beside the chart lists the rows behind it and can be downloaded as CSV.
Shown for CAISO. Available in: CAISO, MISO, NYISO, ISO-NE, Great Britain, Germany, New Zealand, IESO (Ontario), AESO (Alberta), Ireland (SEM).
Price–Generation Scatter
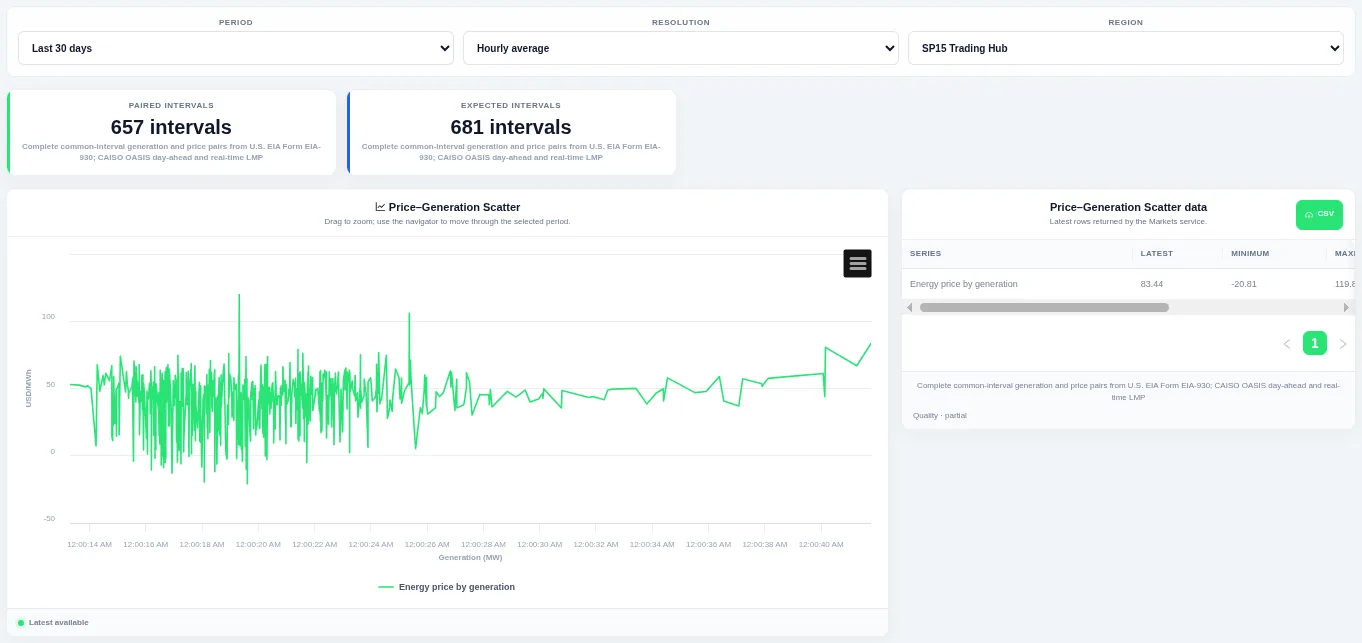
The shape of the point cloud shows how closely the two move together. Choose the period, the resolution and the region or pricing hub at the top; the table beside the chart lists the rows behind it and can be downloaded as CSV.
Shown for CAISO. Available in: CAISO, MISO, NYISO, ISO-NE, Germany, New Zealand, AESO (Alberta), Ireland (SEM).
Price–Interchange Scatter
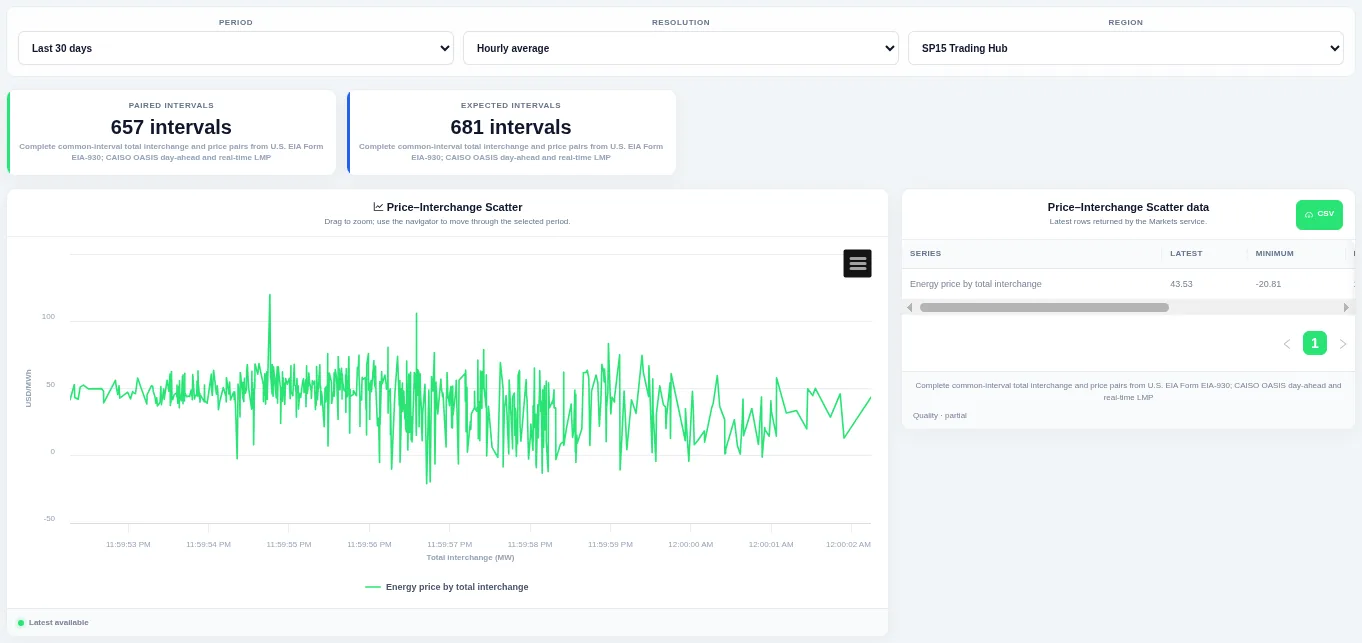
The shape of the point cloud shows how closely the two move together. Choose the period, the resolution and the region or pricing hub at the top; the table beside the chart lists the rows behind it and can be downloaded as CSV.
Shown for CAISO. Available in: CAISO, MISO, NYISO, ISO-NE, Germany, IESO (Ontario).
Locational and day-ahead prices
Nodal Price Map
Published prices at pricing nodes, by market run and price component. Choose the market run, the price component and the region at the top. The view is listed only when nodal price data is available.
Available in: ERCOT, CAISO, MISO, NYISO, ISO-NE, SPP.
Regional LMP Map
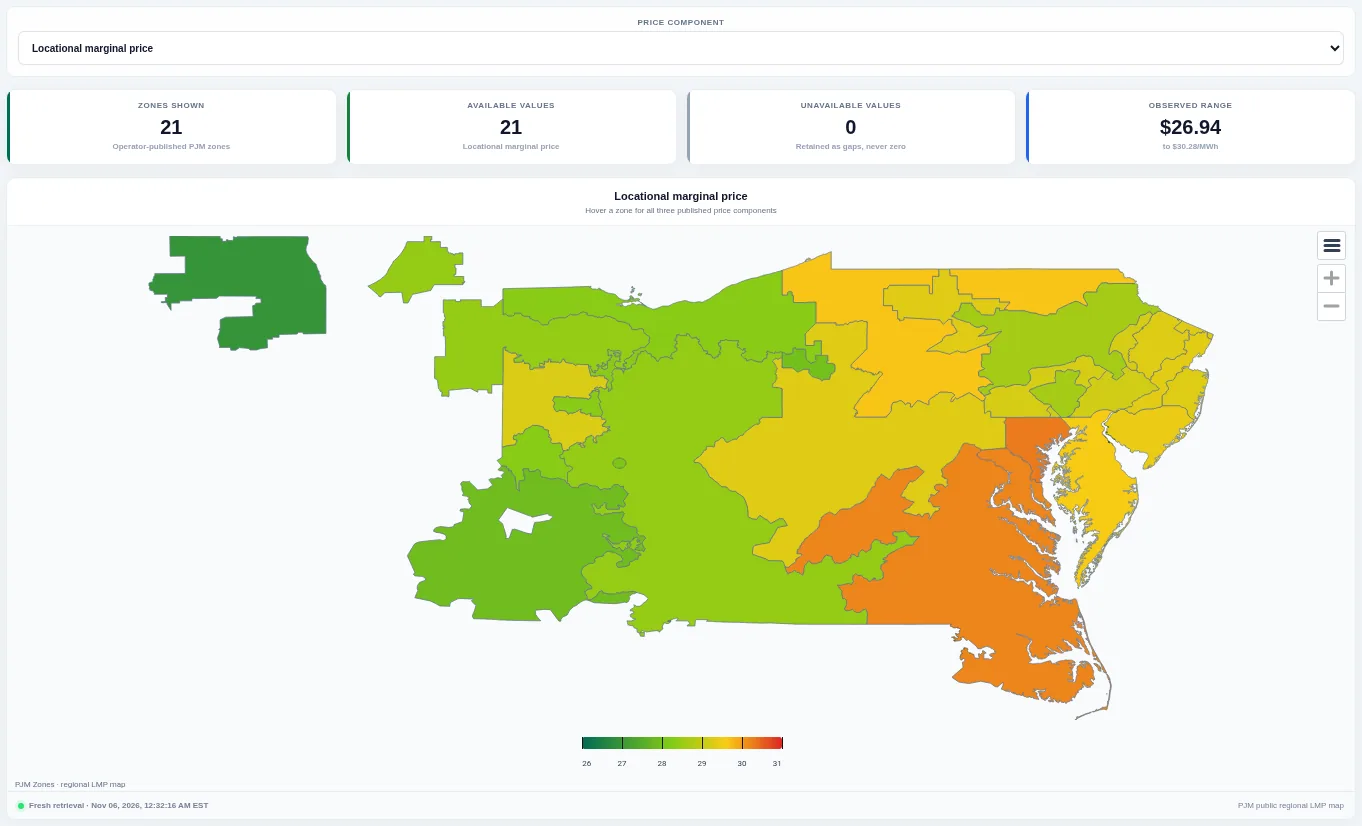
Each zone is shaded by its published price, with cards for priced zones and unavailable values. Choose the price component to switch between the full price and its congestion or loss parts; zones with no value stay grey.
Shown for PJM. Available in: PJM.
Multi-Location LMP
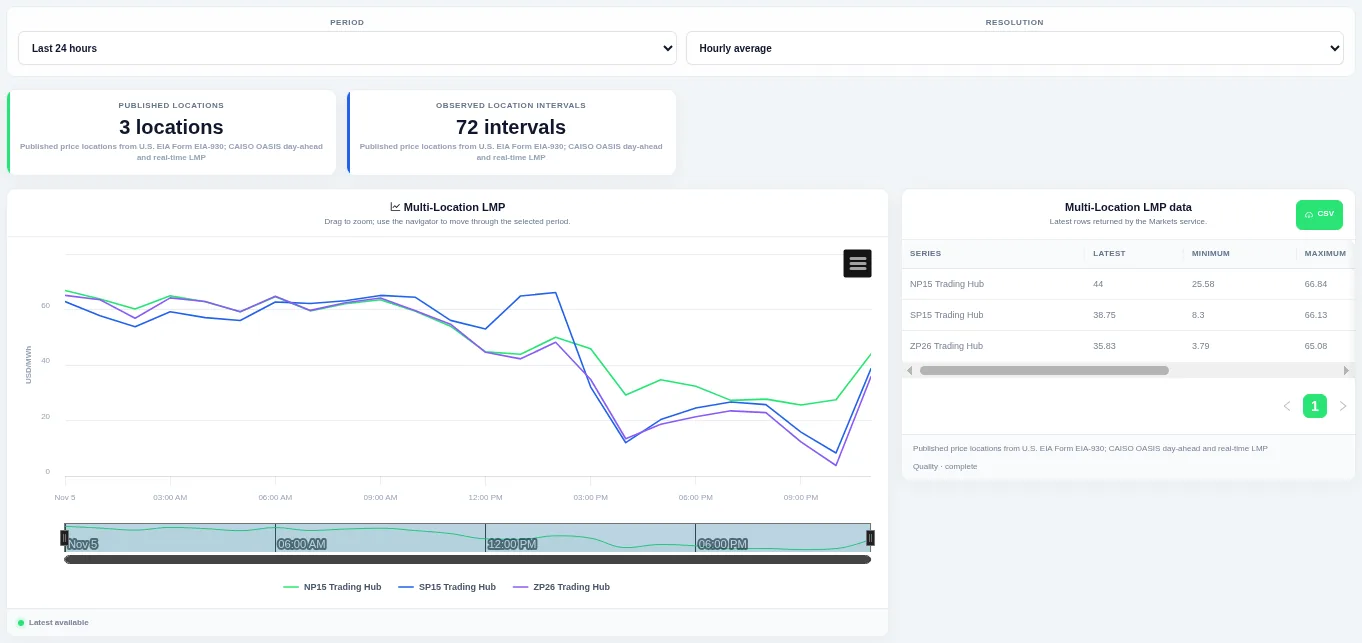
One line per hub so you can see when prices move together and when they separate. Choose the period and resolution at the top and drag to zoom; the table lists the latest, minimum and maximum for each hub.
Shown for CAISO. Available in: CAISO, MISO, NYISO, ISO-NE.
Price Location Spreads
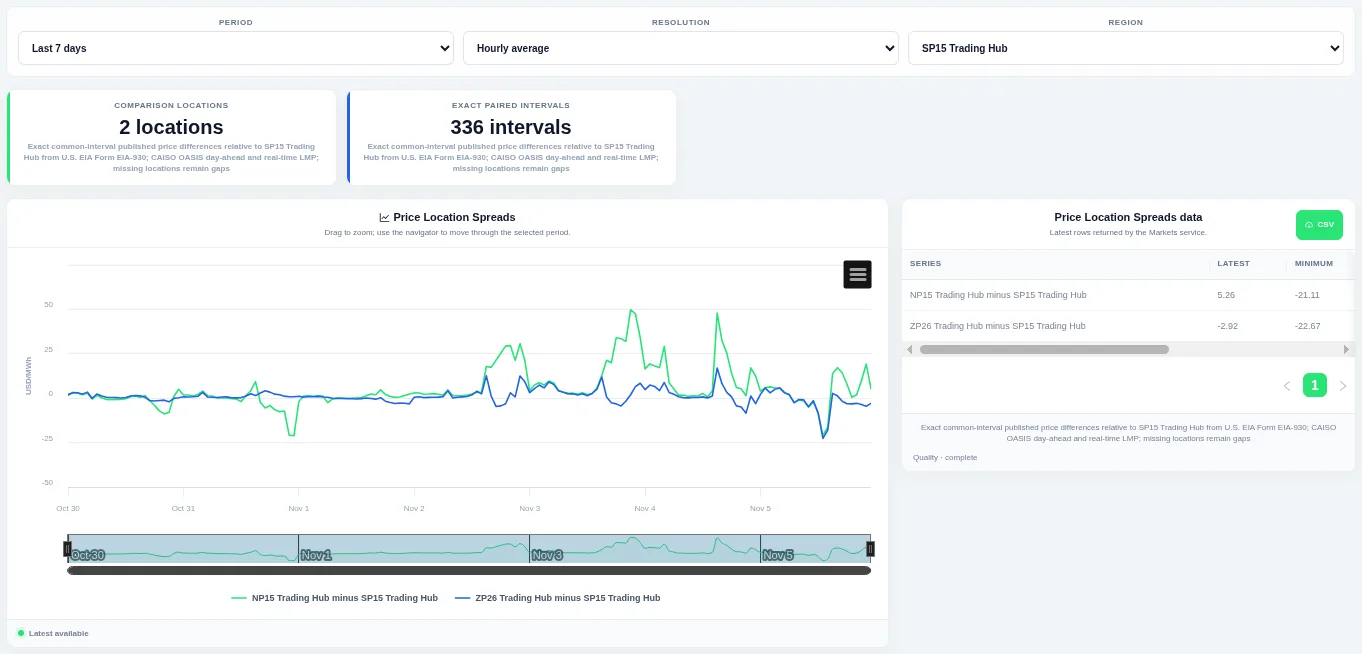
Drag on the chart or the navigator to zoom into part of the period. Choose the period, the resolution and the region or pricing hub at the top; the table beside the chart lists the rows behind it and can be downloaded as CSV.
Shown for CAISO. Available in: CAISO, MISO, NYISO, ISO-NE, New Zealand.
Price Location Spread Duration Curves
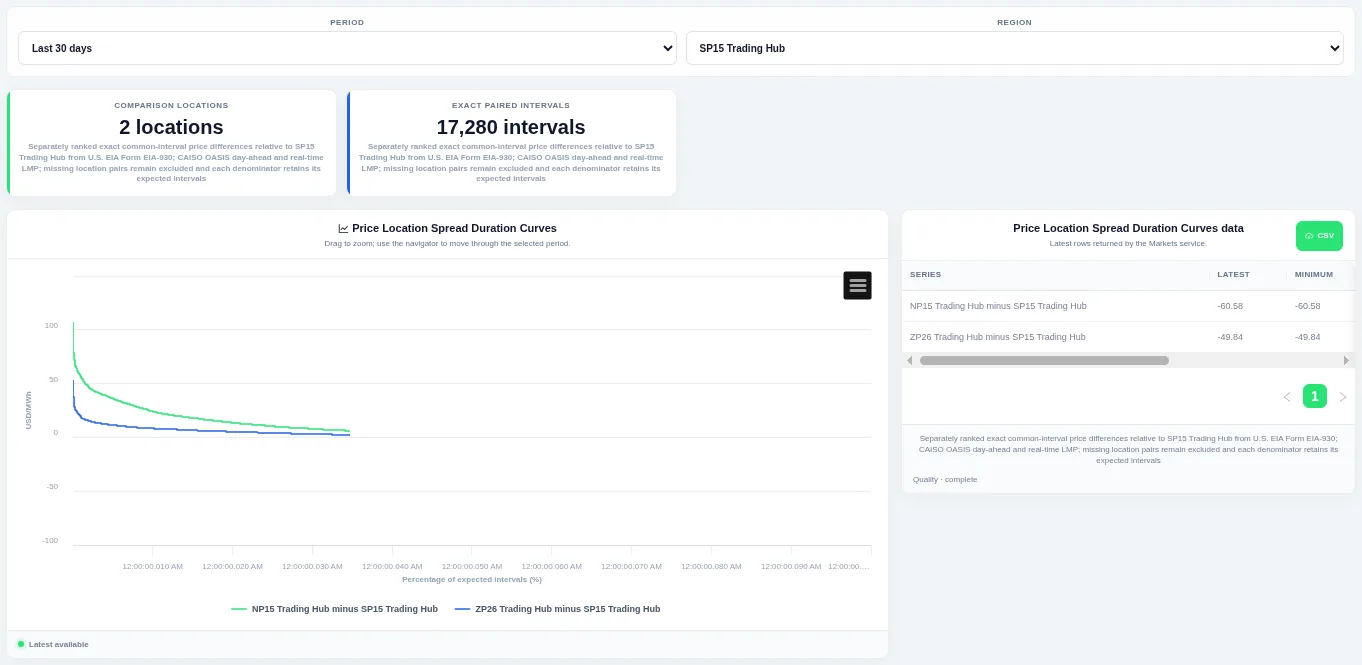
The curve shows how much of the time a level was met or exceeded. Choose the period and the region or pricing hub at the top; the table beside the chart lists the rows behind it and can be downloaded as CSV.
Shown for CAISO. Available in: CAISO, MISO, NYISO, ISO-NE, New Zealand.
Latest Price Location Spreads
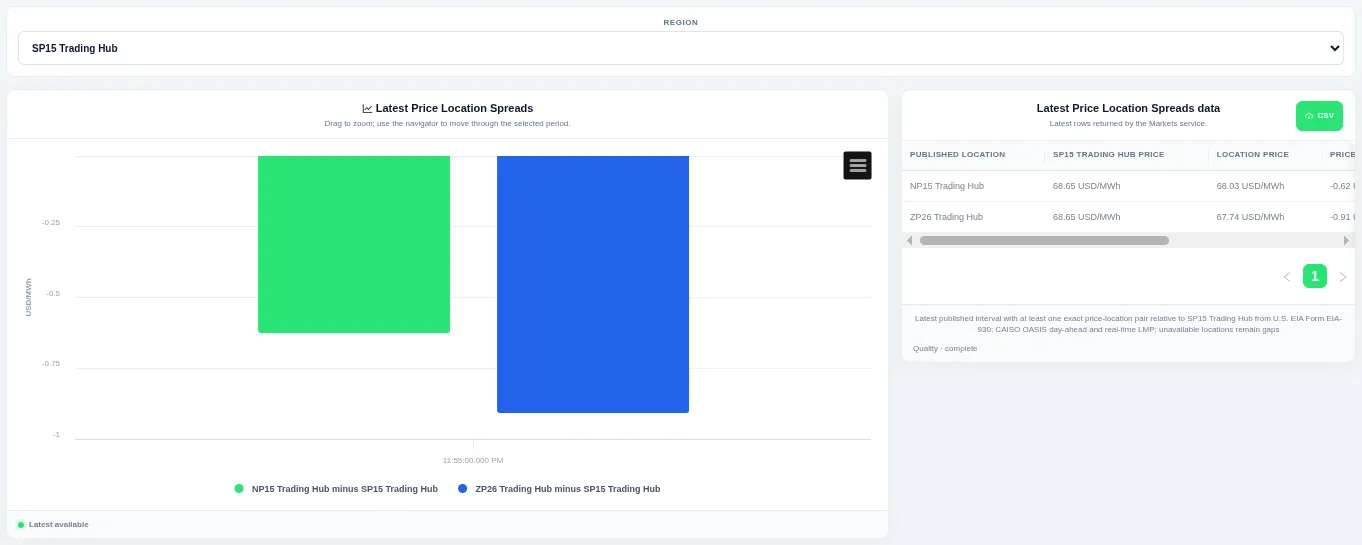
Each bar is one location pair for the most recent interval, in both day-ahead and real-time where published. Choose the pricing hub at the top; locations without a value are left as gaps.
Shown for CAISO. Available in: CAISO, MISO, NYISO, ISO-NE, New Zealand.
Day-Ahead vs Real-Time Prices
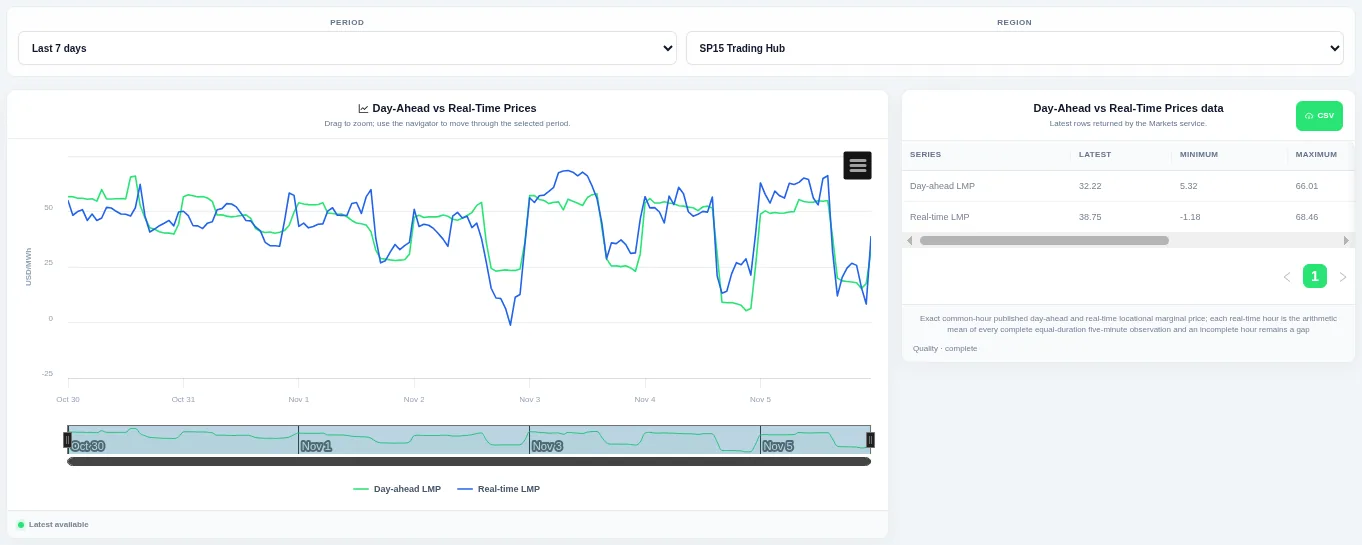
Compare the two market runs interval by interval to see where real-time departed from the day-ahead result. Choose the period and pricing hub at the top and drag to zoom.
Shown for CAISO. Available in: CAISO, NYISO, ISO-NE.
Day-Ahead Price Daily Profiles
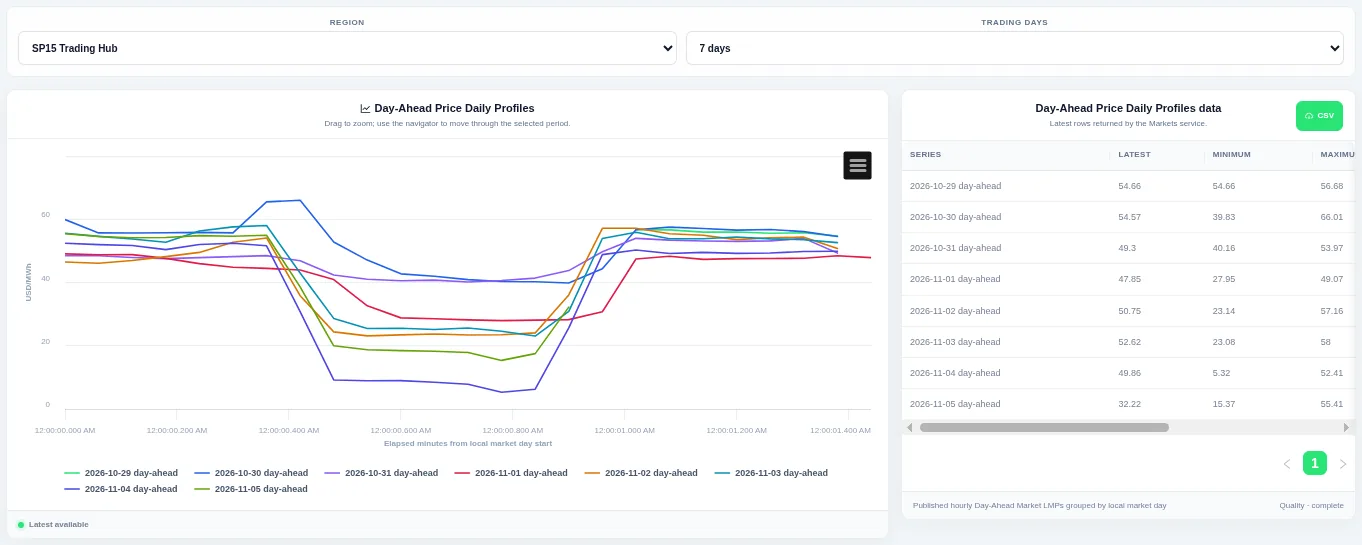
Each line is one trading day, so you can compare the daily price shape. Choose the pricing hub and how many trading days to compare at the top.
Shown for CAISO. Available in: CAISO, NYISO, ISO-NE.
Real-Time Minus Day-Ahead Price
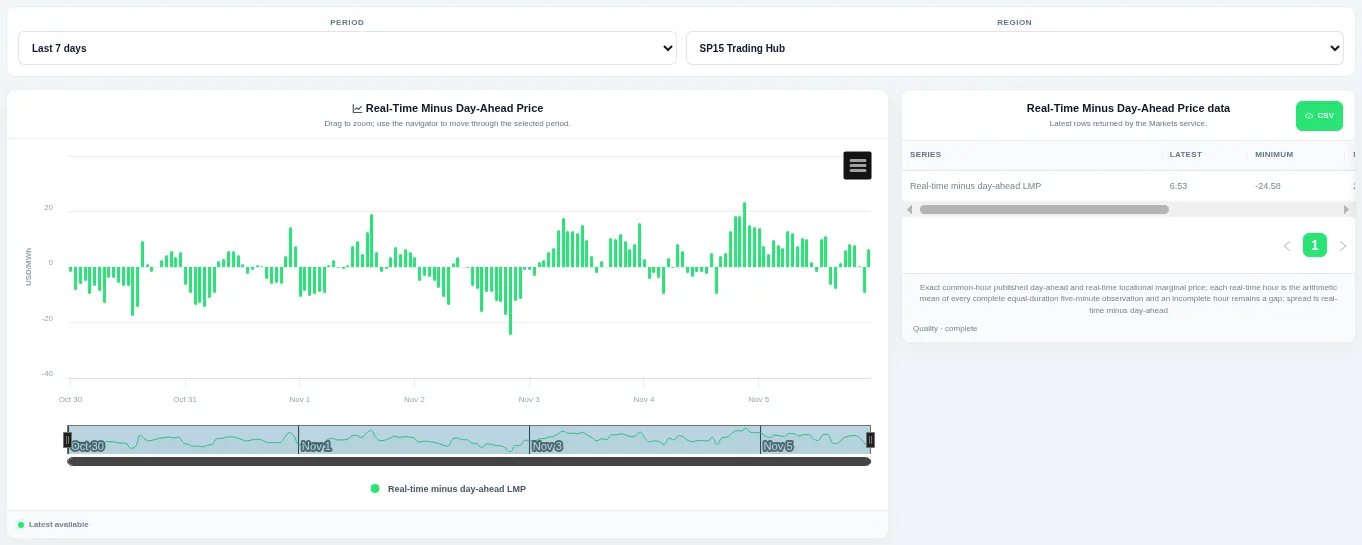
Bars above zero mean real-time cleared above day-ahead, and bars below zero mean it cleared lower. Choose the period and pricing hub at the top and drag to zoom.
Shown for CAISO. Available in: CAISO, NYISO, ISO-NE.
Daily Real-Time Minus Day-Ahead Profiles
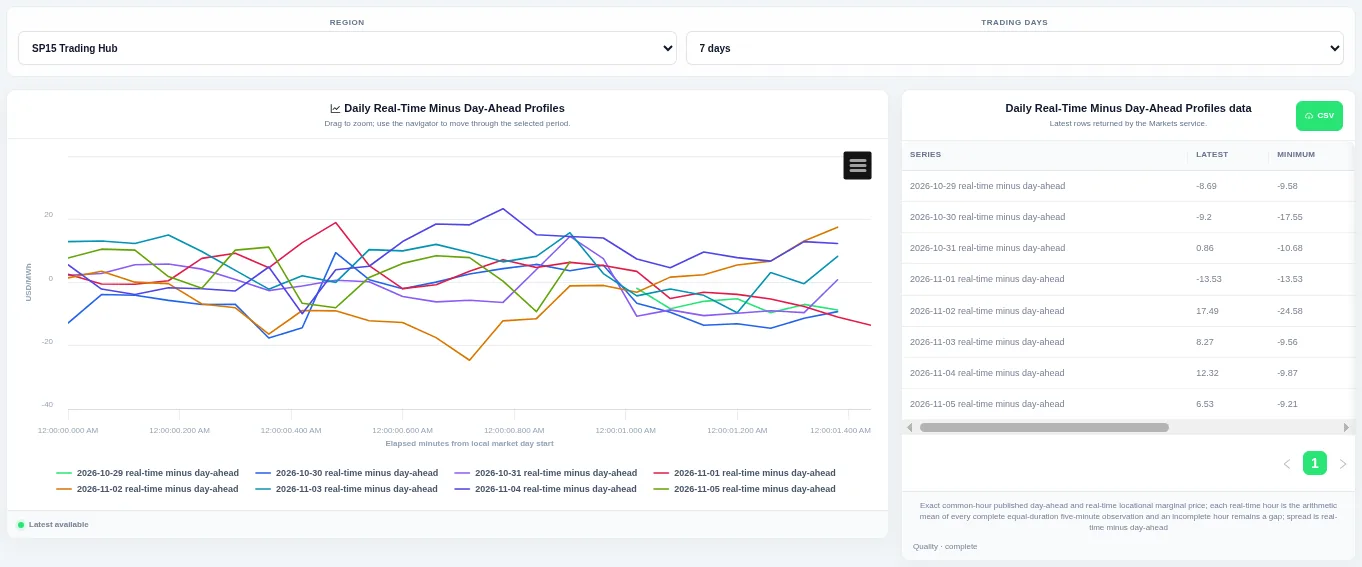
Each line is one trading day, so you can compare the daily shape. Choose the region or pricing hub and how many trading days to compare at the top; the table beside the chart lists the rows behind it and can be downloaded as CSV.
Shown for CAISO. Available in: CAISO, NYISO, ISO-NE.
Real-Time Minus Day-Ahead Heatmap
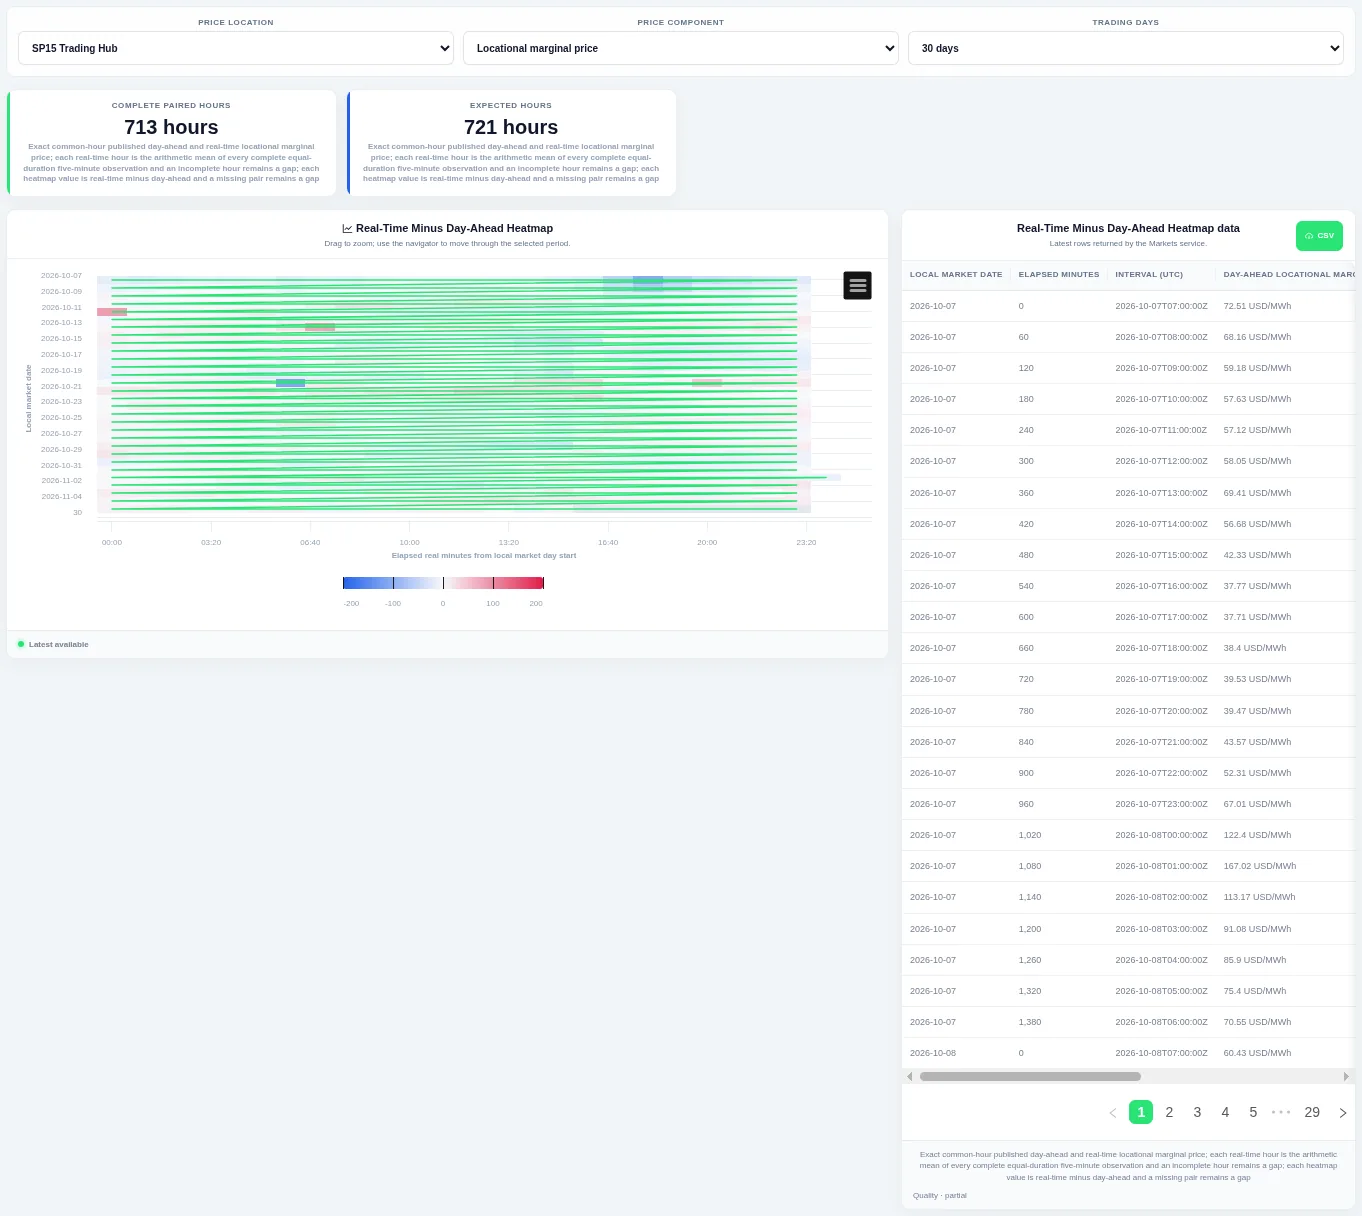
Each row is one trading day and colour shows whether real-time cleared above or below day-ahead. Choose the price location, price component and how many trading days to show at the top.
Shown for CAISO. Available in: CAISO, NYISO, ISO-NE.
Real-Time Minus Day-Ahead Distribution
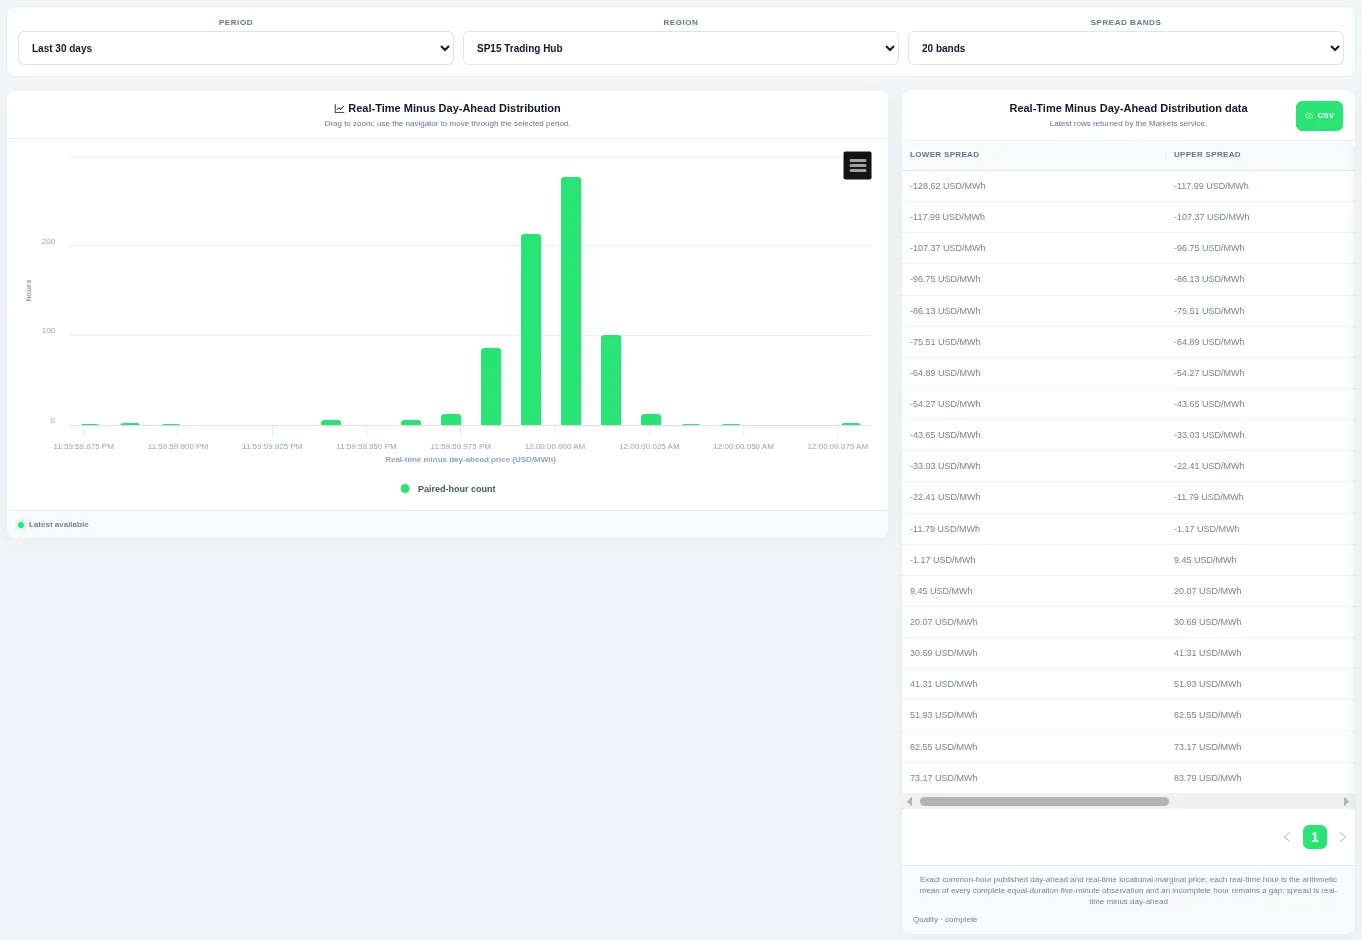
Taller bars show the levels that occur most often over the chosen period. Choose the period, the region or pricing hub and the number of bands at the top; the table beside the chart lists the rows behind it and can be downloaded as CSV.
Shown for CAISO. Available in: CAISO, NYISO, ISO-NE.
Real-Time Minus Day-Ahead Duration Curve
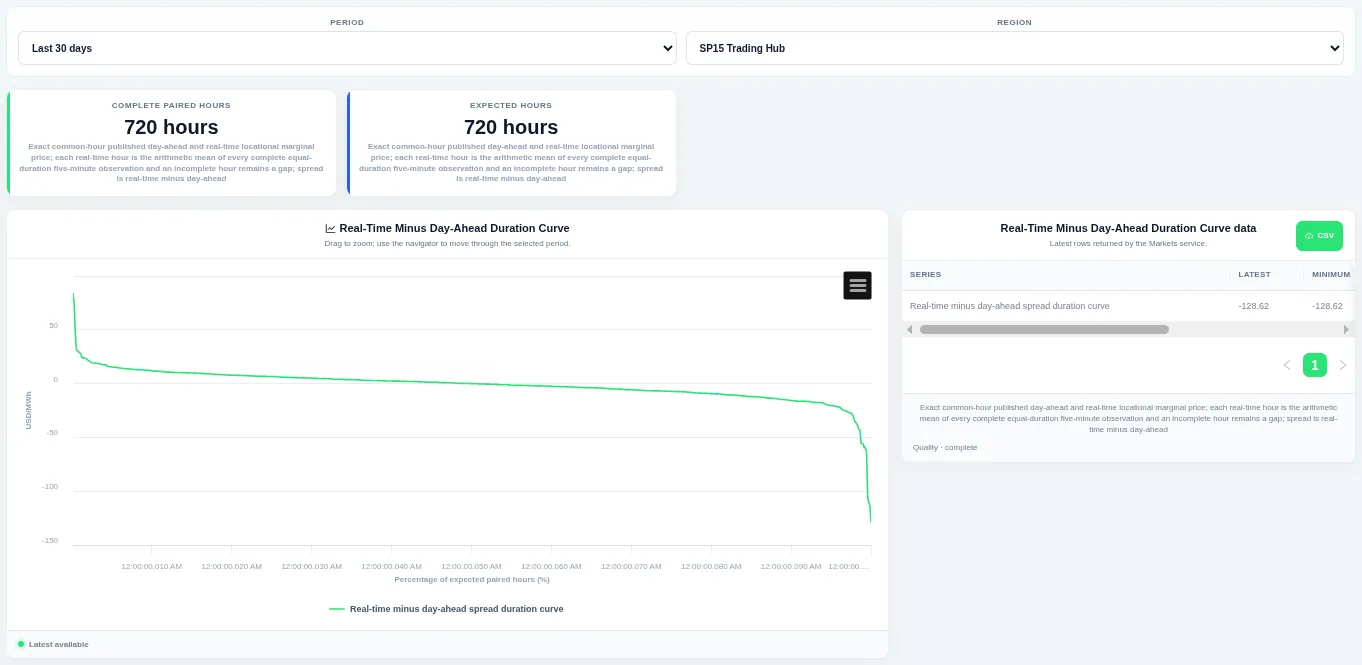
The curve shows how much of the time a level was met or exceeded. Choose the period and the region or pricing hub at the top; the table beside the chart lists the rows behind it and can be downloaded as CSV.
Shown for CAISO. Available in: CAISO, NYISO, ISO-NE.
Day-Ahead–Real-Time Price Scatter
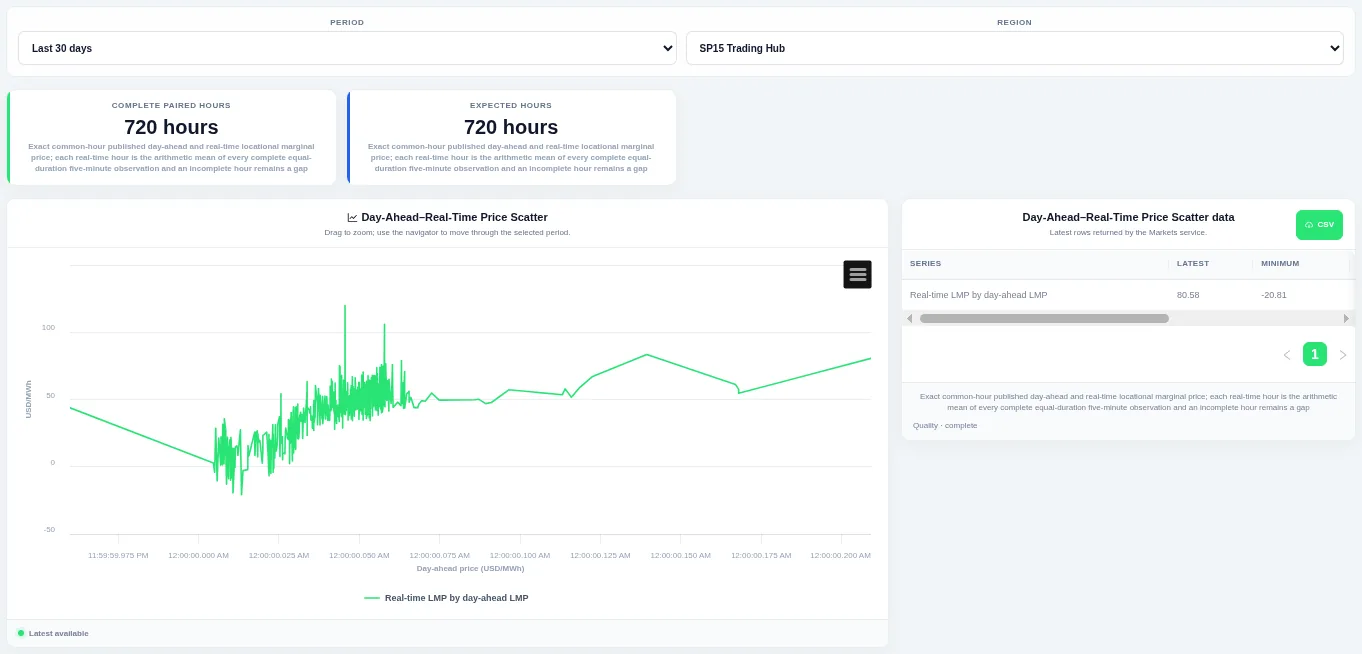
Points near a straight rising line mean the two runs agreed, and points far from it show large surprises. Choose the period and pricing hub at the top.
Shown for CAISO. Available in: CAISO, NYISO, ISO-NE.
Latest Day-Ahead vs Real-Time Prices
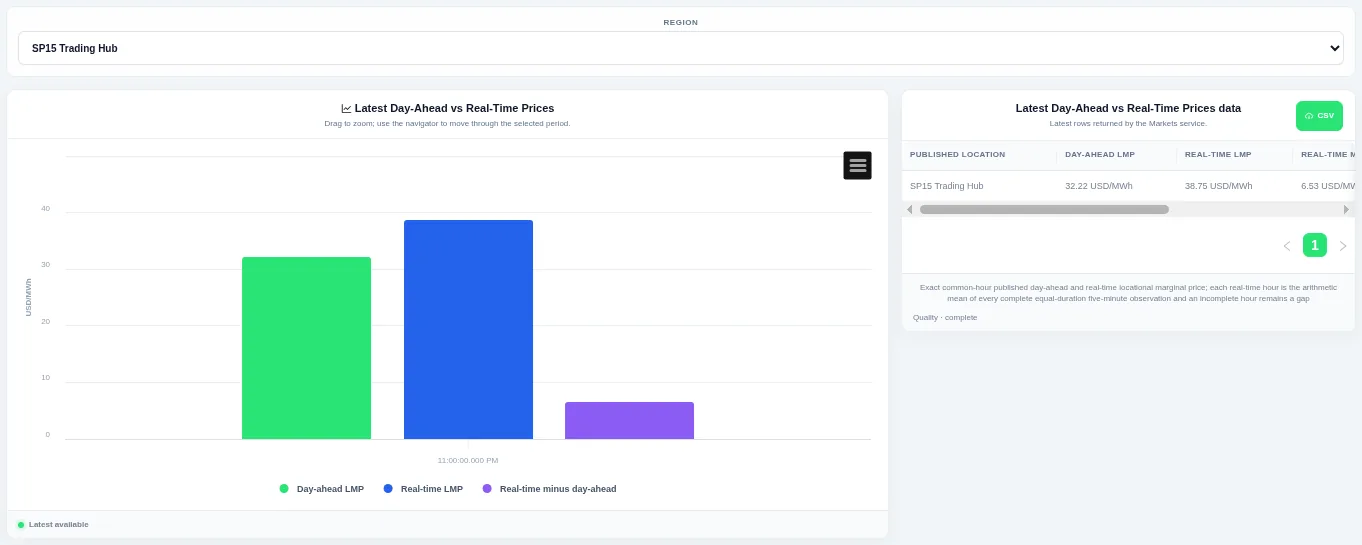
Bars show the two prices and their difference for the most recent interval. Choose the pricing hub at the top; the table gives the interval time for each value.
Shown for CAISO. Available in: CAISO, NYISO, ISO-NE.
Real-Time LMP Components
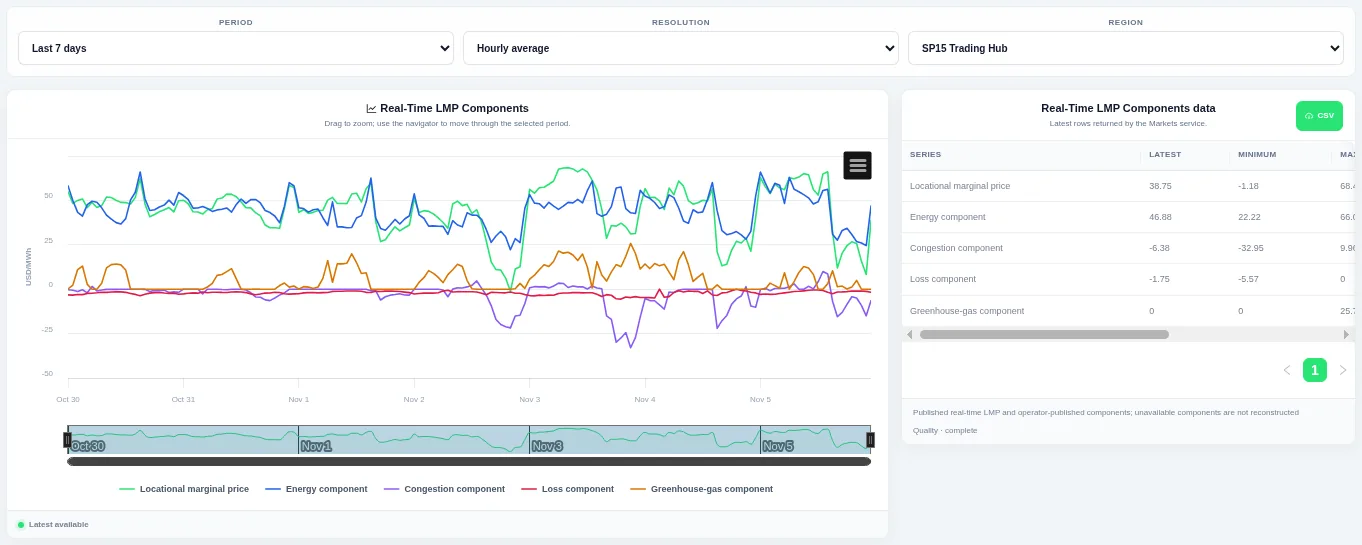
Each component has its own line beside the total price, so you can see what drove a price move. Choose the period, resolution and pricing hub at the top; components the operator does not publish are left out, not rebuilt.
Shown for CAISO. Available in: CAISO, NYISO, ISO-NE.
Day-Ahead LMP Components
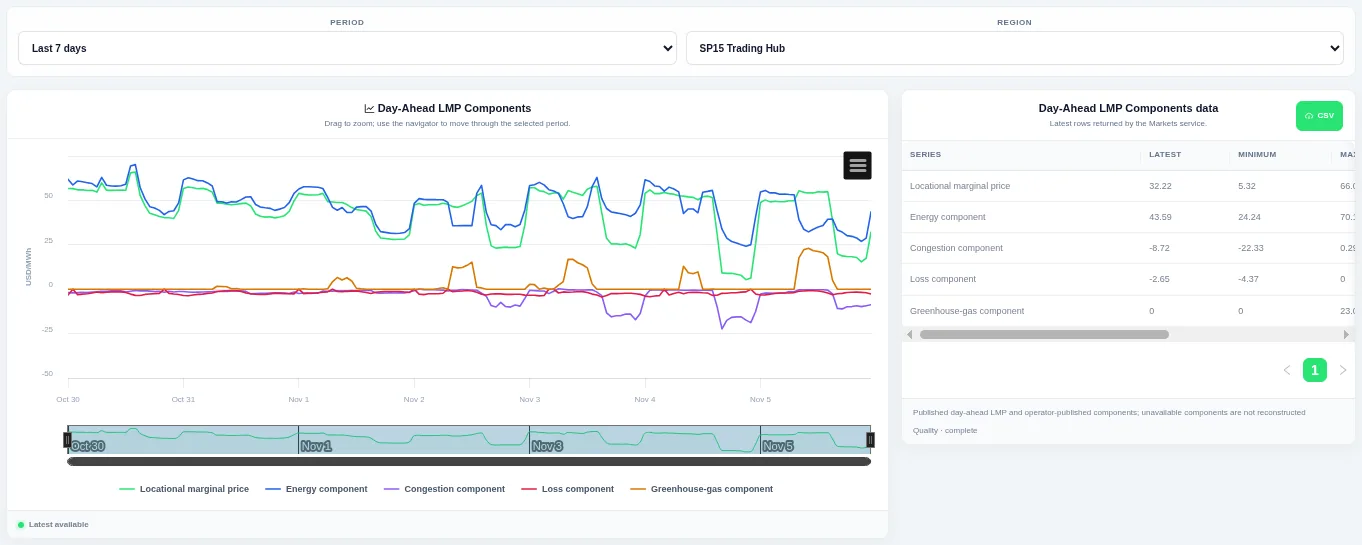
Each component has its own line beside the total price, so you can see what drove a price move. Choose the period and pricing hub at the top; components the operator does not publish are left out, not rebuilt.
Shown for CAISO. Available in: CAISO, NYISO, ISO-NE.
Price Location Comparison
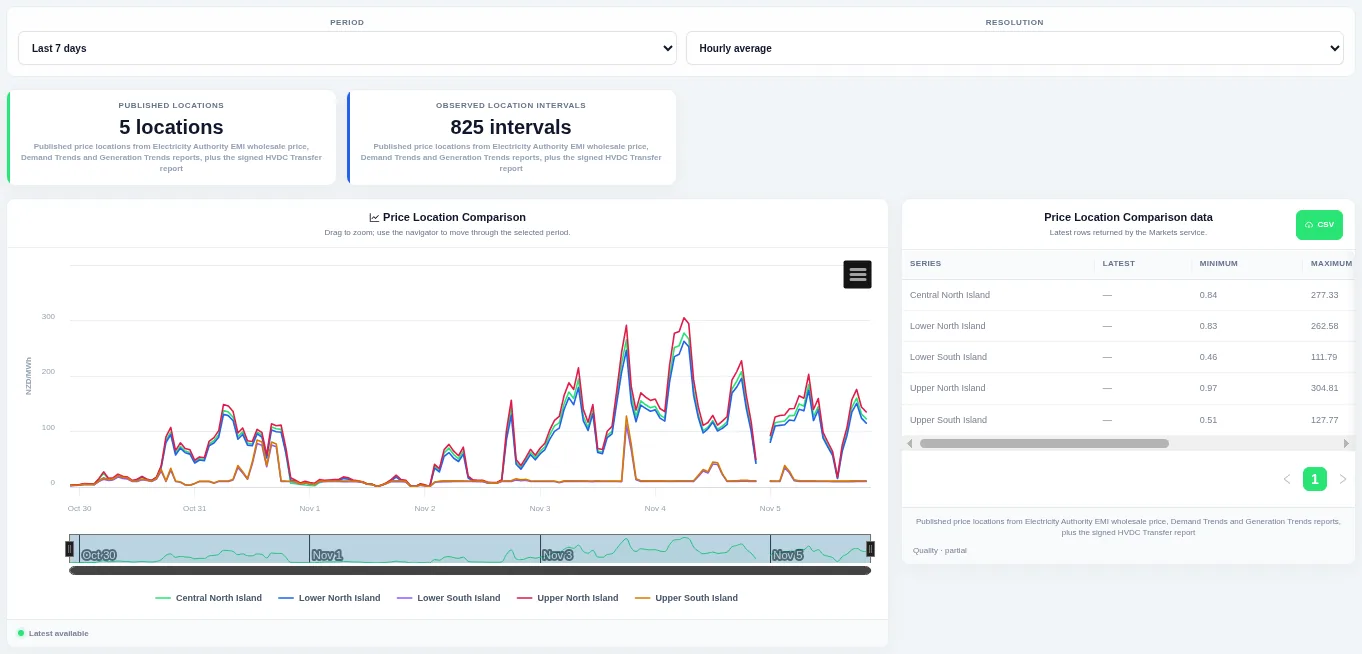
One line per location so you can see when prices move together and when they separate. Choose the period and resolution at the top and drag to zoom; the table lists the latest, minimum and maximum for each location.
Shown for New Zealand. Available in: New Zealand.
Market-specific
Aggregated Final Physical Notification
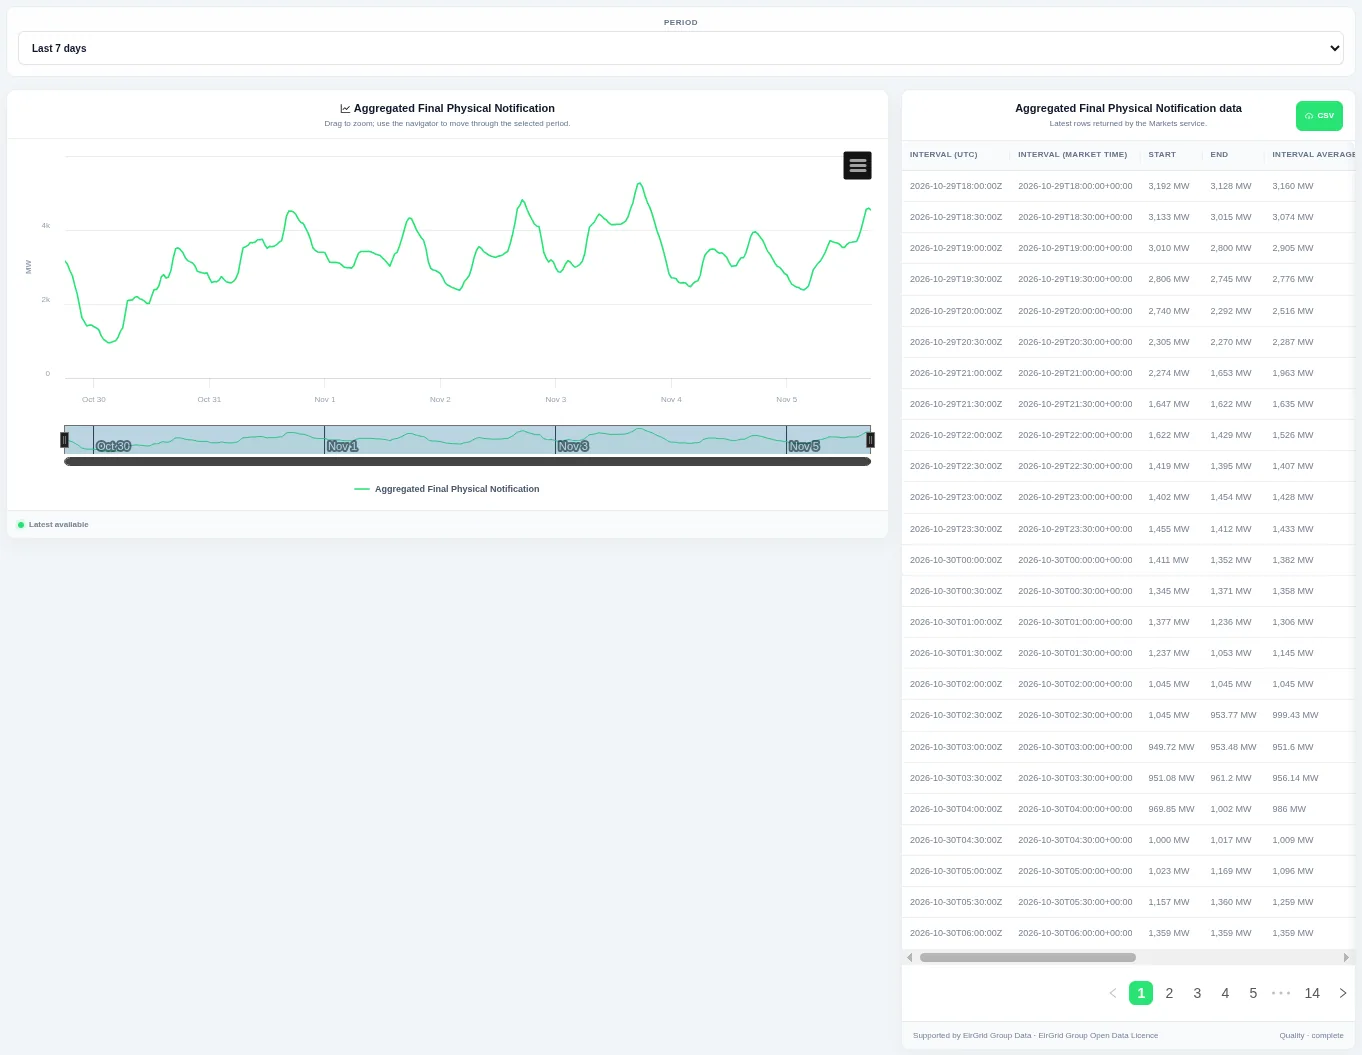
This is the total of submitted final physical notifications, not actual generation or demand. Choose the period at the top and drag to zoom; the table lists each settlement interval in UTC and market time with its start, end and average.
Shown for Ireland (SEM). Available in: Ireland (SEM).


