

Curtailment and Missed Revenue, by Cause
See how much energy each wind and solar unit could have generated and was not dispatched, why, and what that cost at the regional price: network, economic or unknown, with the evidence behind every cause.
Operator data, never estimated • ISO/IEC 27001 certified • Cancel anytime
Revenue Truth at the Connection Point
Missed revenue values curtailed energy at the regional reference price of each 5-minute dispatch interval. Pair it with loss-factor unit revenue (via API) and you have both sides of what a connection point earns.
Every Megawatt-Hour Has a Stated Cause
Curtailment is the market operator's unconstrained forecast for the unit minus the energy it was dispatched. Network Map then proves the cause from the market operator's own records: a binding constraint on the unit (network), a regional price below the unit's offer (economic), or neither provable (unknown).
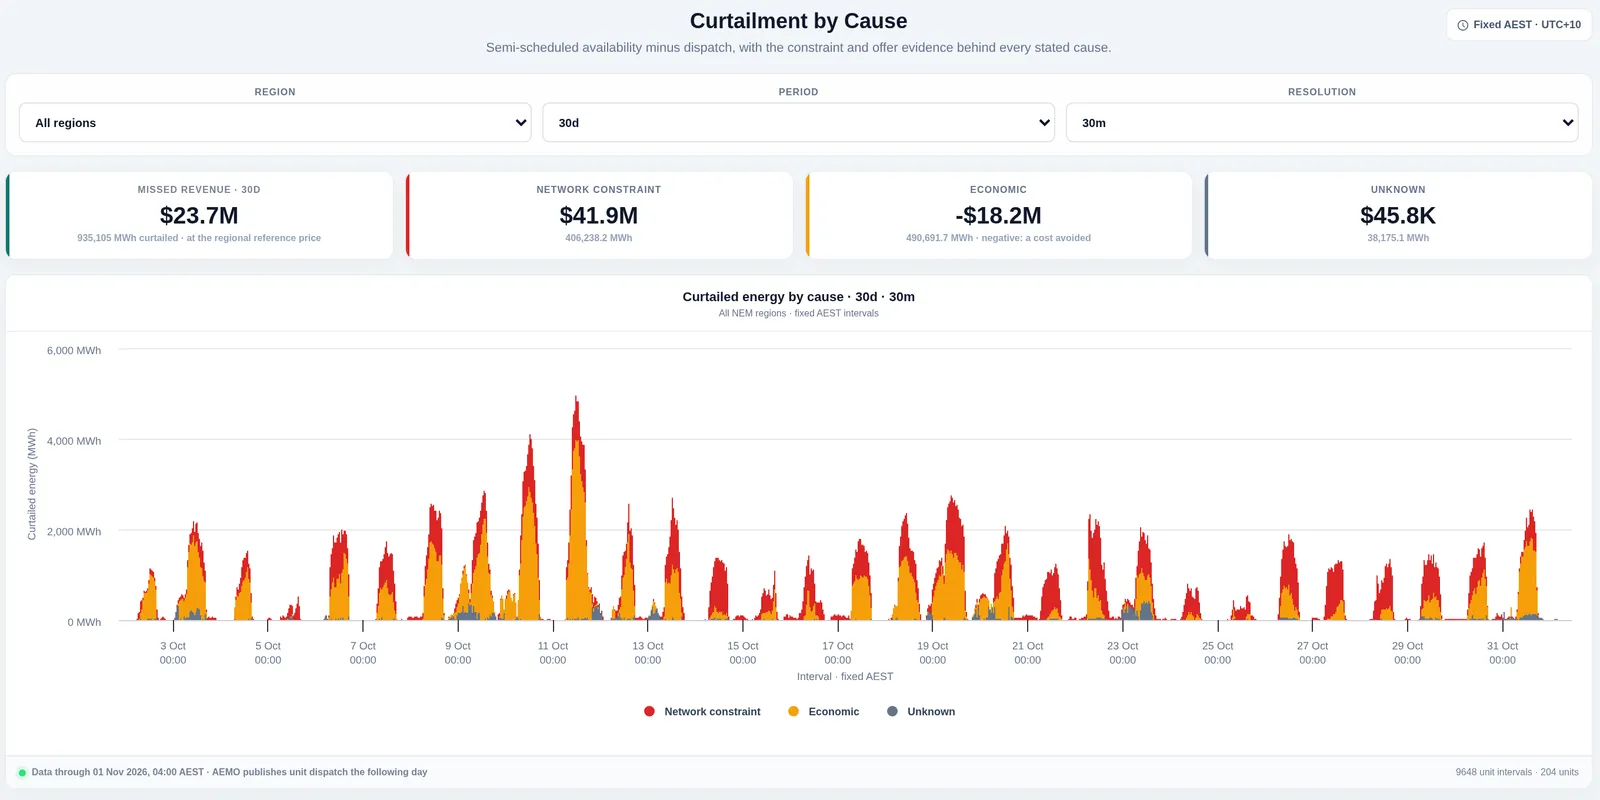
Live Total: All Regions
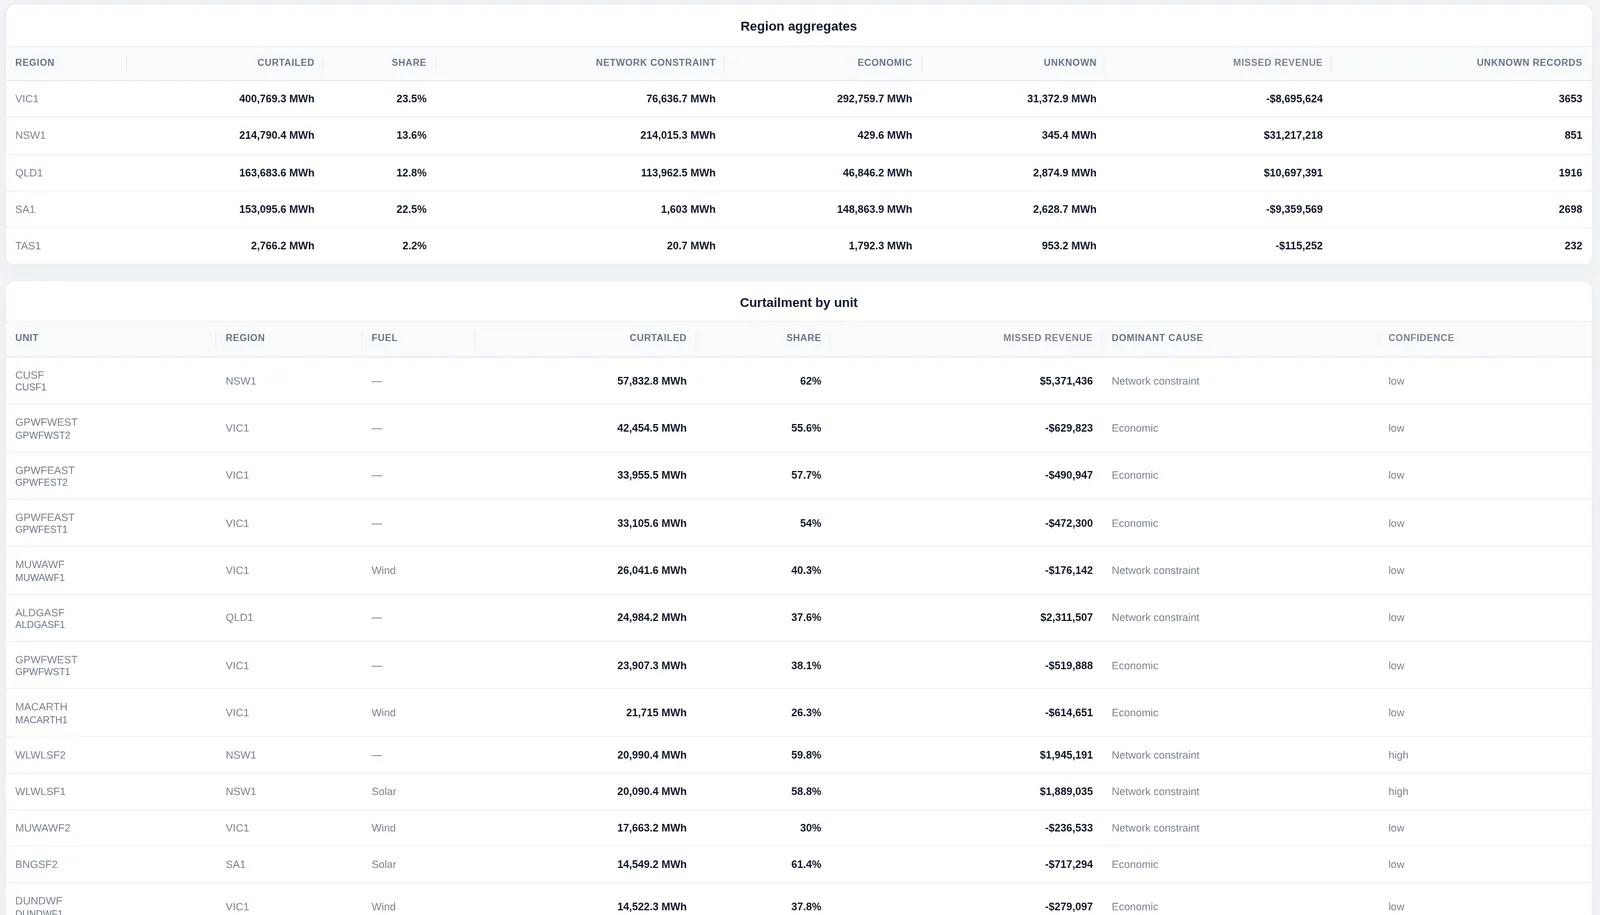
204 semi-scheduled units across five regions. Missed revenue is valued at the regional reference price for each curtailed five-minute interval. Economic curtailment mostly happens at negative prices, so its value is negative: a cost avoided.
| Region | Curtailed | Share | Network | Economic | Missed revenue |
|---|---|---|---|---|---|
| NSW1 | 214,790 MWh | 13.6% | A$31,185,322 | −A$3,729 | A$31,217,218 |
| QLD1 | 163,684 MWh | 12.8% | A$10,939,983 | −A$351,500 | A$10,697,391 |
| VIC1 | 400,769 MWh | 23.5% | −A$229,567 | −A$8,418,192 | −A$8,695,624 |
| SA1 | 153,096 MWh | 22.5% | A$20,650 | −A$9,340,172 | −A$9,359,569 |
| TAS1 | 2,766 MWh | 2.2% | −A$481 | −A$103,931 | −A$115,252 |
Unknown cause: 38,175 MWh (4.08%), A$45,780. 217,375 curtailed unit-intervals valued. Source: the market operator's next-day dispatch (UIGF and cleared MW), dispatch constraint solutions, the daily offer stack and regional prices; GET /v1/markets/nem/curtailment?period=30d, read 1 Nov 2026 10:34 UTC.
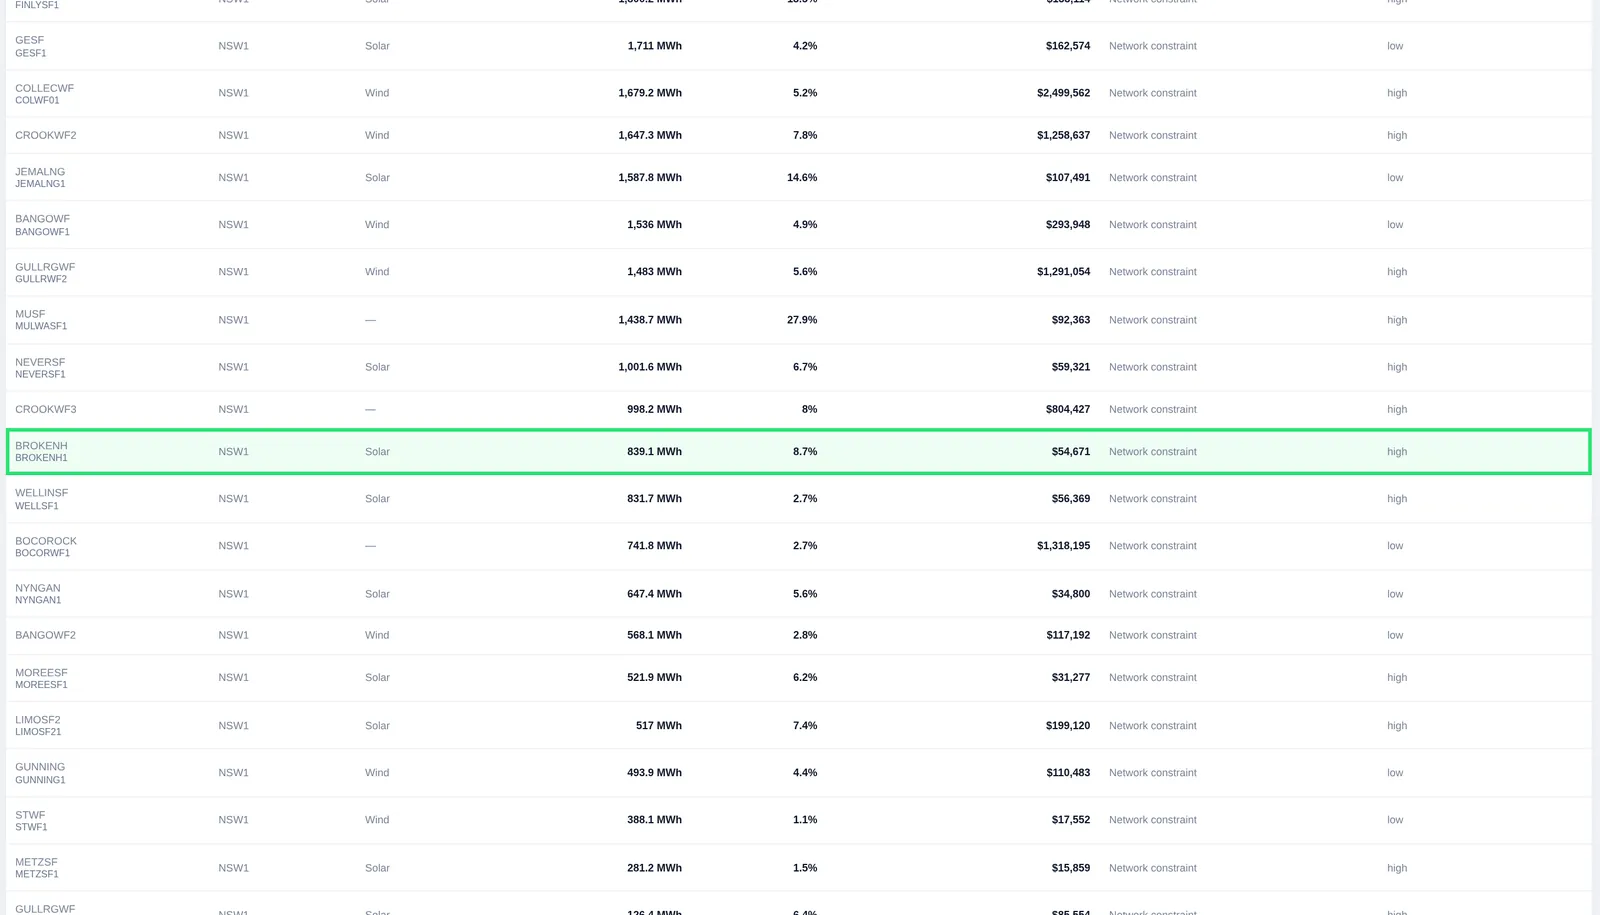
One Unit: Broken Hill Solar Farm (BROKENH1)
The constraints that proved the network cause are listed with the unit, so you can follow them back to the equation and the line.
Proving constraints: F_I+TTS_TG_R5, F_I+TTS_TG_R6, F_I+TTS_TG_R60, F_MAIN+TTS_TG_R5, F_MAIN+TTS_TG_R60, N>NIL_BHTX_LV, N_BROKENH1_0INV, N_BROKENHSF_FLT_30.
What Pro Shows You
Cause with Evidence
Network, economic or unknown for every curtailed interval, with the binding constraints or the offer comparison that proves it.
Missed Revenue by Cause
Valued at the regional price for each interval, split by cause, per unit, region and period.
Units and Regions
Per-unit and per-region totals for 24 hours, 7 days or 30 days at 5-minute, 30-minute or hourly resolution.
Who It's for
Developers Screening a Connection Point
See how much nearby wind and solar is already curtailed, and why, before you add more.
Asset Owners
Separate the curtailment the network imposes from the curtailment your own offers choose.
Consultants and Lenders' Advisers
Bring a dated, cause-attributed record to a due diligence discussion.
Included with Pro, US$150/month
Curtailment by cause and missed revenue are part of Pro and Enterprise. They are never part of the free tools.
Know How the Grid Treats a Site
More of the observed record behind a connection point.
Start Free, Upgrade When You Need the Evidence
Analyst US$75 a month · Pro US$150 a month · Annual plans 15% off: US$765 and US$1,530 a year.
Self-serve: pay by card or company invoice, no demo needed · Cancel anytime


