

Network Map Solutions · Early-stage site assessment
Data Centre Site Screening
Build a clearer shortlist. Move projects forward.
Bring power networks, parcel boundaries and fibre links into one map. Compare candidate locations, measure proximity and share a consistent view with your project team.
Open or download the video (MP4, 12.3 MB) · English descriptive captions (VTT)
Video transcript and source notes — 47-second walkthrough
Compare sites, explore the surrounding networks and bring the details into your project. This 46.7-second walkthrough starts with the comparison view. ACT footage captured on plays at 1.5× with same-frame detail views and short frame holds. Music plays at its original tempo; there is no speech. Timestamps below follow the video.
00:00.000–00:09.333 — Compare on a consistent basis
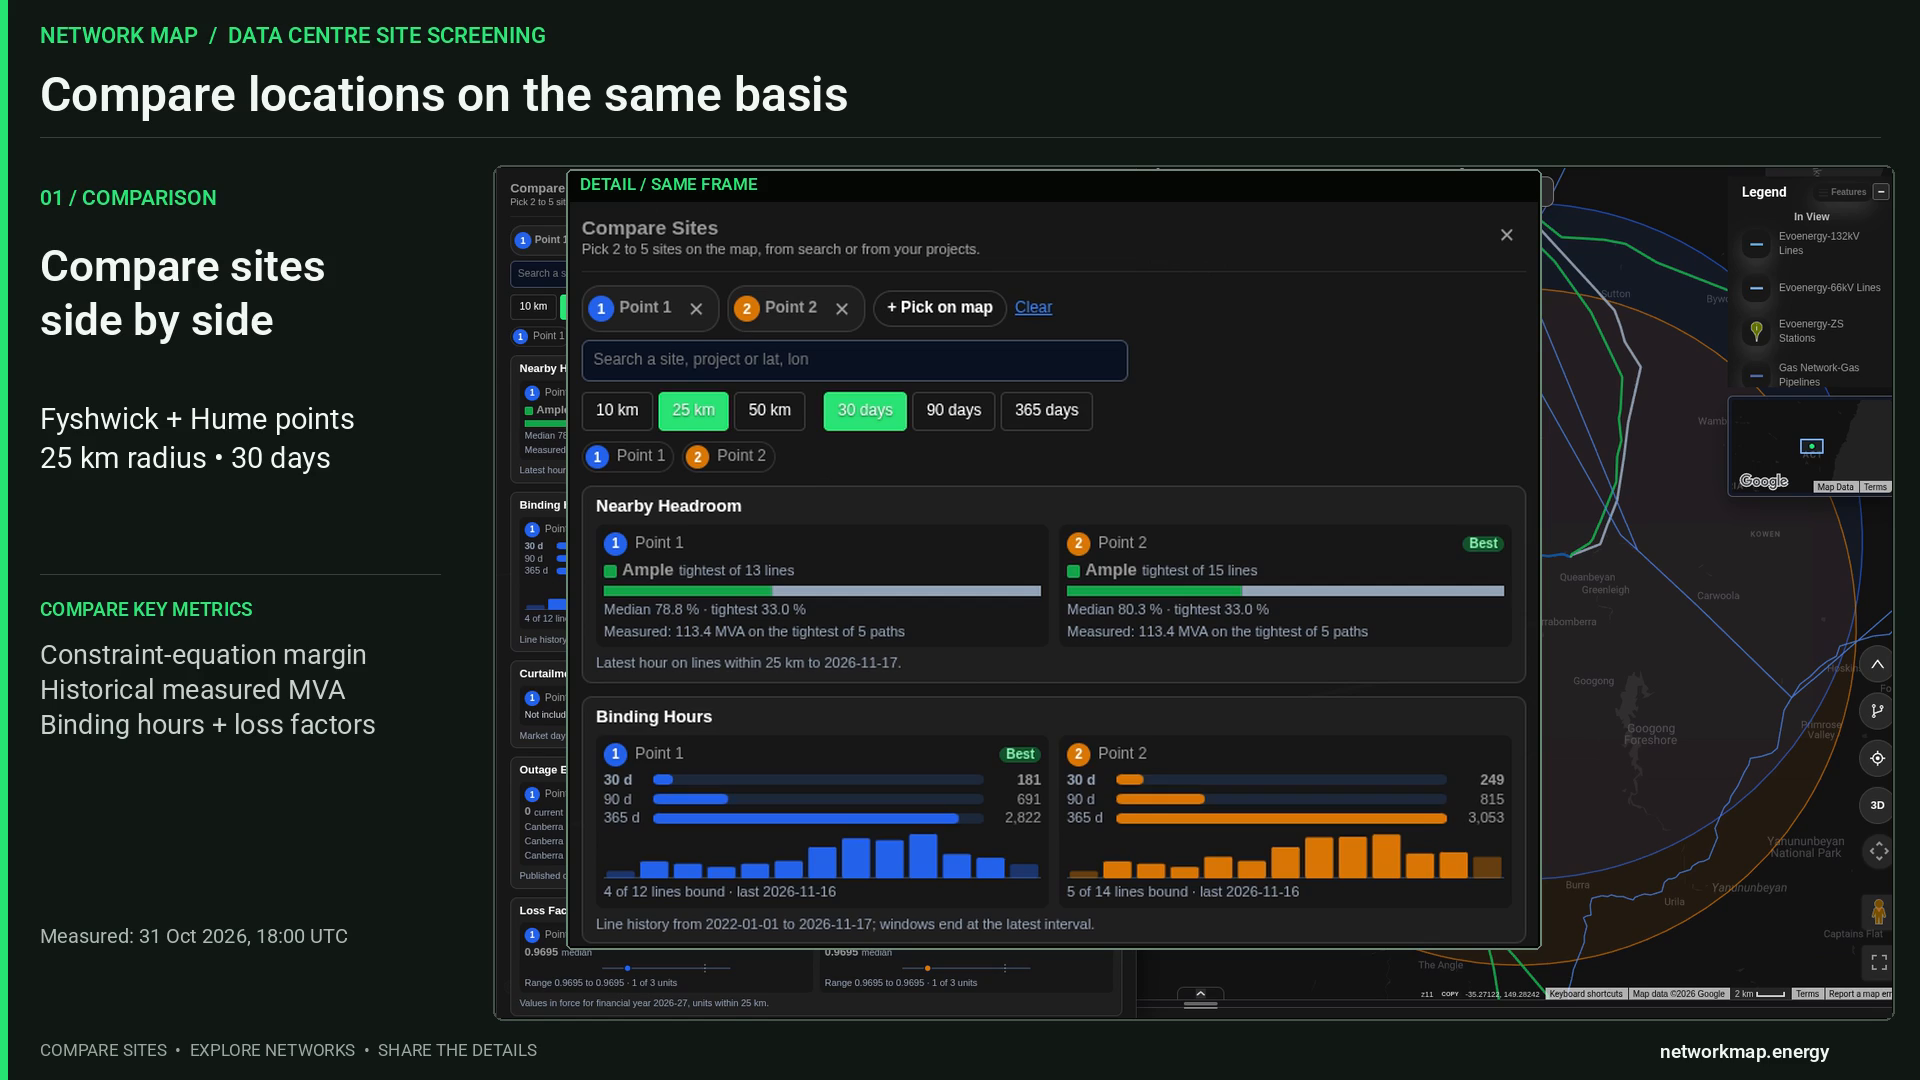
Compare Point 1 in Fyshwick with Point 2 in Hume using the same 25 km radius and 30-day window, from to . The comparison response is dated .
- Constraint-equation margin: derived headroom, calculated as the equation’s right-hand side minus its left-hand side, in the equation’s own unit.
- Historical measured MVA: the recorded comparison displays 113.4 MVA with a telemetry timestamp of .
- Binding hours: counts summed across nearby lines, with separately labelled 30-day, 90-day and 365-day periods.
- Comparison labels: “Best” identifies a per-metric comparison, and “Ample” is a display band.
- Source periods: the published outage list is dated ; loss factors apply to financial year 2026–27.
00:09.333–00:14.667 — Network context
Explore the Canberra area with Evoenergy zone substations and mapped 132 kV and 66 kV lines. The original map and imagery credits remain visible.
00:14.667–00:22.667 — Parcel context
Satellite imagery and the cadastral popup bring ACT Block 43, Section 27, Fyshwick into view. The popup uses “Lot” for ACT Block. The source lifecycle label is REGISTERED.
Source: ACTmapi © Australian Capital Territory, licensed under Creative Commons Attribution 4.0 International (CC BY 4.0). This video crops and enlarges views, shows footage at 1.5× and adds explanatory captions. Recorded parcel values and geometry are retained.
00:22.667–00:29.333 — Indicative fibre-network links
Green lines show indicative inter-city fibre-network links from the ITU-sourced layer ITU:trx_public_2. Explore this connectivity layer alongside power-network and location context.
00:29.333–00:36.000 — Straight-line proximity
The native measurement tool shows 293.86 m, approximately 294 m, from a selected map point to the mapped Fyshwick Zone Substation, labelled 66 kV. This is a separate straight-line measurement example from the parcel scene.
00:36.000–00:42.667 — Export for follow-up
Export a two-row comparison CSV for follow-up and project discussions. Pair it with the original comparison JSON and source notes for supporting dates and metric definitions.
00:42.667–00:46.667 — Build your shortlist
The closing card reads “Compare sites. Build your shortlist.” Data Centre Site Screening brings network, land and connectivity into one view.
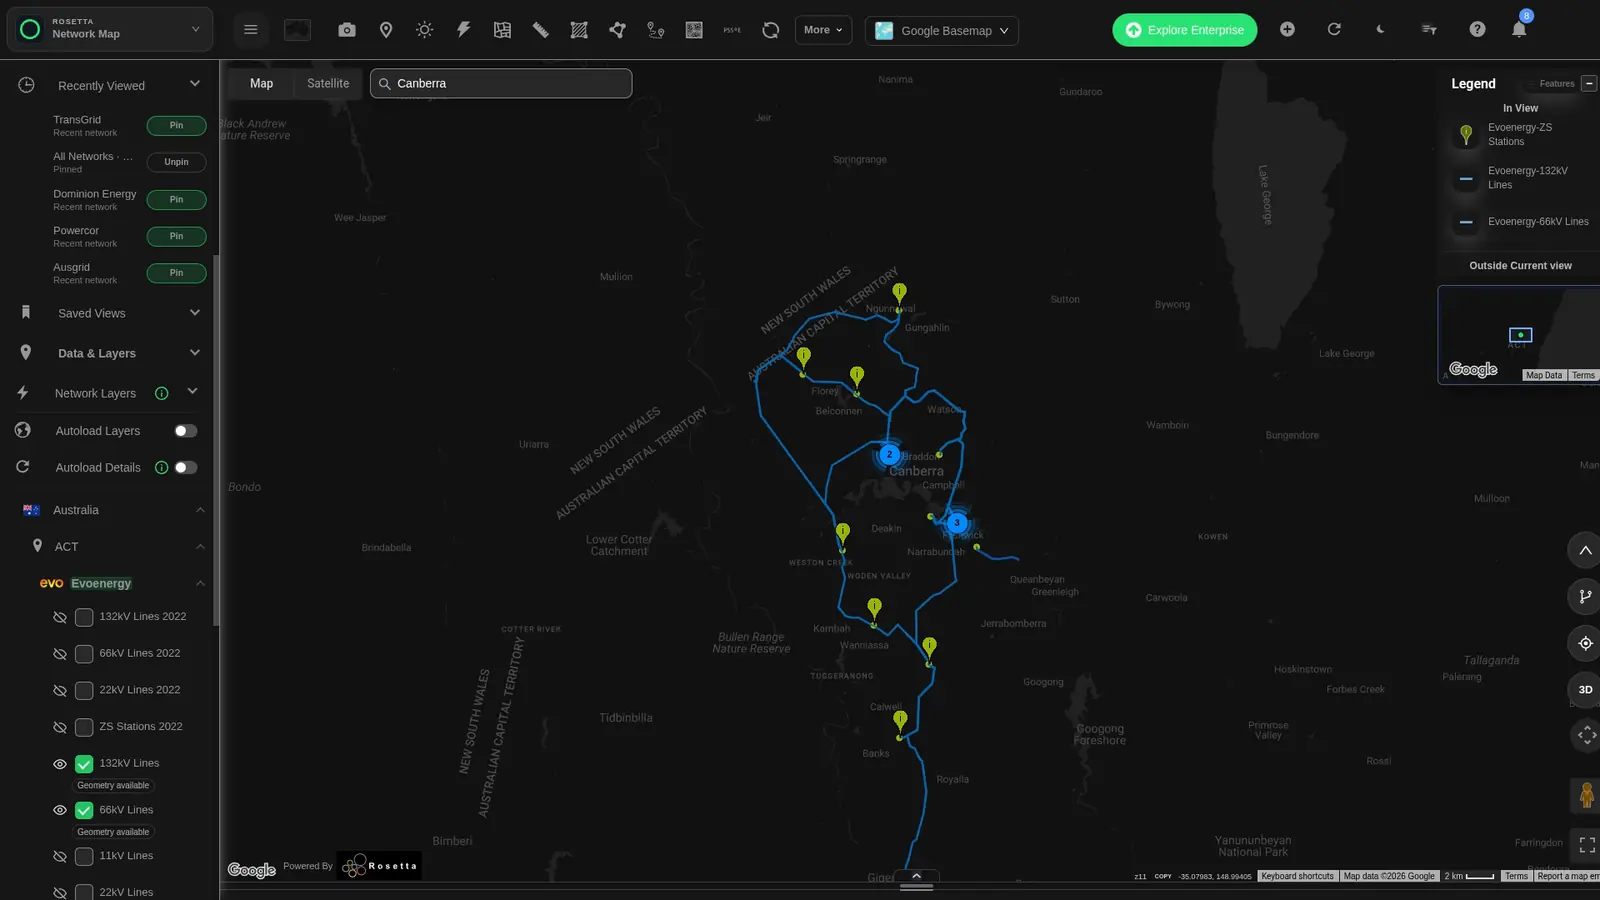
Open the Evoenergy regional map
View the full-size network screenshot
01 / Network & parcel context
See the parcel in its network setting.
Move from a regional network view to a specific parcel. Keep its identifier and surrounding infrastructure together as your team reviews candidate locations.
- Review mapped parcel boundaries and nearby substations.
- Build a shared starting point for land and network questions.
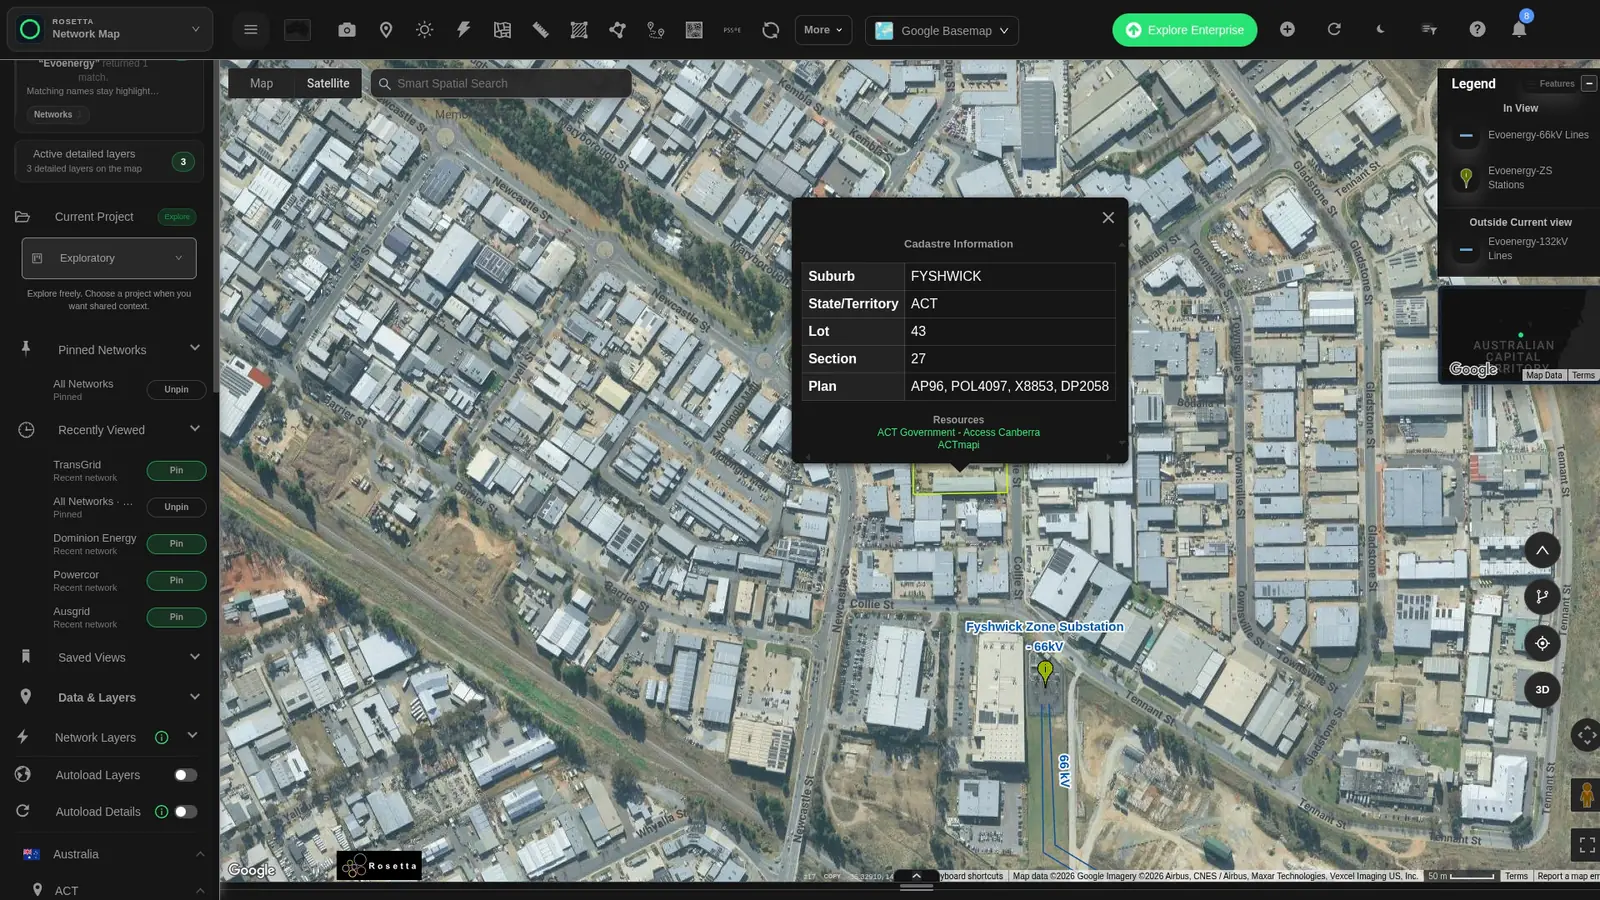
View the full-size parcel screenshot
02 / Connectivity context
Give carrier conversations a clearer starting point.
View indicative fibre-network links alongside candidate areas. Bring power and connectivity into the same regional view for your carrier discussions.
- Review regional fibre links around candidate locations.
- Build a shared brief for bandwidth and route planning.
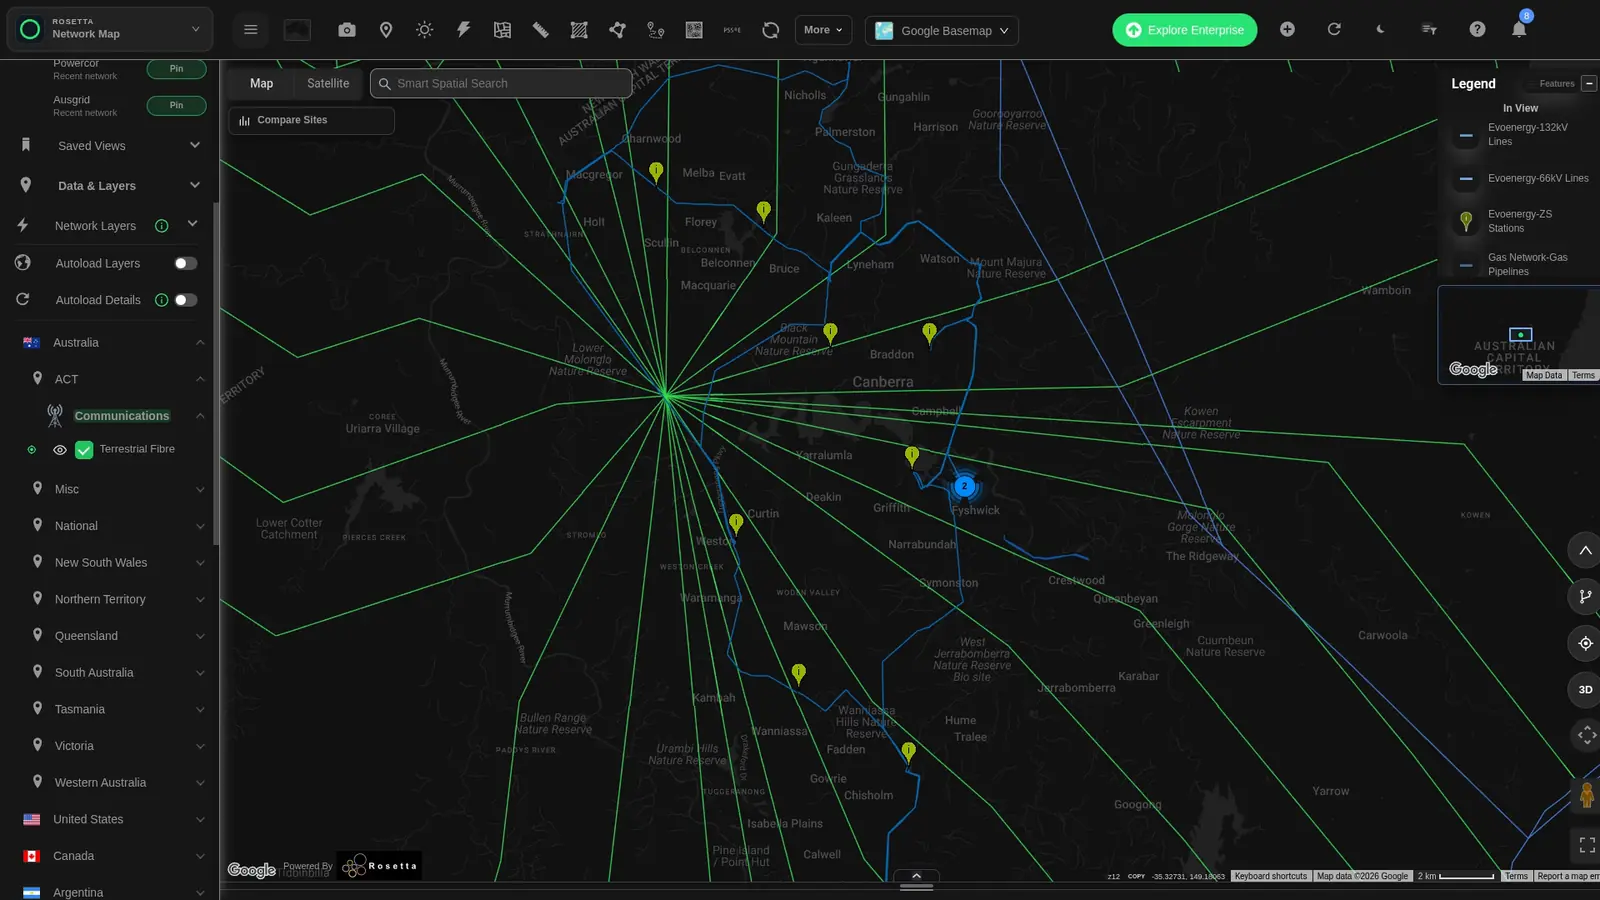
View the full-size fibre screenshot
03 / Straight-line proximity
Put proximity into the conversation.
Measure between a candidate point and mapped infrastructure. In Fyshwick, the map shows approximately 294 metres to the zone substation.
- Explain what is nearby with a visible measurement.
- Add a clear spatial reference to your project brief.
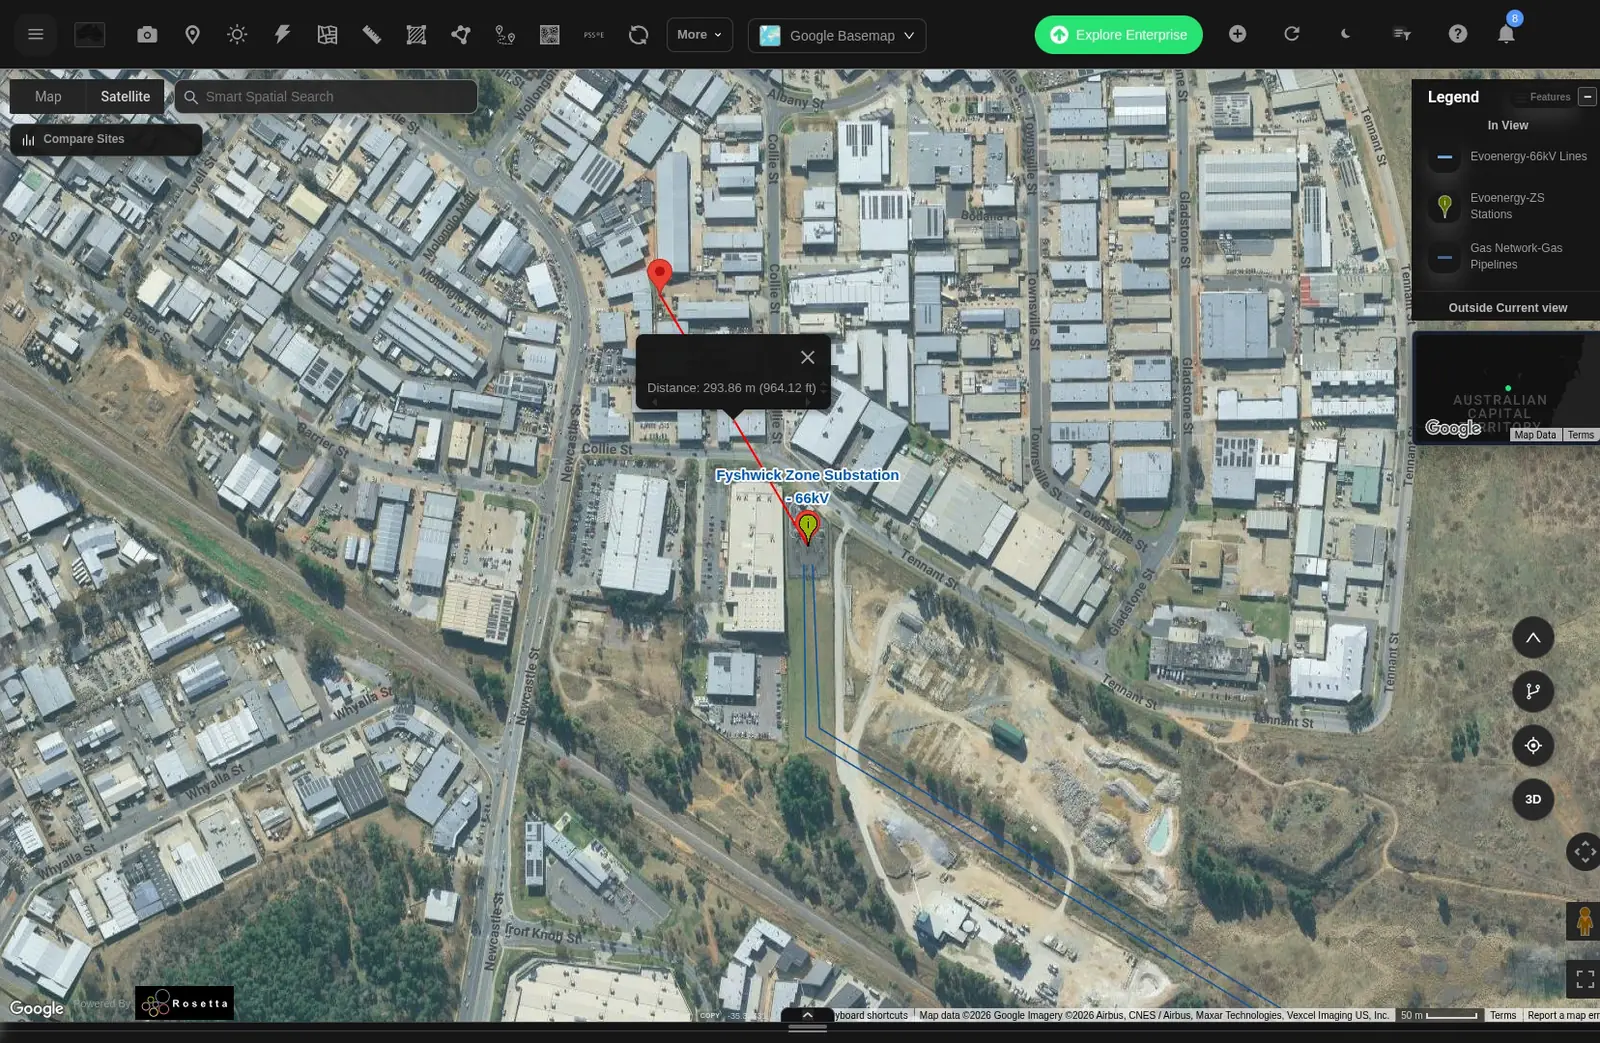
View the full-size measurement screenshot
04 / Compare & export
Compare locations. Share the results.
Compare network and market context around candidate points. Set a common radius and time window, then export comparison rows to CSV.
View the full-size comparison screenshot
Use the same settings
Choose a common radius and analysis window so your team can compare locations on a consistent basis.
See the source context
Review source dates and coverage alongside each measure.
Export for discussion
Download comparison rows as CSV to share with your project team.
ACT example: Compare Fyshwick and Hume using a 25 km radius and a 30-day window, then export the two locations to CSV.
One map. A shared project brief.
Bring the right teams into the conversation.
Share candidate locations, map views and comparison results with the teams working on your project.
Utility & engineering
Bring network context, demand requirements and connection options into engineering discussions.
Telecommunications
Put regional fibre links, bandwidth requirements and route planning in the same conversation.
Land & planning
Keep parcel identifiers, boundaries and location context together for land and planning discussions.
Data sources
- ACT network view
- Network Map captures from 17 November 2026, showing Evoenergy 132 kV and 66 kV lines and substations.
- ACT parcel
- ACTmapi © Australian Capital Territory, CC BY 4.0. Block 43, Section 27, Fyshwick. Source status: REGISTERED. The popup’s “Lot” field identifies the ACT Block.
- Fibre links
- Indicative inter-city links from the ITU dataset
ITU:trx_public_2. - Comparison data
- Fyshwick and Hume, 25 km radius, 18 October–17 November 2026. The displayed 113.4 MVA telemetry reading is dated 31 October 2026, 18:00 UTC. Binding hours are summed across nearby lines. Outage and loss-factor records retain their source dates.
- Distance
- The map tool measures 293.86 m between the selected point and Fyshwick Zone Substation.
Practical questions
Get more from your site search.
What can I explore around a candidate site?
View mapped power lines, substations, parcels and indicative fibre links together. Move between regional context and individual locations.
How can I review connectivity?
Display regional fibre links alongside candidate areas, then use that shared map view in carrier discussions.
Can I identify a specific parcel?
Yes. Select a mapped parcel to see its identifier and available attributes alongside the surrounding network.
Can I compare locations and share results?
Yes. Set a common radius and time window, compare locations and export the rows as CSV.
How do I explore another region?
Use the map search and layer catalogue to see the datasets available around your next candidate location.
Start with the map. Keep the evidence.
Turn your longlist into a focused shortlist.
Explore candidate locations, compare the network context and share a clearer project brief.


