

Docs Menu
Curtailment and Missed Revenue
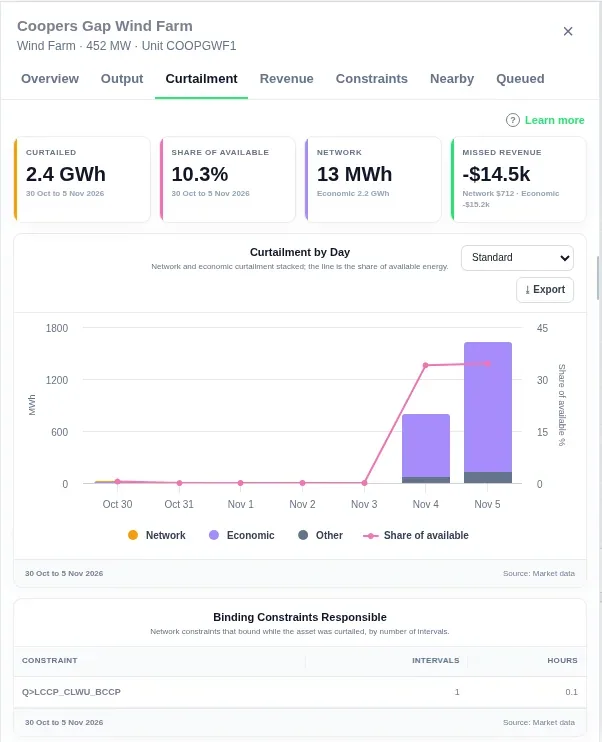
Network Map derives curtailment for supported semi-scheduled wind and solar units from availability and dispatch targets. It reports cause evidence and an RRP-based opportunity value where inputs support them. This is not measured foregone generation or a settlement-loss calculation.
Read Causes, Confidence and Coverage Together
- Open Markets → NEM → Adequacy → Curtailment by Cause.
- Choose the region, period and resolution. Check the latest available interval and fixed AEST (UTC+10) time zone. Next-day inputs mean the result is not a real-time dispatch feed.
- Read the regional breakdown of Network constraint, Economic and Unknown. Then inspect unit rows and their evidence and confidence. The regional chart is not a selected-unit chart.
- Keep unknown causes and incomplete equation coverage visible. Unit confidence is the lowest evidence confidence among its intervals, not an average or a percentage. A high-confidence unit row does not prove that every interval or the whole regional result is complete.
- Use Add to Map for geographic context, then return to the map and check its overlay timestamp. Only located units can be drawn. To inspect a particular asset, use Spatial Search and confirm its DUID separately.
See the market intelligence walkthrough for the asset-to-map sequence. Use the map to explore nearby infrastructure and the dashboard’s constraint and offer evidence to investigate curtailment causes.
Watch the Video: Headroom, Curtailment and Revenue (1:10)
What We Report
- Available MW: the market operator's unconstrained availability forecast for the unit.
- Dispatched MW: the dispatch target the market operator cleared for the unit.
- Curtailed MW = max(0, available − dispatched).
- Cause: the regional dashboard uses Network constraint, Economic and Unknown, with the available evidence. The separate asset-panel display can use named constraints, Unnamed network limit, Other constraints and Unattributed; those labels are not the regional dashboard controls.
- Missed revenue: curtailed MWh × the regional reference price of the same interval.
Views cover 24 hours, 7 days or 30 days, at 5-minute, 30-minute or hourly resolution, for one region or the whole market.
Where to find it: open Markets, choose the east coast market (NEM in the market switcher), then Adequacy → Curtailment by Cause. See East Coast Adequacy and Forecasts.
Data Sources
All inputs are public data from the market operator.
| Input | Publication |
|---|---|
| Availability, cleared MW, connection point | Next-day dispatch and dispatch unit solutions |
| Binding constraints and marginal values | Dispatch constraint results |
| Local price adjustment per unit | Dispatch local price results |
| Constraint equation terms and type | Constraint equation data |
| Offer prices and band volumes | Daily bid and offer files |
| Regional price | Dispatch regional reference price |
Rules
Clamp. When dispatch is above availability, curtailment is 0, and the record says so. A missing input gives a null value, never a zero.
Network cause. The unit is limited by a constraint that bound in the same interval. The evidence is one of:
- Published terms (high confidence): the unit's connection point is an energy term of the exact binding equation version, with the factor sign that limits output.
- Local price adjustment (high confidence): the market operator gave the unit a negative local price adjustment in that interval.
- Constraint row (medium confidence): the binding constraint row names the unit.
Economic cause. No network rule applies, the full constraint solution was read, and the regional price was strictly below the price of the offer band that holds the undispatched volume. A tie is not counted as evidence.
Unknown. Neither rule applies. The record keeps the reason.
Missed Revenue
Missed revenue = derived curtailed MW × 5/60 h × regional reference price, summed over covered intervals and split by cause. This is an RRP-based opportunity-value estimate, not actual lost profit, settlement revenue, compensation or a contractual entitlement. A negative value can represent avoided exposure to negative prices.
Coverage
Coverage varies by region, period, unit and source availability. Read returned interval counts, confidence, unknown-cause totals and incomplete-equation notes. Missing availability or dispatch inputs produce unavailable values, not evidence of no curtailment. Attribution percentages and coverage are specific to the selected window.
The map inventory and market overlay can have different dates from the analytical window. Use the dashboard’s constraint and offer evidence to interpret a cause, and the map to explore its geographic context.
Related Guides
- Market Intelligence Walkthrough
- East Coast Adequacy and Forecasts
- Grid Constraint Headroom
- Grid Constraint Marginal Value
- Unit Revenue with Loss Factors


