Keep the outputs with the run
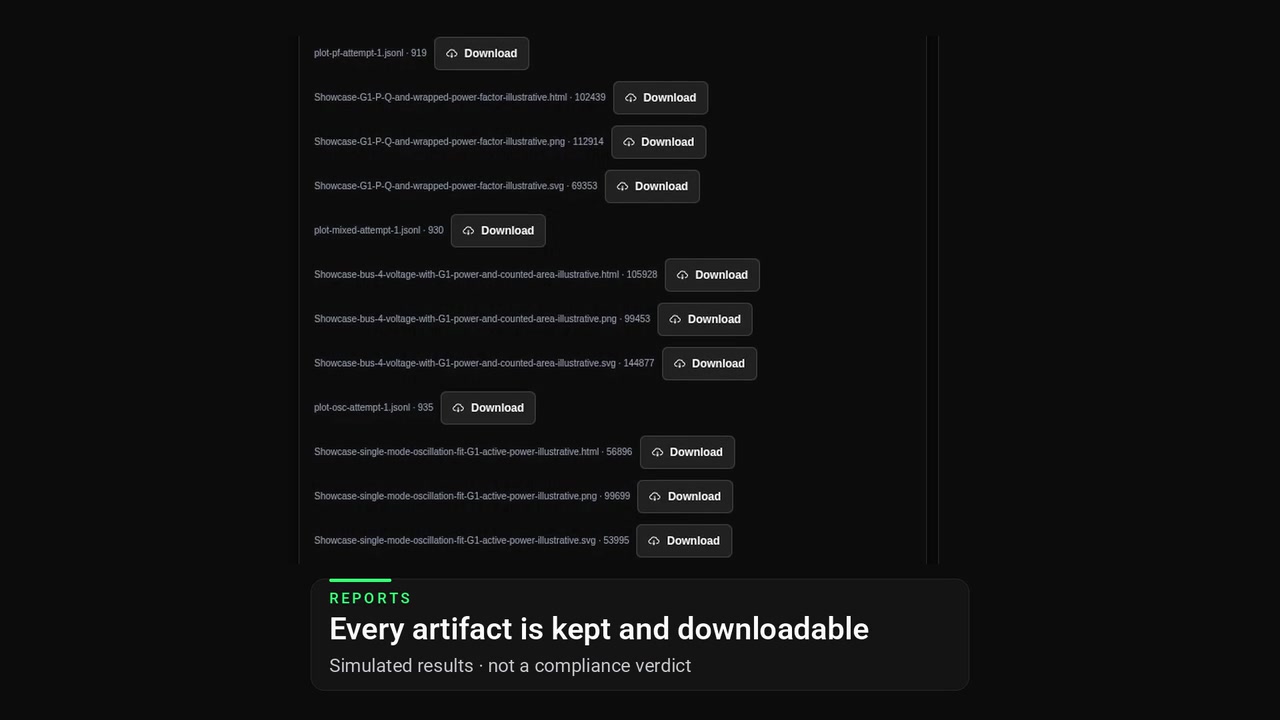
Review the report artifacts kept with the example workflow run and choose the download format you need.
Network Map Solutions
Build plot reports straight from workflow runs, with the run, case and units carried onto every page.
Free account. Paid plans from US$75/month.
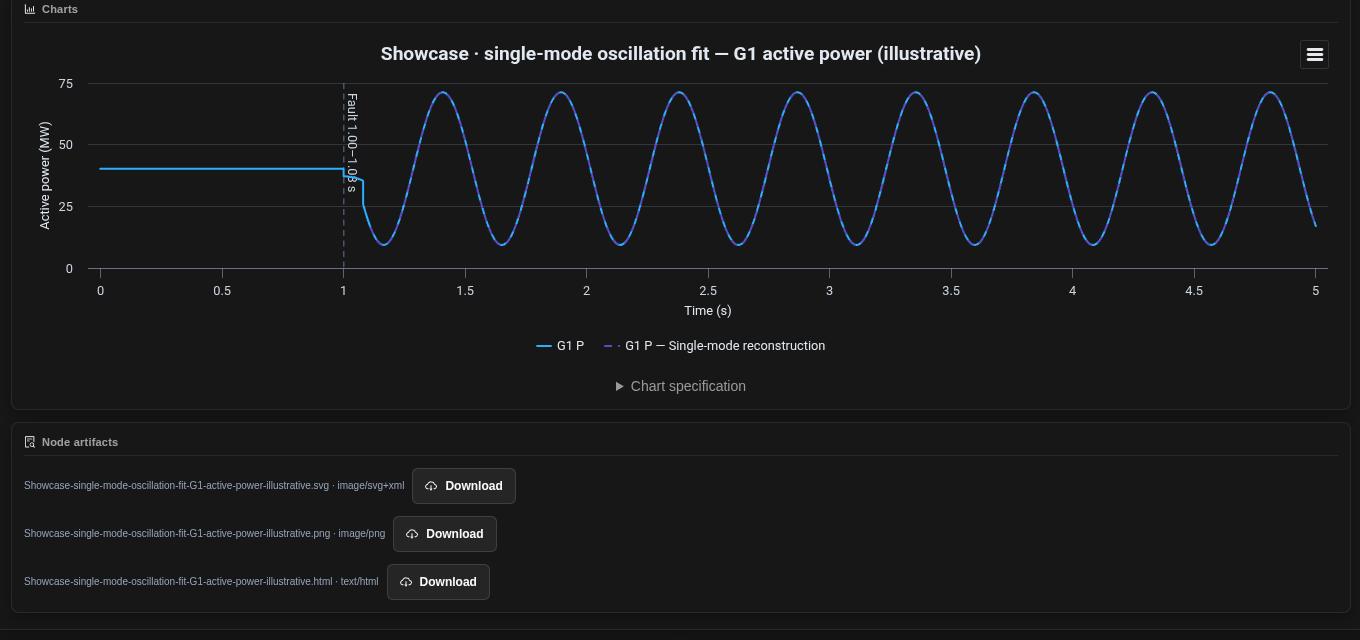
Example five-bus classical-machine simulation in Engineering Studies: the chart and its SVG, PNG and HTML downloads stay with the run.
Each chart stays tied to its source data, flow revision and run, so a reviewer can trace any figure back.
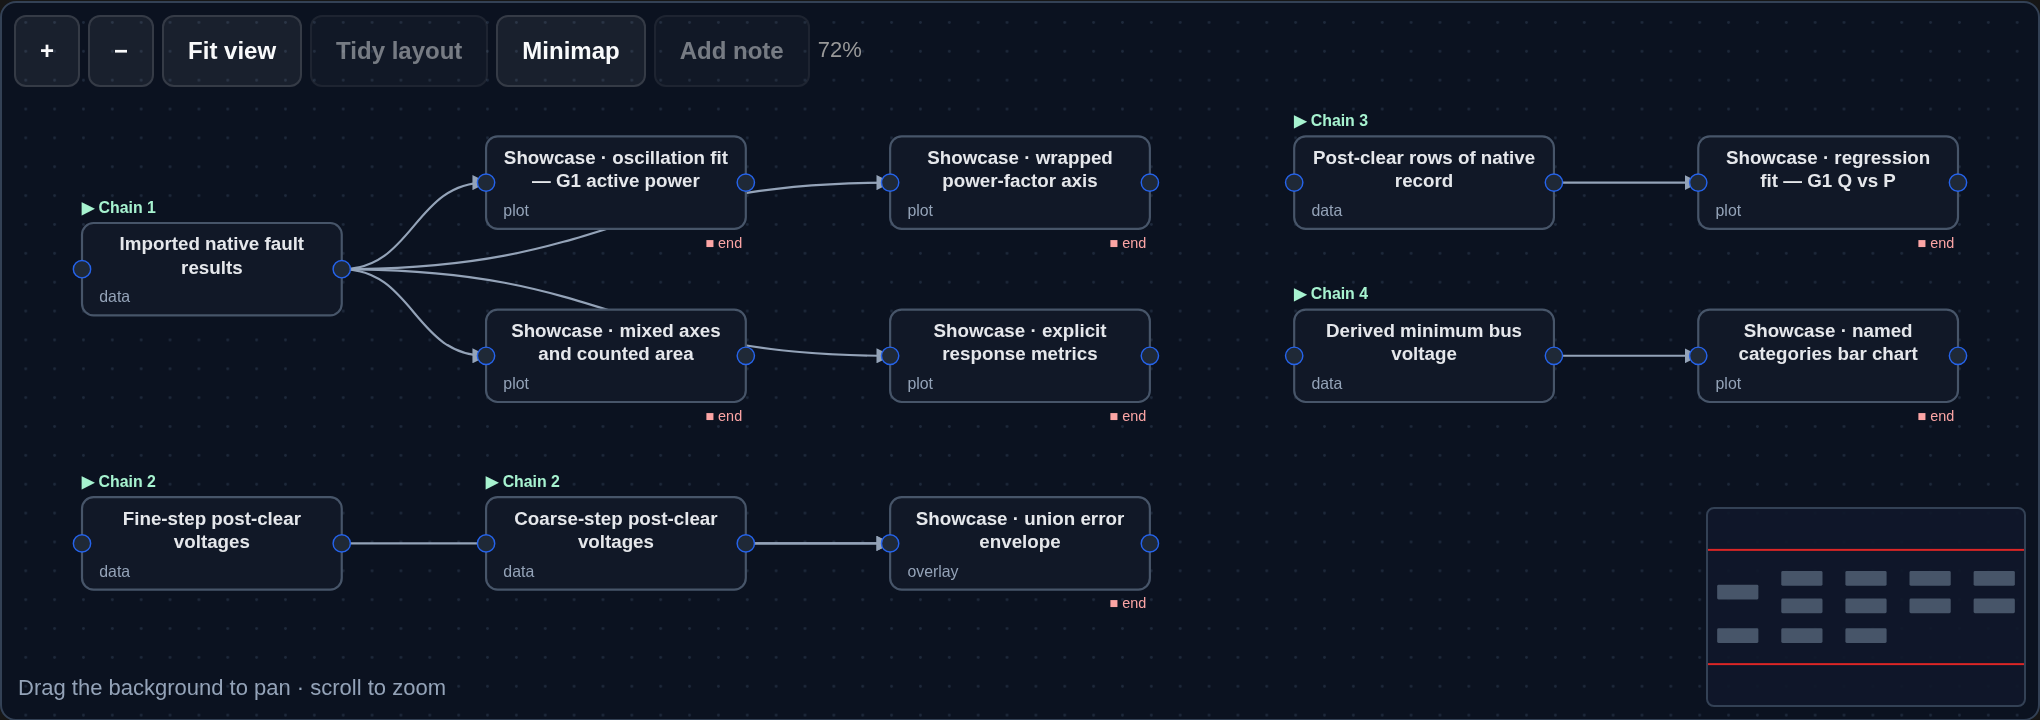
Each chart is a node in a saved flow, tied to its source data and run.
Plot nodes cover time series, fitted modes, scatter with regression, named categories and multi-panel comparisons. Export as SVG, PNG, HTML or PDF.
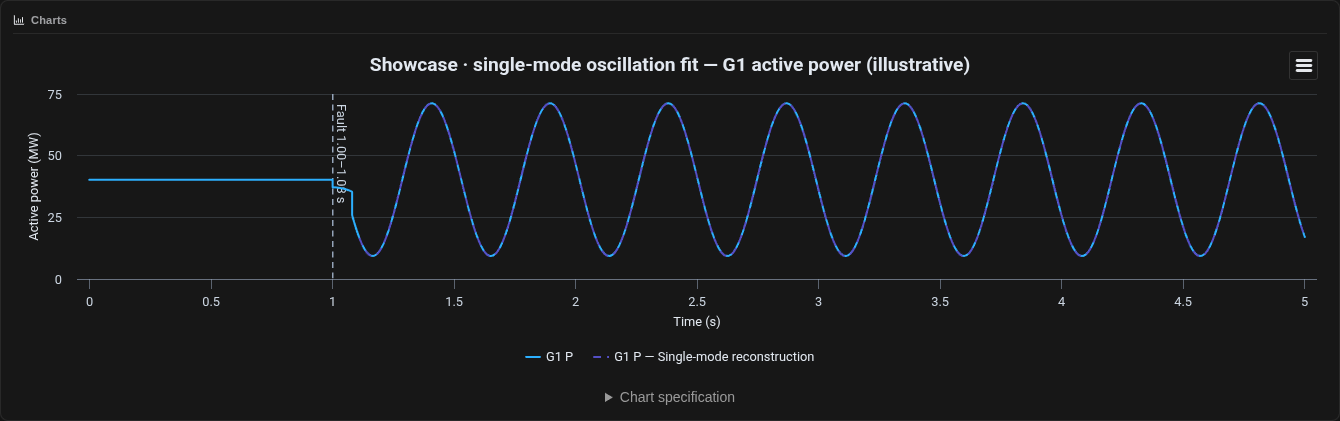
Oscillation fit on G1 active power: the trace with its single-mode reconstruction.
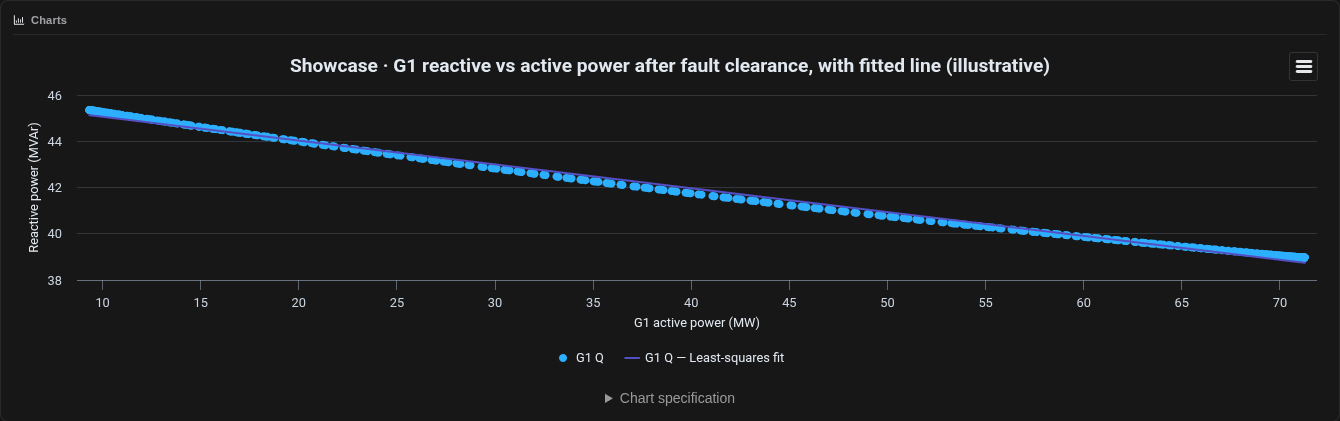
G1 Q vs P after fault clearance with a least-squares line.
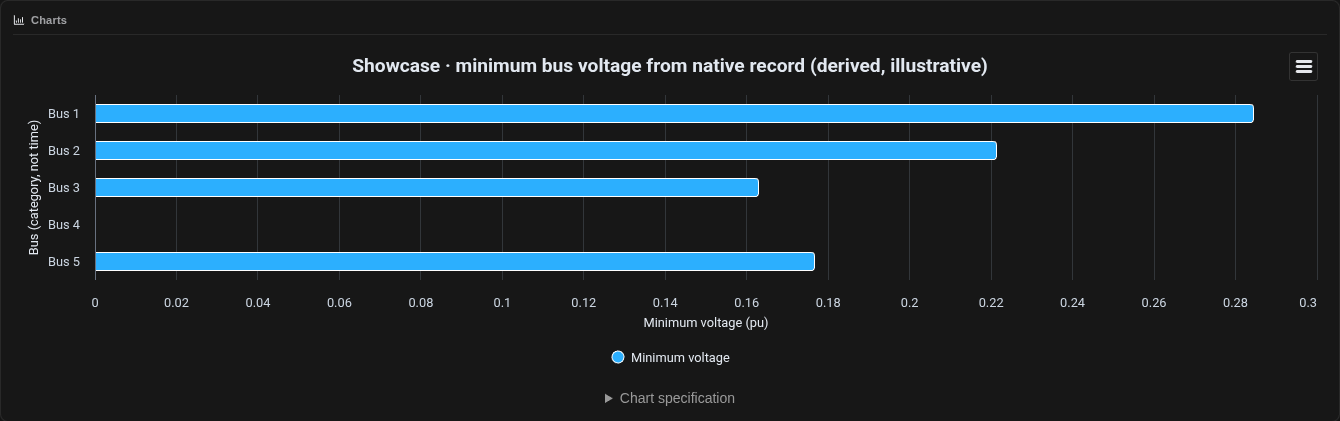
Minimum voltage per bus during the fault; bus 4 is the faulted bus.
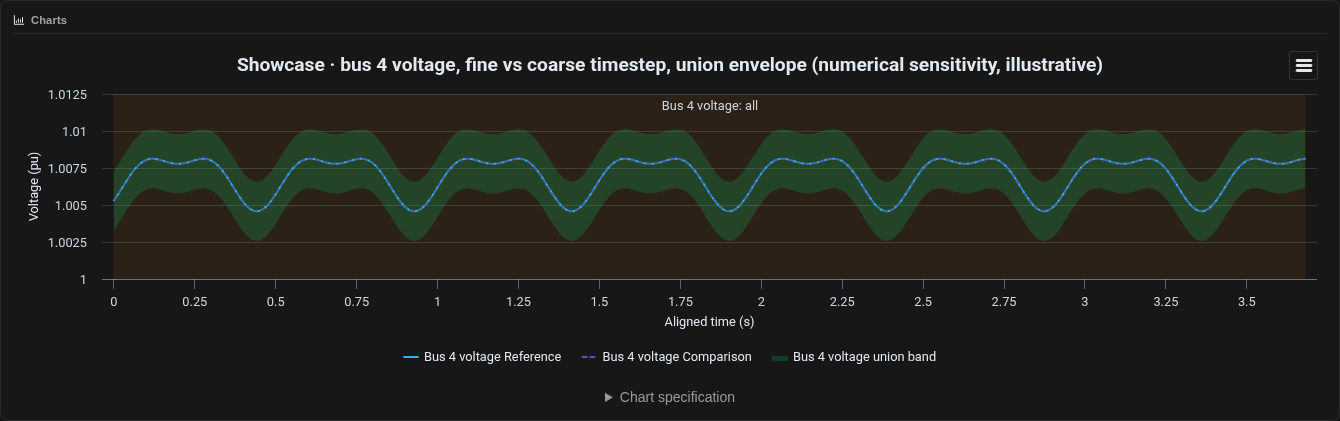
Same case at 0.001 s and 0.002 s timesteps, with the band between the runs shaded.
Use a run plot report for a PDF or HTML set of charts, a study presentation for a summary, and a data export when a reviewer needs the values.
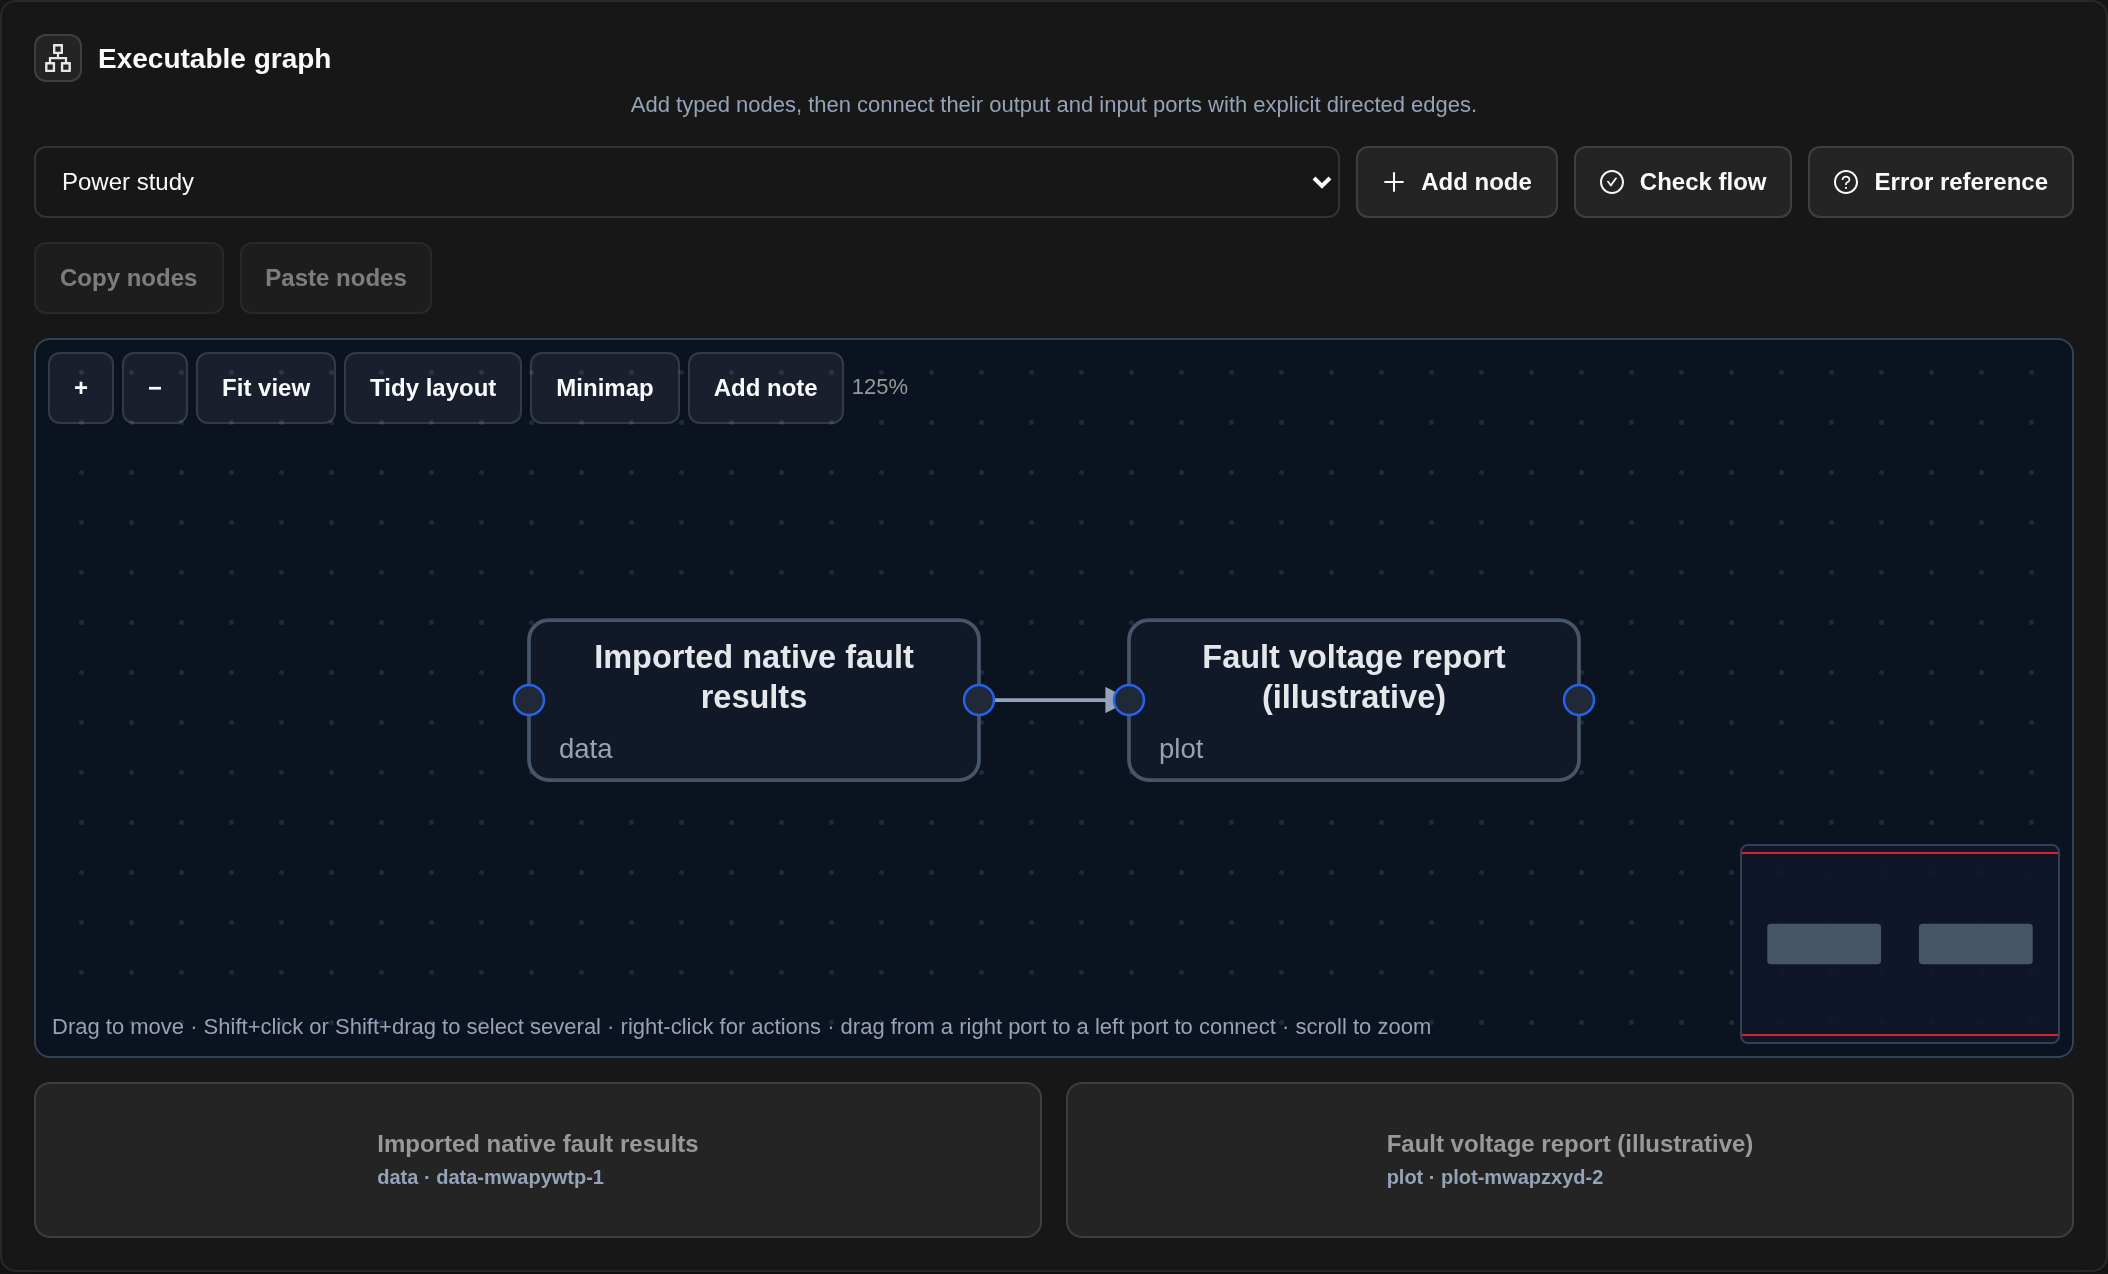
Imported simulation results connected to a report plot.
Choose a clip to play. These silent excerpts loop only after you start them; use the controls to pause.
Review the report artifacts kept with the example workflow run and choose the download format you need.
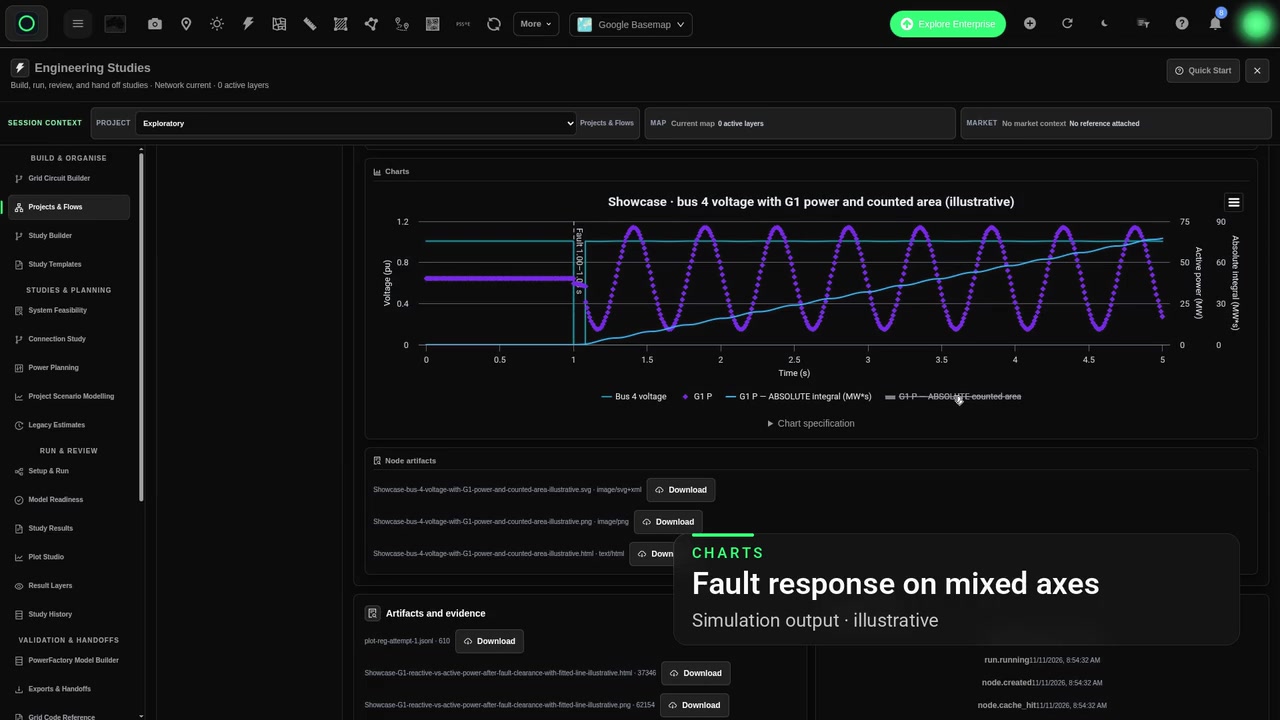
Explore the example simulation with mixed-axis and wrapped power-factor charts. Review each view with its units and axis settings.
Choose the charts and output formats your reviewer needs. Keep every figure connected to its source data, flow revision and run.

Copyright © 2017-2026 Network Map LLC