

Docs Menu
Grid Constraint Headroom
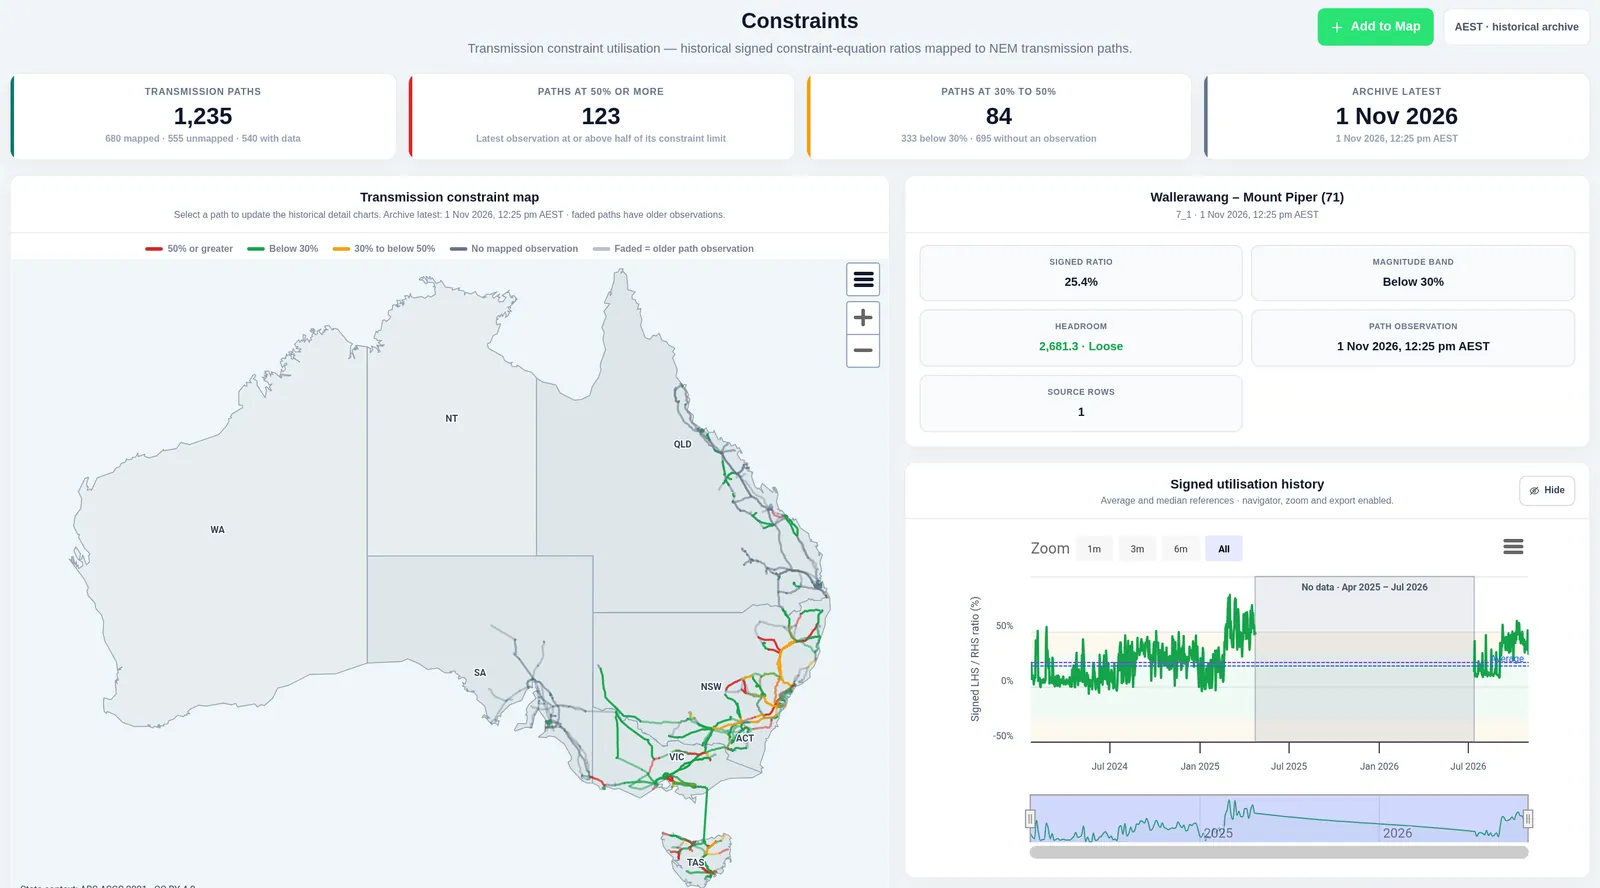
Headroom shows how close each grid constraint is to its limit, for every constraint equation and every transmission line it maps to, in every 5-minute dispatch interval. Headroom is shown in the Constraints view (Market information group) in Network Map Markets. See East Coast Constraints.
Watch the Video: Headroom, Curtailment and Revenue (1:10)
What We Report
- Left-hand side (LHS) and right-hand side (RHS): the two sides of the constraint equation, as the market operator publishes them.
- Headroom = RHS − LHS. A negative value means the equation is binding or violated.
- Headroom % = headroom / |RHS| × 100.
- Signed utilisation %: the published utilisation of each constraint row.
- Headroom band: a quick reading of each point.
| Band | Rule |
|---|---|
| Binding | Headroom below 0 |
| Tight | Headroom 10% or less |
| Moderate | Headroom 10% to 30% |
| Loose | Headroom above 30% |
| No data | A side is not published, or the RHS is 0. The app legend shows No headroom data. |
Two Kinds of Headroom
Network Map shows headroom on two bases. Check which one a view uses:
- Derived: the constraint equation margin, RHS minus LHS. This page describes it.
- Measured: the AEMO-published rating minus the measured flow on a line. See Measured Line Flow.
Units of Measure
Headroom is the difference between the two sides of the constraint equation, in the equation's own units. Most equations are in MW. Network Map reports each value exactly as the equation defines it, so headroom always reflects the limit the dispatch engine applied.
One Point per Line per Interval
A line can appear in several constraint rows in the same interval. Network Map shows one representative row: the row with the largest absolute utilisation. Ties go to the larger signed value, then to a row with both sides published.
Hourly and daily points show the peak interval of the period, together with the maximum, minimum and mean signed utilisation.
Data Sources
Headroom is calculated from the market operator's public dispatch constraint solutions. Constraint line identifiers are matched to readable line names from Network Map's own transmission network data.
Coverage
| Item | Value |
|---|---|
| 5-minute detail | The latest 14 days, for 1,547 lines, with the RHS published on every point |
| Hourly history | 3,920 lines |
| Resolution | 5-minute dispatch intervals, with hourly and daily views |
Related Guides
- Grid Constraint Marginal Value
- Curtailment and Missed Revenue
- Measured Line Flow and Ratings
- Grid Constraint Methodology


