

Docs Menu
Battery Benchmarks and Index
Compare eligible NEM batteries with their peers and read Network Map's monthly battery revenue index. The index uses a published methodology and public market inputs. It is a Network Map calculation, not an AEMO-issued index or a statement of settled revenue.
Compare a Battery with Its Peers
- Open Markets → NEM → Asset Economics → Battery Benchmarks.
- Choose Region and Duration band. Read the monthly index, its revision and contributors. The fixed index is annualised energy-plus-FCAS revenue per registered MW-year; it is not the revenue earned in that month.
- Choose Metric for the peer distribution and selected-battery comparison. This control does not change the fixed monthly index.
- Enter the exact Battery DUID, then press Enter or leave the field. Read the battery result beside the peer percentiles and the reason for any unavailable value.
- Check the period, contributor count, covered intervals and cohort version. The selected battery uses its own cohort, not necessarily the Region and Duration band chosen for the distribution. Match these before comparing. The current peer distribution and a published index month can also use different cohort versions.
Inspect the Battery's Operations and Revenue
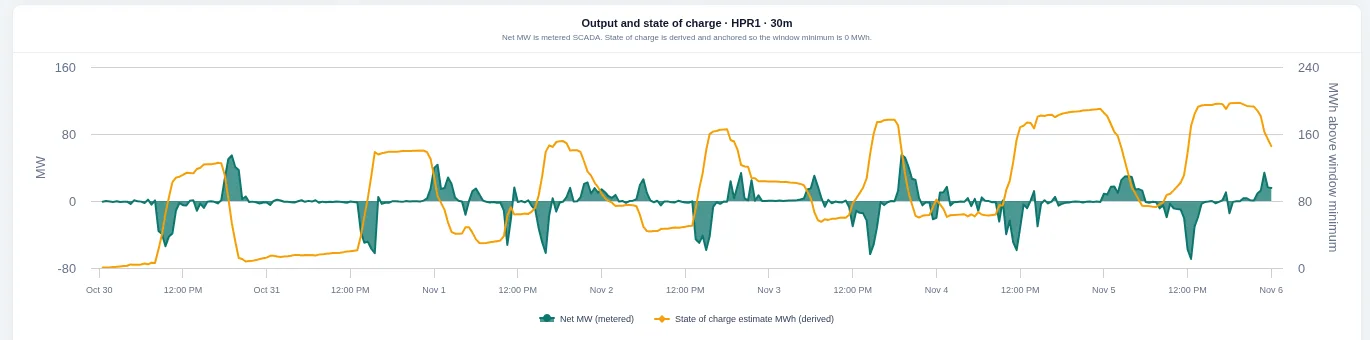
Open Asset Economics → Battery Analytics, enter the same battery DUID, and choose Last 7d or Last 30d (complete days). Times use fixed AEST (UTC+10). Read the output and coverage, then the revenue and FCAS tables.
- Output: metered SCADA, not a dispatch target. The state-of-charge estimate is derived relative MWh above the selected window's minimum, not measured absolute charge.
- Cycles and efficiency: equivalent full cycles need storage MWh and can remain Unknown. The discharge/charge ratio is not an efficiency unless the window starts and ends at the same charge.
- Revenue: energy discharge and signed charging cost use SCADA output. In the detail view, the published MLF applies to energy valuation, not FCAS. Net revenue includes priced streams only.
- FCAS: eight services are priced where inputs exist. Very-fast raise/lower remain unpriced in this calculation; they are not zero. Check the stream and interval coverage.
For the connected sequence, see the market intelligence walkthrough.
Watch the Video: Headroom, Curtailment and Revenue (1:10)
What We Report
- Peer benchmark: one battery's revenue against its cohort, with the count, 25th percentile, median, 75th percentile and mean.
- Monthly index: an annualised revenue-per-MW median for a region and duration band, where enough eligible contributors are available.
- Methodology: the full rules are published in machine-readable form, and the published methodology is tested to match the calculation exactly.
Cohorts
- A cohort is region × duration band × technology class.
- Technology class: a bidirectional unit, one unit that both charges and discharges.
- Duration = registered storage (MWh) / maximum capacity (MW), from the market operator's registration data.
- The registration in force on the last day of the period sets the cohort.
- Units under 5 MW, units that share a connection point with a generator or load, virtual or aggregated units and units without capacity data are excluded, with the reason listed.
- Each cohort is stored as an immutable version identified by a hash of its content. Every figure names its cohort version.
| Duration band | Rule |
|---|---|
| 1h | Under 1.5 hours |
| 2h | 1.5 hours to under 3 hours |
| 4h | 3 hours to under 6 hours |
| 8h | 6 hours or more |
Metrics
- Energy revenue: metered MW × 5-minute regional price × 5/60 h. Discharge revenue plus the signed charge cost.
- Ancillary services revenue: enabled MW for each unit × the volume-weighted market price of the trading interval × 5/60 h, for 8 services: raise and lower regulation, and raise and lower 6-second, 60-second and 5-minute contingency.
- Revenue per MW-year = net revenue / registered capacity × 105,120 / intervals covered. This annualises the observed period; it is not a full year of earnings or a forecast.
- Revenue per MWh of throughput = net revenue / metered discharge MWh.
- Benchmark energy is compared at the regional reference node, without MLF adjustment. This differs from the MLF-adjusted energy value in Battery Analytics.
Index Formula
- Value = the median (Hyndman-Fan type 7) of the contributing members' revenue per MW-year, covering energy and ancillary services, with equal weight.
- A member needs an available metric and at least 2,016 metered five-minute intervals (7 days) in the month. The default energy-plus-FCAS scope also requires complete FCAS coverage.
- A cohort needs at least 5 contributors for a value to be published.
- A published month keeps its cohort version. A changed input creates a new revision and a restatement record with the old value, the new value and the reason. Earlier revisions stay readable, and the store accepts no updates or deletes.
Coverage
Coverage depends on the unit, period, source inputs and cohort rules. Use the returned member and contributor counts, interval counts, exclusions and suppression reasons, rather than a fixed fleet total. Partial coverage is not a complete month, and suppressed or unknown values are not zero.
Related Guides
- Market Intelligence Walkthrough
- Unit Revenue with Loss Factors
- Curtailment and Missed Revenue
- Network Map Markets Guide


