

See How the Grid Is Running, Line by Line
Know which line is limiting your units, what it cost and what comes next. Measured flow, headroom, binding constraints, curtailment, outages and unit revenue on one map, updated every five-minute dispatch interval.
Built on the market operator's own published data • ISO/IEC 27001 certified • Cancel anytime
Built for Operators · Traders · Developers
Measured Line Flow Against Its Rating
Read the flow the market operator measured on each transmission element, next to the rating used in dispatch, and the headroom left between them.
- Measured flow and normal and emergency ratings per line and transformer
- Headroom as rating minus flow, every five-minute dispatch interval
- A settled monthly archive of every dispatch interval
- 0–6 s: south-east overview, slow push-in on the main interconnector corridor; flow arrows moving on every measured line, lines coloured by headroom
- 6–12 s: eased pan north to the northern interconnector corridor
- 12–18 s: eased pan and zoom to the western interconnector corridor; hold on tight (amber/red) stretches
A History Page for Every Constraint Line
Open any constraint line to see how hard it has worked: utilisation and headroom bands, binding hours by month, marginal values, the outages linked to it and the units behind it.
- Utilisation and headroom bands by month
- Binding hours and marginal value per constraint
- Linked outages and the units that sit behind the line
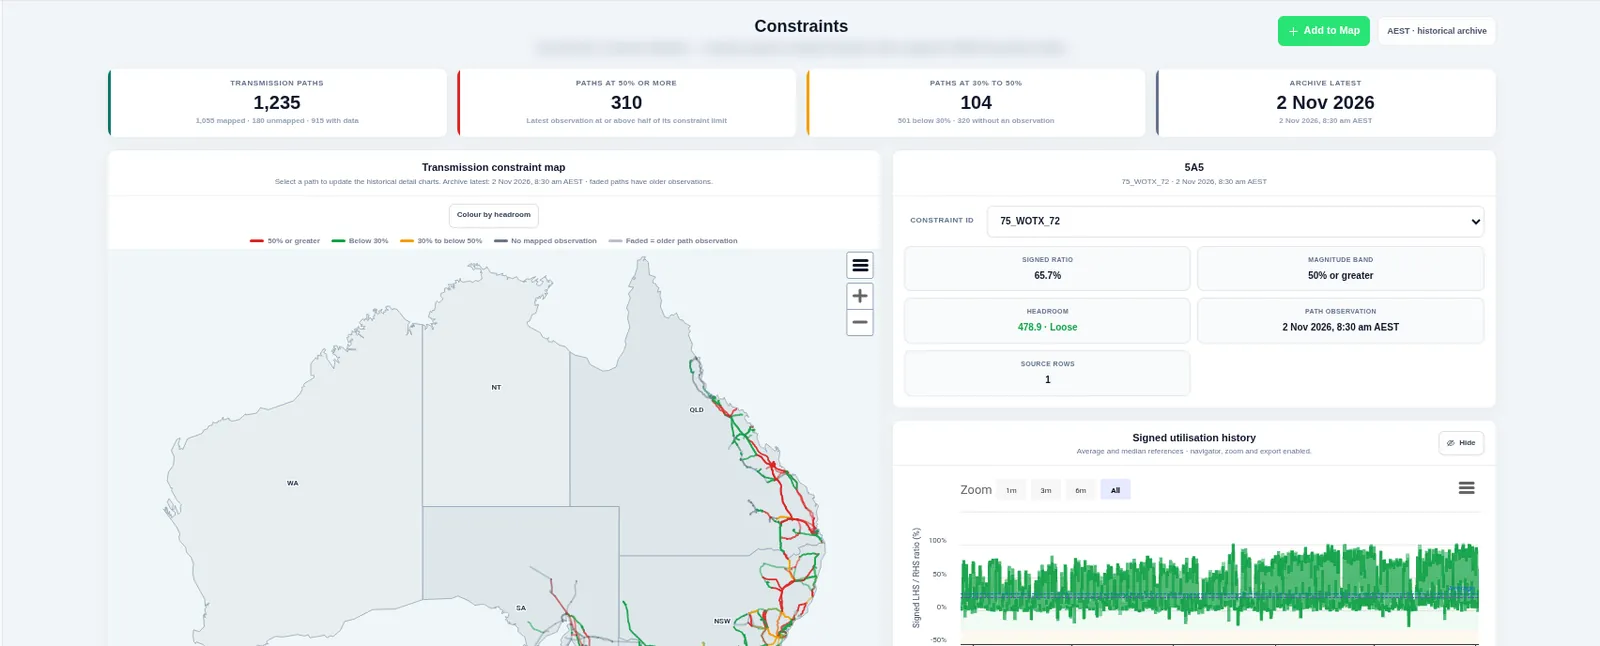
- Start on one coloured line on the dark map, slow zoom in
- The line history page opens over the map (dark theme): bands and binding hours by month
- Slow scroll to linked outages and the units behind the line
Colour the Map by Headroom
Turn on headroom colouring and every Grid Constraints path takes the colour of its tightest constraint: binding, tight, moderate or loose. Projects can be coloured by their curtailment share in the same way.
- Measured headroom wins wherever it is published
- One click from the Constraints view to the main map
- Projects coloured from below 1% to 30% or more curtailed
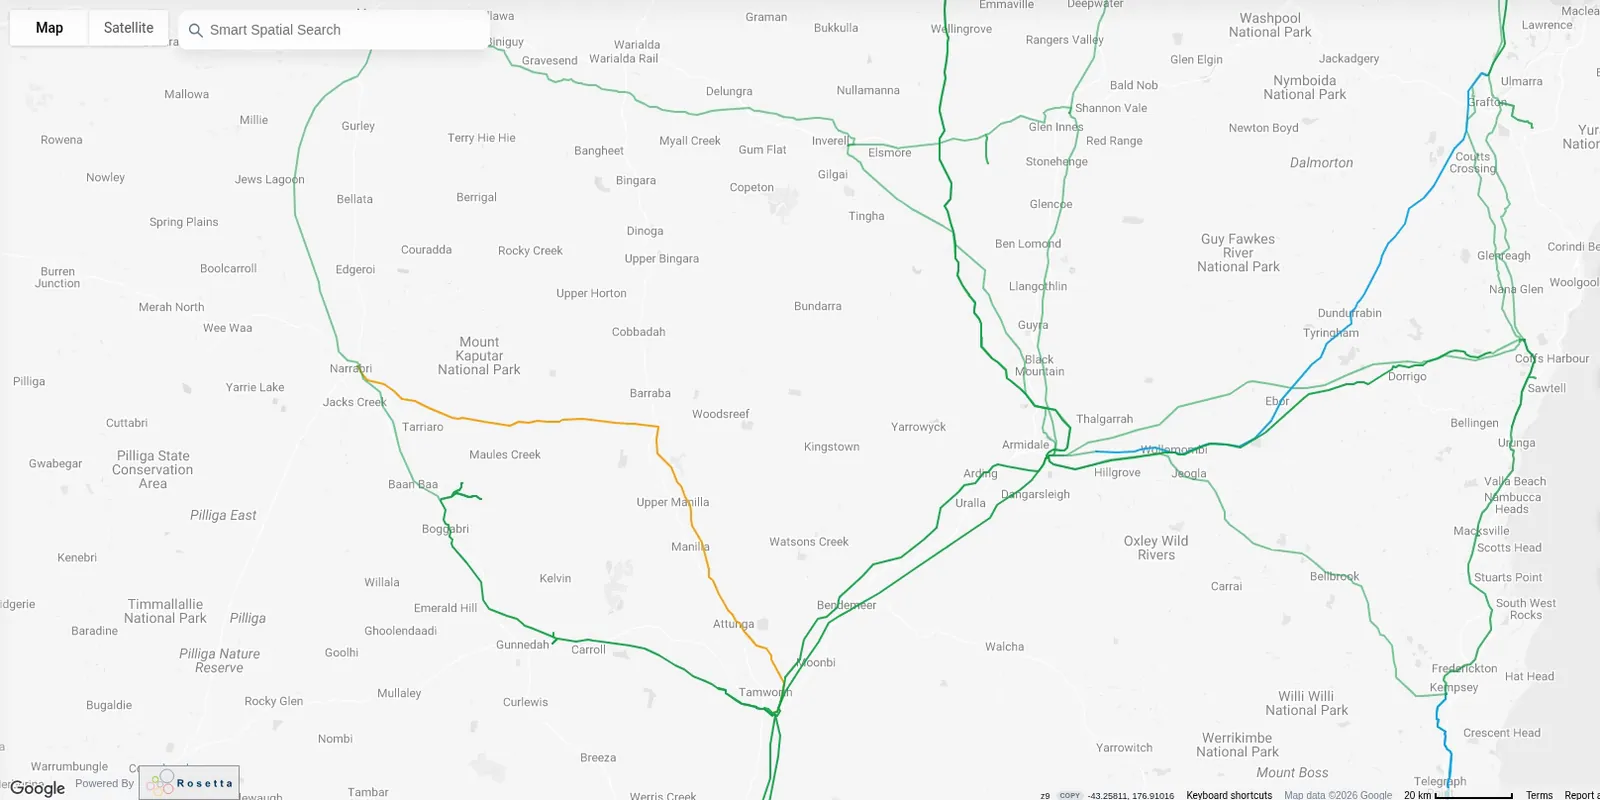
- Wide view of the network coloured by headroom
- Eased zoom into the busiest corridor in the north-east
- Pan south to a second corridor; hold on an amber and red stretch
Curtailment by Cause and Missed Revenue
See how much energy each unit could have produced and did not, split into network and economic causes, with the revenue missed at the regional price.
- Network, economic and unknown causes per interval
- Missed revenue per unit and per region
- The binding constraints and offers behind each stated cause
- Projects coloured by curtailment share on the dark map
- Slow zoom into a cluster of high-share projects
- Hold while the colours read clearly from green to red
Outage Risk for Every Unit
Match the network outage schedule to the assets it affects. The outage risk card on each unit shows the outages and constraint sets that touch it, seven days back and 90 days ahead.
- Outage-to-asset risk card in Unit Operations
- Network outage schedule by constraint set
- Recall times and linked high-impact outages
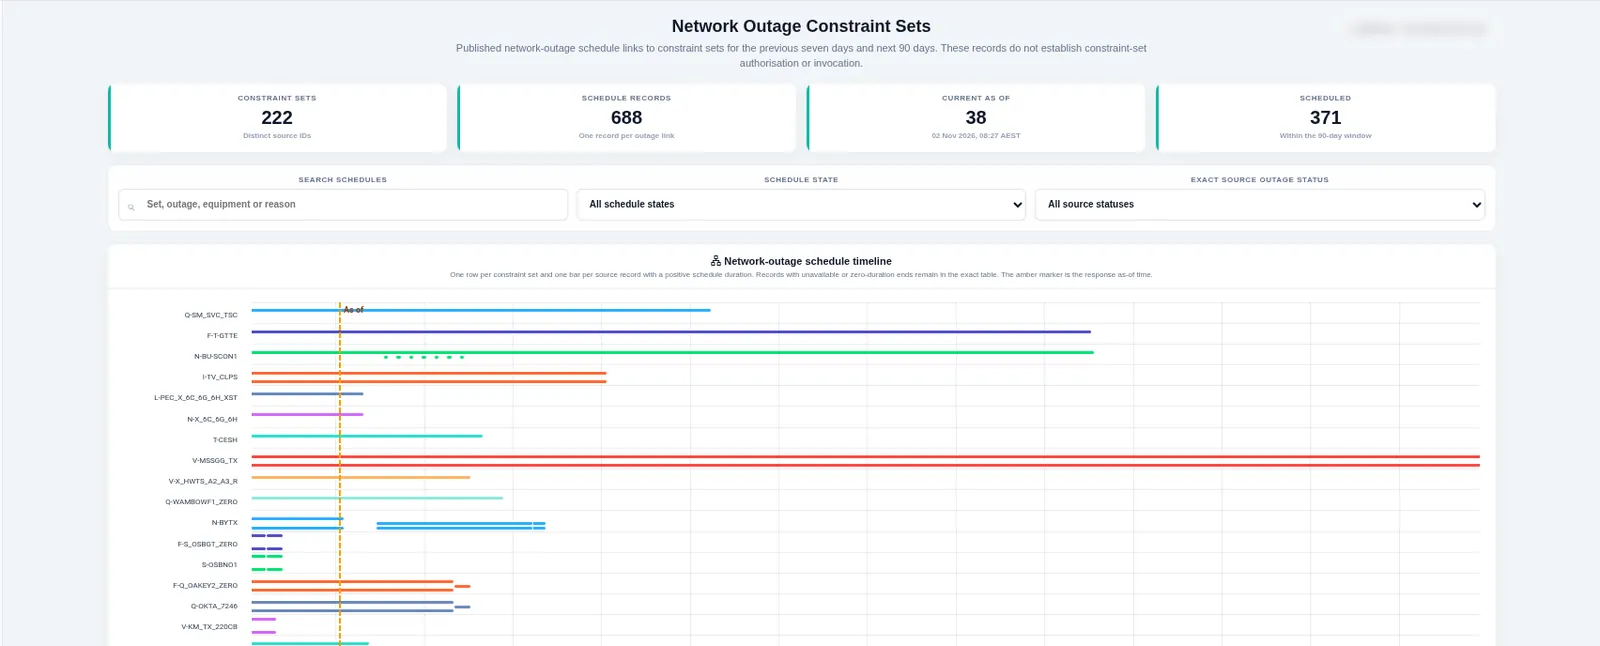
- Dark map with the lines of one planned outage highlighted
- Slow zoom to the units next to it
- Hold on the outage risk card for one unit
Operational Alerts in the Notifications Bell
Watch a line, a constraint, a unit or a site. When it binds for longer than you set, is curtailed past your threshold or an outage invokes a constraint set nearby, the alert appears in your notifications bell.
- Watch lines, constraints, units and sites
- Set the intervals, the share and the time window yourself
- One click from an alert to the subject on the map
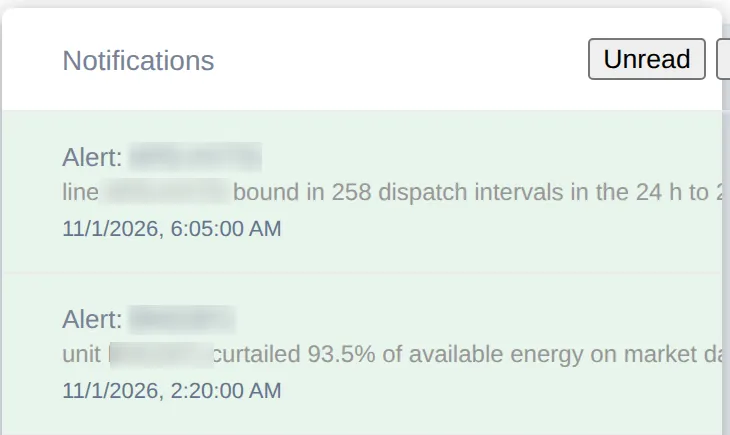
- Dark map, slow drift over a watched corridor
- The notifications bell badge updates; the panel opens (codes not legible)
- One click from the alert flies the camera to the line
Asset Economics You Can Reconcile
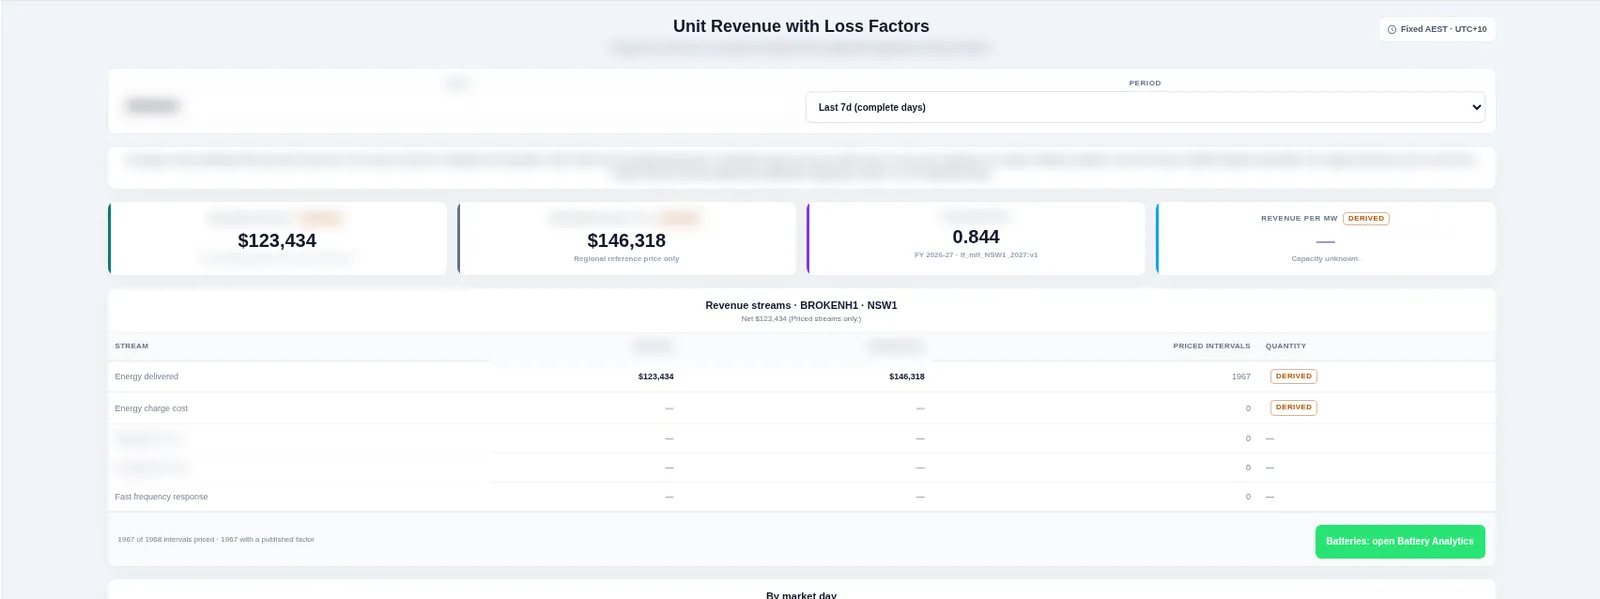
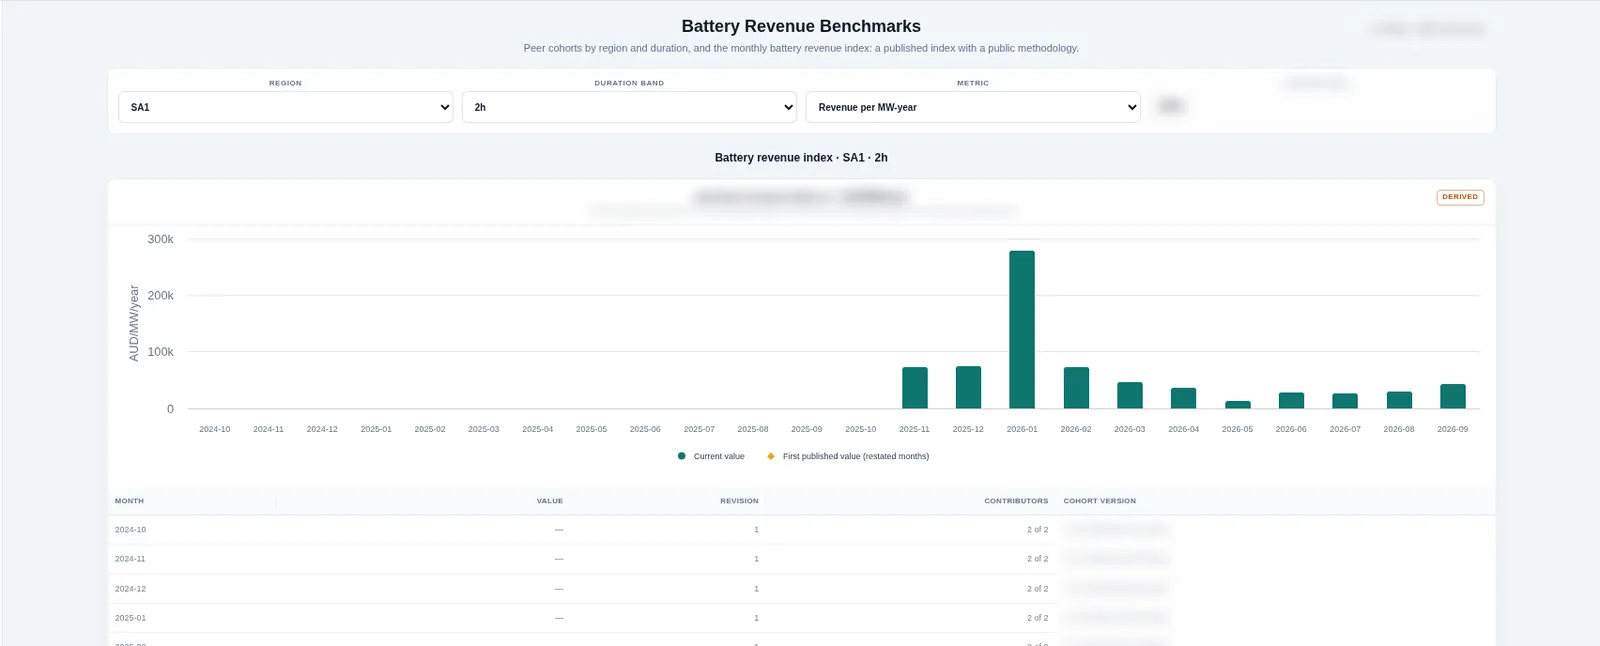
Turn the regional price into what a unit is paid. Unit revenue applies the published loss factor, battery analytics split revenue by stream, and the battery benchmark index ranks a battery against its peers each month.
- Unit revenue with and without the published loss factor
- Battery analytics and the monthly battery benchmark index
- Unit ranking and commissioning hold points
- Dark map, slow zoom onto one solar farm
- The unit revenue panel shows revenue with the loss factor applied
- Cut to the battery benchmark index month by month
Grid Constraints, Mapped to the Lines They Protect
Constraint equations are tied to the transmission paths they limit, so every binding hour lands on a real line on the map, with years of history behind it.
- 1,055 transmission paths mapped to constraint lines
- Every constraint equation, every dispatch interval
- Multi-year binding history per line
- Full network on the dark map, all paths coloured
- Slow eased pull-back from a corridor to the whole system
- Hold on the full network for the final caption
See It Work, Shot by Shot
Real footage from the platform: the map, the side panels and the charts working together on live grid data.
Know Why a Unit Was Curtailed
Open a unit, split its lost energy into network and economic causes, find the constraint behind each loss, then see the revenue it cost.
Benchmark Any Operating Asset
Output, curtailment by cause, outage risk and nearby assets for one wind or solar farm, all in one panel beside the map.
Find the Lines With Room to Spare
Colour every line by headroom, see where constraints bind most, then narrow curtailment to the hours that matter.
See How It All Connects
Follow a farm's connection line to its substation, then rank every line into it from tightest to loosest.
Map, Table and Chart in One Tool
Move from the map to a sortable table and a chart in one click, then export exactly what you see.
More Ways to Read the Grid
New views on the same interval data, built for the questions operators, traders and developers ask every day.
Animated Measured Flow Arrows
Arrows move along every measured line in the direction power is flowing. Their speed follows loading and their colour follows headroom, all in one smooth layer on the map.
Replay a Day and Jump to Price Event
Play back a market day across its 288 intervals at 1x, 4x or 16x. Each interval shows regional prices, the constraints binding on their lines with marginal values, and interconnector flow against its limit. Jump straight to the day's price spikes and negative prices.
Constraint Proximity
Click any point, unit or project to list the Grid Constraints within 5, 10 or 25 km, with binding hours over 30, 90 and 365 days, the average marginal value and when each last bound. Export the list as CSV.
Site Comparison
Put two to five candidate sites side by side: nearby headroom, binding hours, curtailment of nearby units, outage exposure and loss factors. Share the comparison by link or download it as CSV.
Bid-to-Dispatch Day Review
For one unit and one day, see offered bands against the dispatch target and available capacity at five-minute resolution, with the regional price and every constrained interval named.
Constraint Trend per Asset
Chart the constraints that hold back a unit or site month by month: binding hours for the top constraints and their average marginal value, with tables underneath.
Built on the Market Operator's Own Published Data
Every figure comes from the market operator's dispatch, network and settlement publications, read by our own pipeline. Each one is dated.
Who It’s For
Operators and Asset Owners
Explain every lost megawatt-hour the same day.
- Curtailment by cause with the revenue missed
- Outage risk card for each unit, 90 days ahead
- Bid-to-dispatch day review per unit
- Alerts for watched lines and units in your notifications bell
Traders and Analysts
Read the network behind every price move.
- Replay a day and jump to each price event
- Binding constraints with marginal values, every interval
- Interconnector flow against its limit
- Constraint trend per asset, month by month
Developers and Connection Teams
Rule sites in or out before the studies start.
- Headroom colouring across every Grid Constraints path
- Constraint proximity around any point
- Site comparison for two to five candidates
- Multi-year binding history per line
Included with Pro
Every Grid Operations view, from measured line flow to alerts in the notifications bell, is part of Pro and Enterprise.
Frequently Asked Questions
Where does the data come from?
From the market operator's published dispatch, network, outage and settlement data, read by our own pipeline. Every figure on this page is dated, and the methods are open.
How often is it updated?
Every five-minute dispatch interval, with a settled monthly archive behind it.
How do alerts reach me?
Alerts appear in the notifications bell inside Network Map. One click takes you from an alert to the line or unit on the map.
Which assets can I watch?
Any line, constraint, unit or site. You set the number of intervals, the curtailment share and the time window.
Which plan includes Grid Operations?
Every view on this page, including alerts in the notifications bell, is part of Pro and Enterprise.
Do I need a demo to start?
No. Sign up free and upgrade to Pro when you are ready. It is self-serve: pay by card or company invoice.
How are headroom and curtailment worked out?
Each method has its own documentation page, linked below, with the formula and the data behind it.
How Each Figure Is Made
Open methods for every number on this page.
Start Free, Upgrade When You Need the Evidence
Self-serve: pay by card or company invoice, no demo needed · Cancel anytime


