See the package and return path
Follow the example package export and view its imported simulation results in a saved screenshot. Run the package in your own licensed PSS/E.
Network Map Solutions
Prepare a study package in Network Map, run it in your own licensed PSS/E, and bring the output back for checks and review.
Free account. Paid plans from US$75/month.
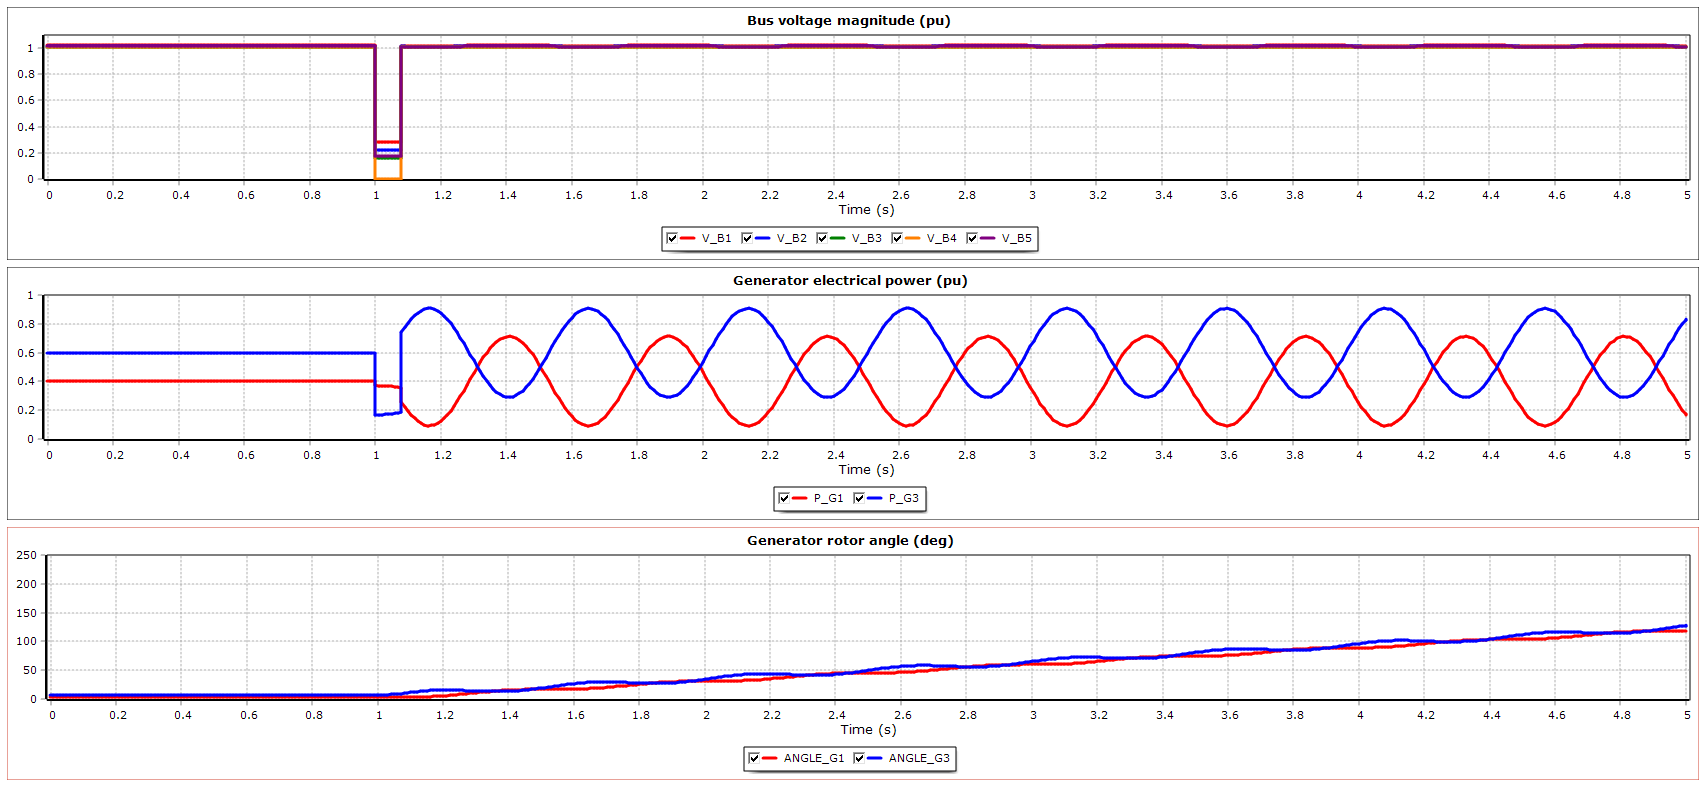
PSS/E 36 · example five-bus classical-machine case · saved simulation output showing bus voltages, generator power and absolute rotor angles. Open full-size image
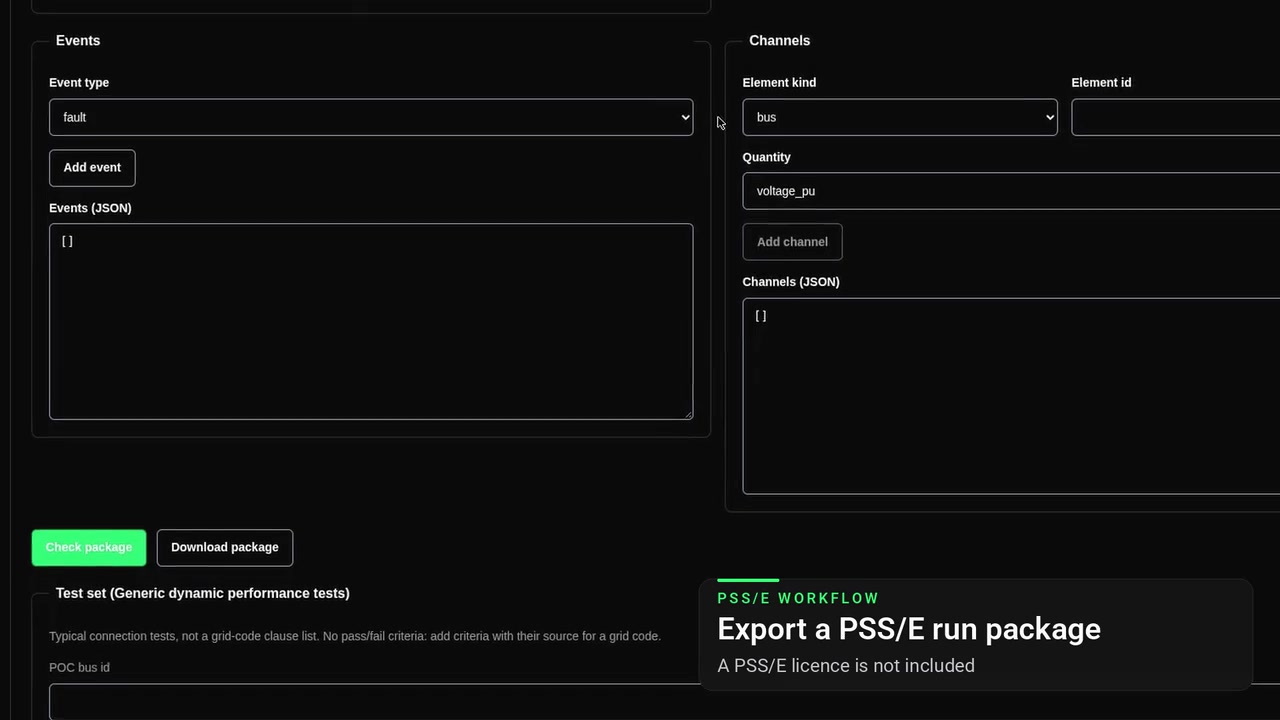
Review the case, tool version, event sequence, channels and timing. Keep the manifest with the exported files.
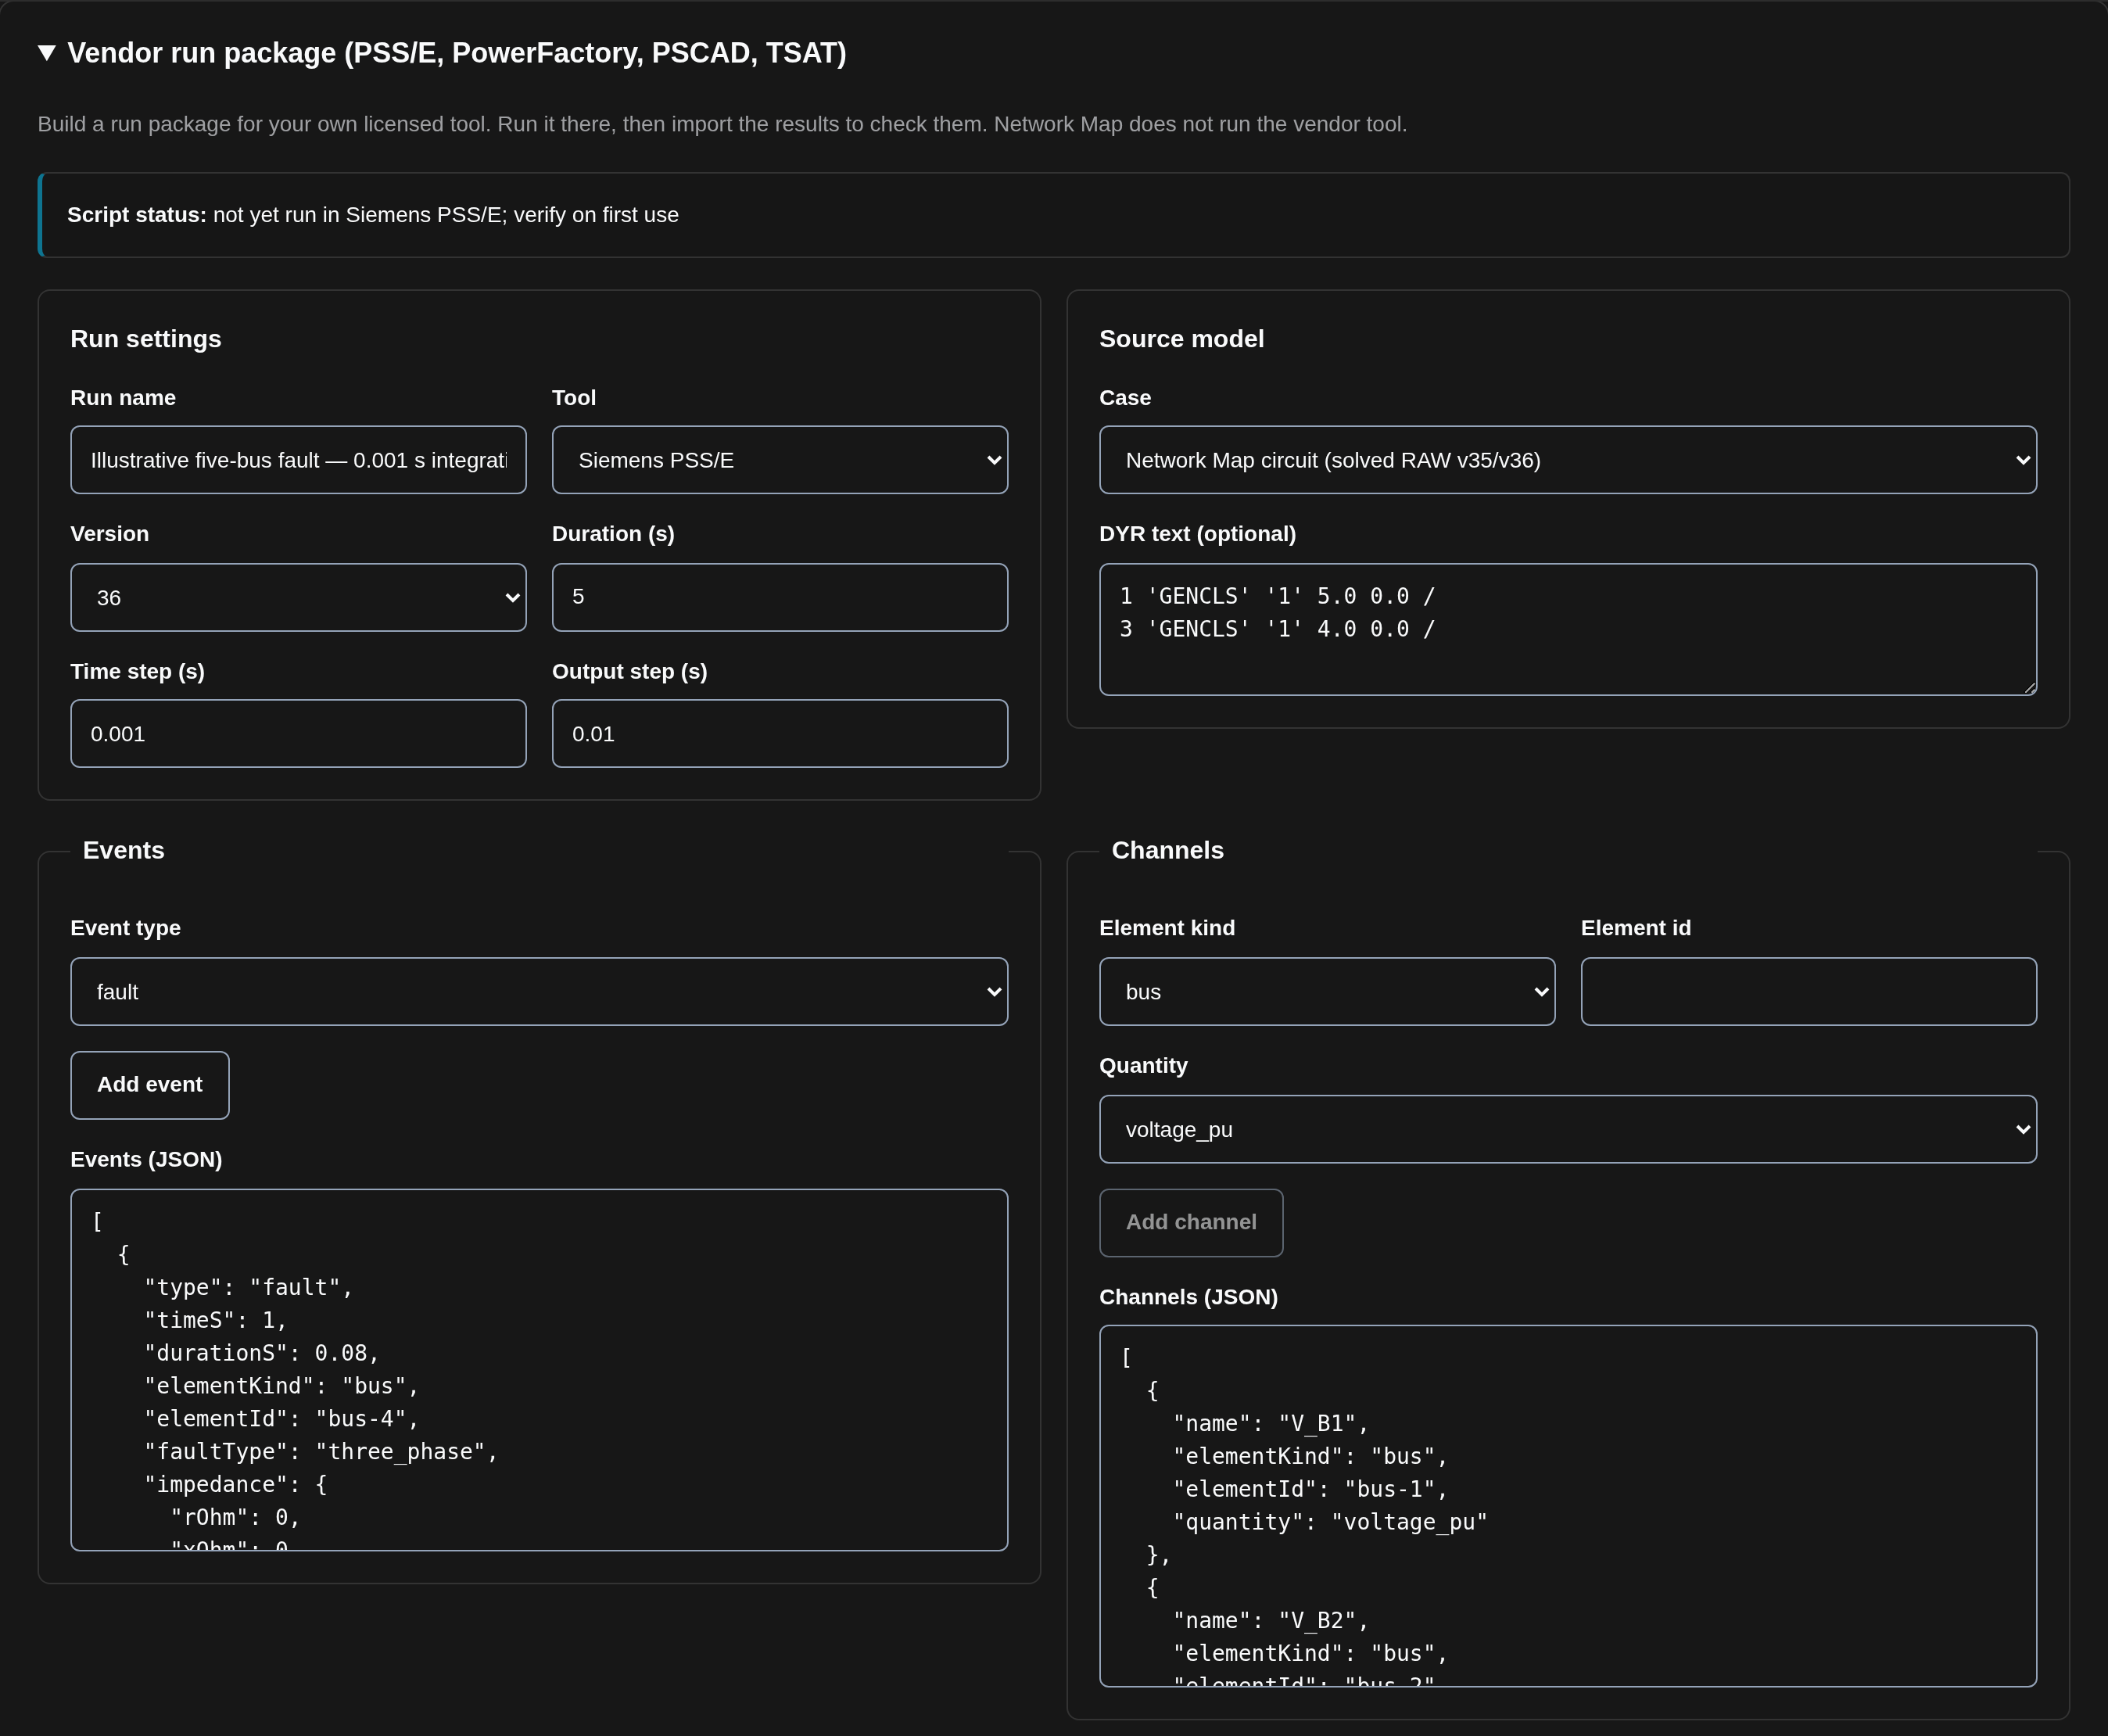
Package settings with DYR models, events and channels, ready to run in your licensed PSS/E.
Network Map prepares the handoff; PSS/E runs the simulation in your environment. A PSS/E licence is not included.

GENCLS classical machine models at buses 1 and 3 (150 and 100 MVA), loaded in PSS/E 36 for the example case. Open full-size image
Explore the example five-bus case through its diagram and dynamic plots in PSS/E 36.
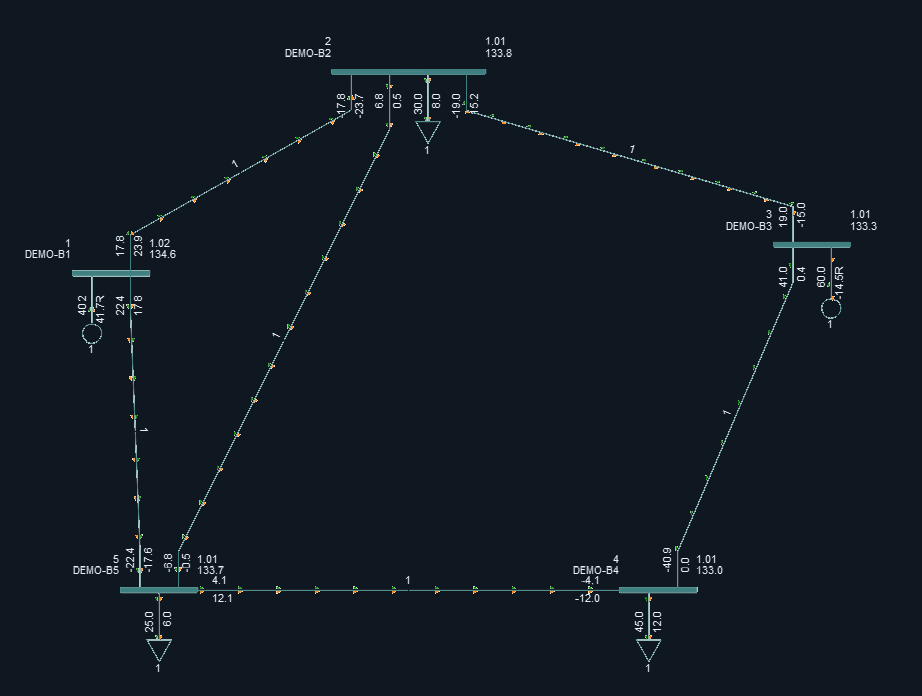
Bus voltage contour from the example five-bus power-flow solve in PSS/E. Bus voltages are about 1.01–1.02 pu, so the colours show a small spread. This screenshot has no colour scale. Open full-size image
Power flows (MW, Mvar) and bus voltages (pu, kV) from the example five-bus power-flow solve, shown in a PSS/E screenshot. Open full-size image
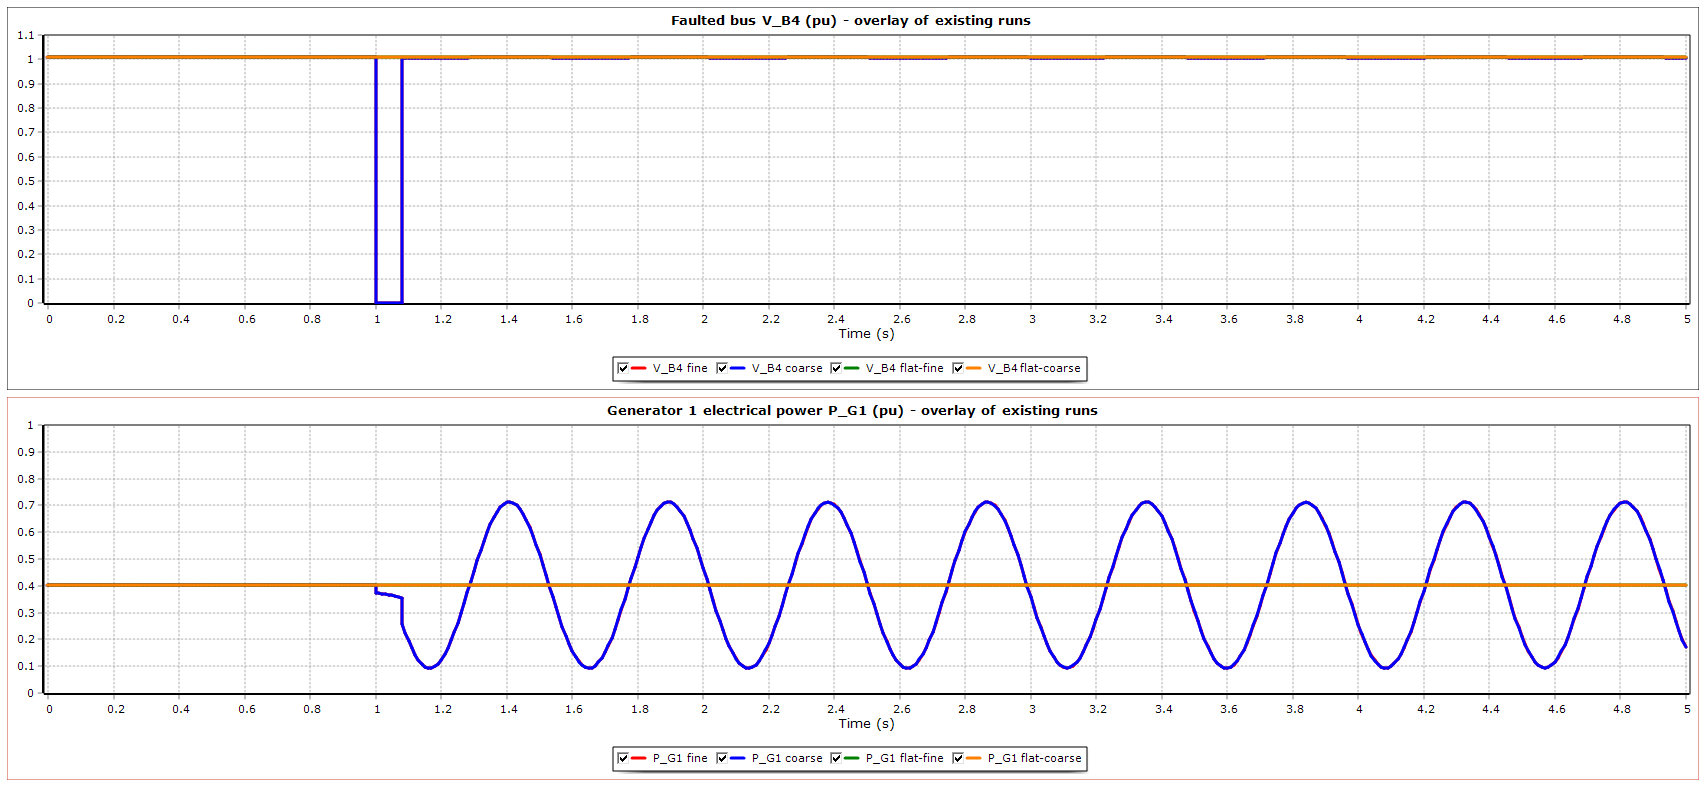
Four saved simulation runs in one PSS/E plot: a bus 4 fault and a no-disturbance case, each with a fine and a coarse time step. The fine and coarse traces overlap, so only 2 of the 4 legend entries are visible in each panel. Open full-size image
Bus voltages, generator power and absolute rotor angles from the saved classical-machine simulation in PSS/E. Both rotor angles rise together over the 5 s record; each trace shows its machine’s absolute angle. Open full-size image
Import the output into the matching workflow and read the validation findings.
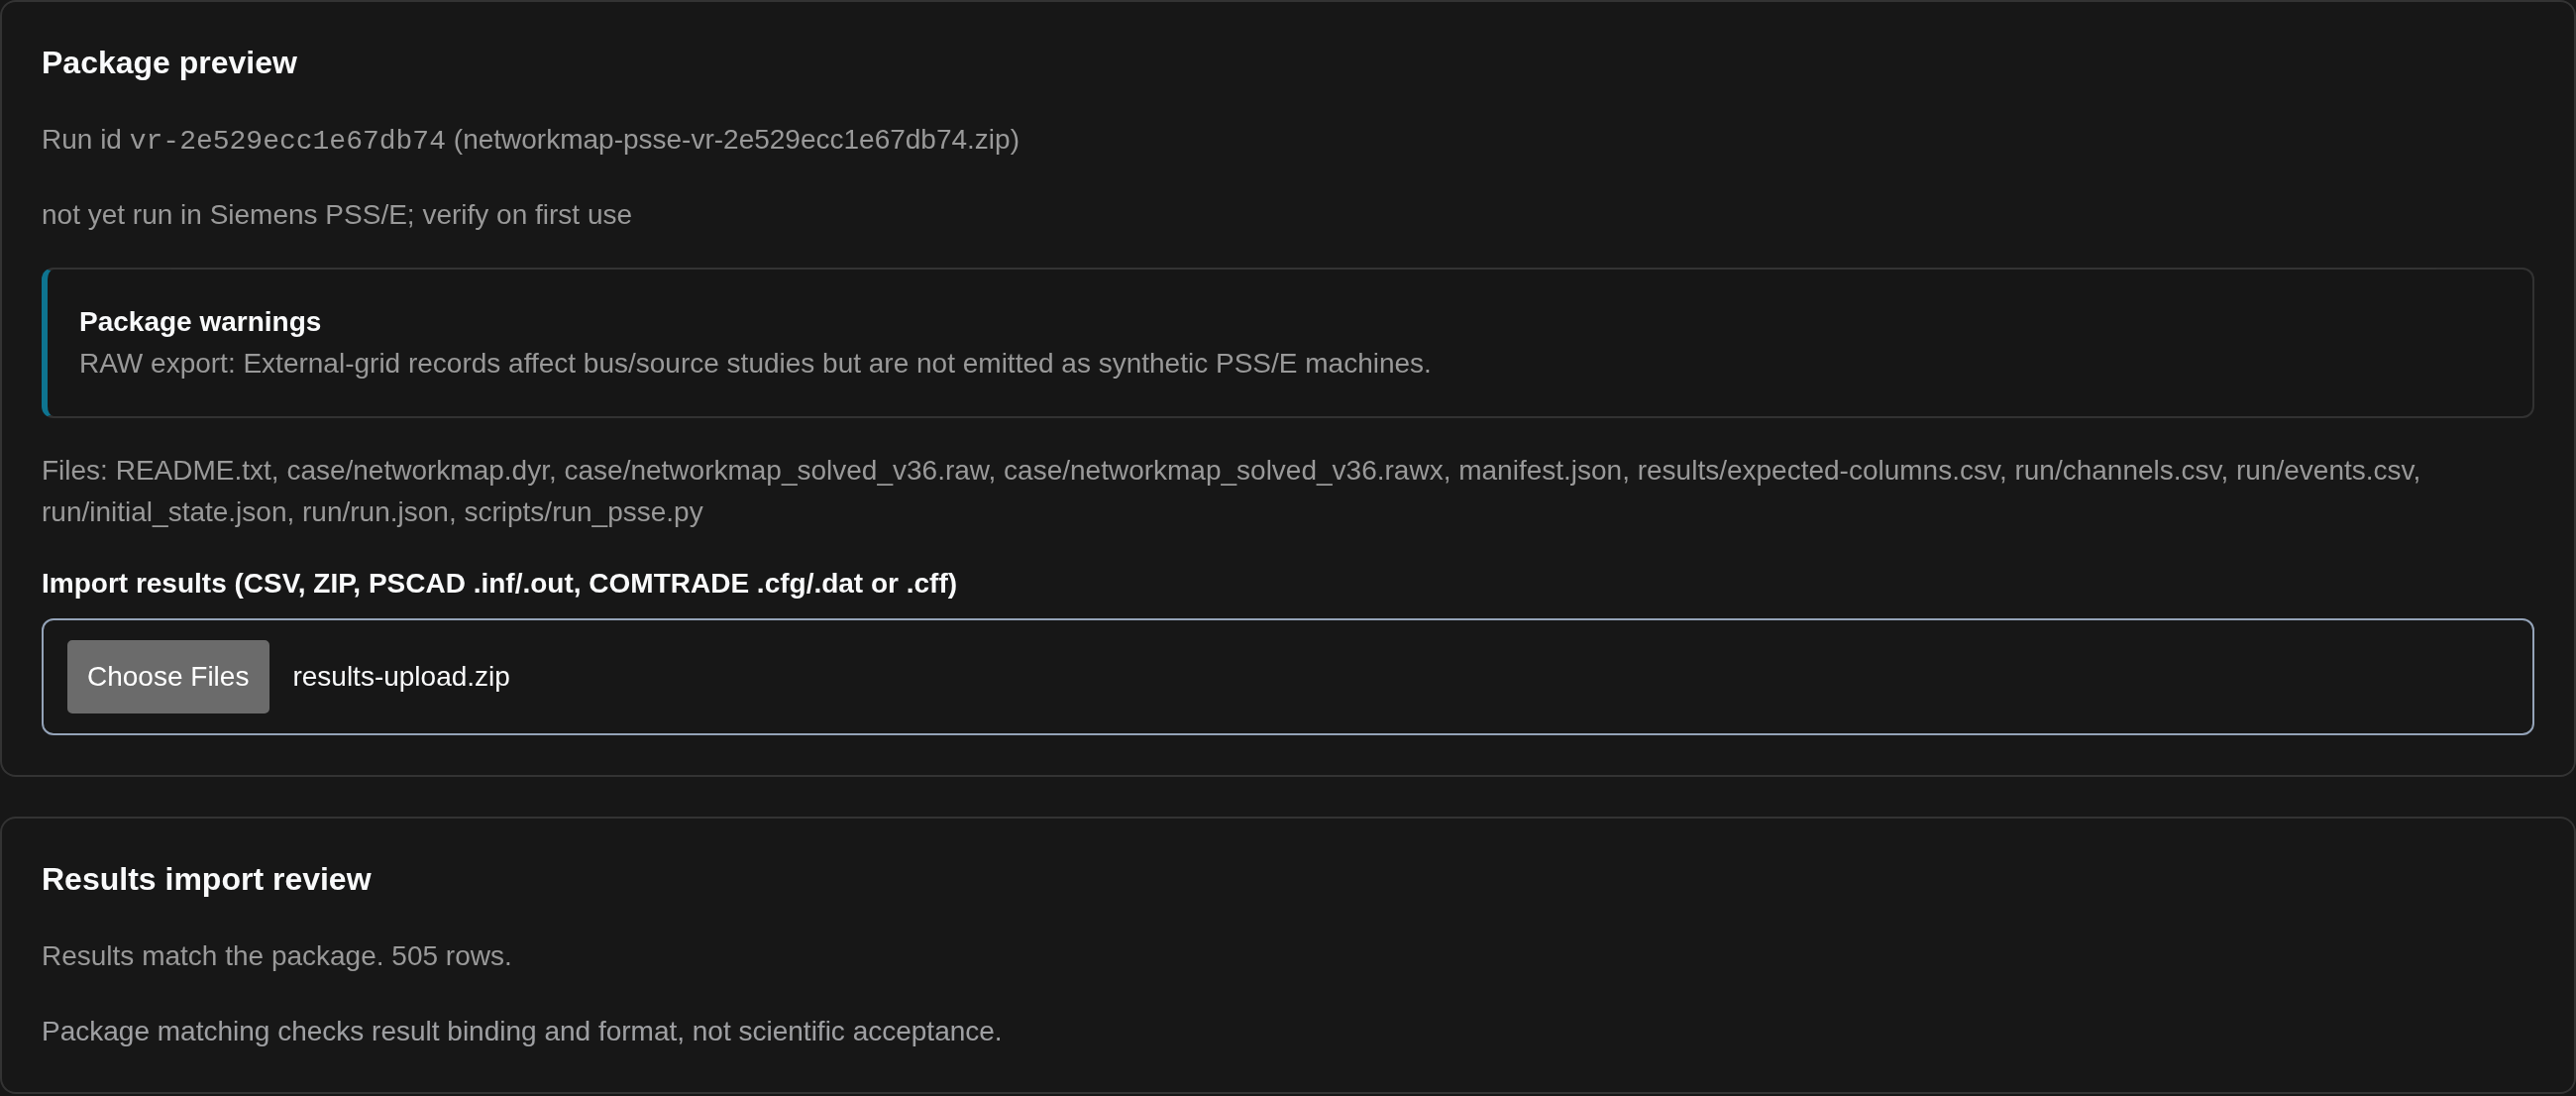
Native simulation results imported into the matching package: 505 rows checked for binding and format.
Plot native output, fit oscillation modes and compare signals.
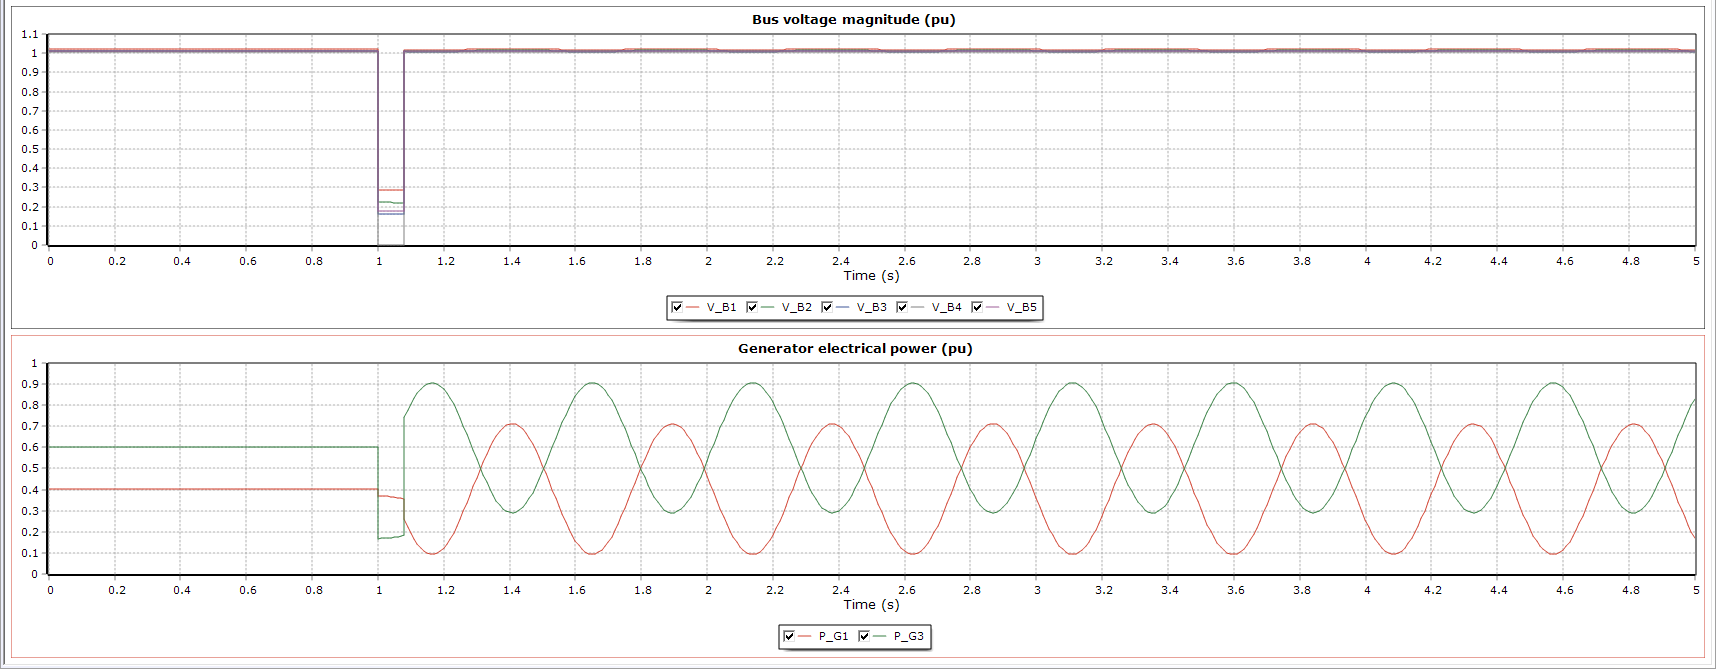
Native PSS/E PlotBook of the saved simulation output: bus voltages and generator power. Open full-size image
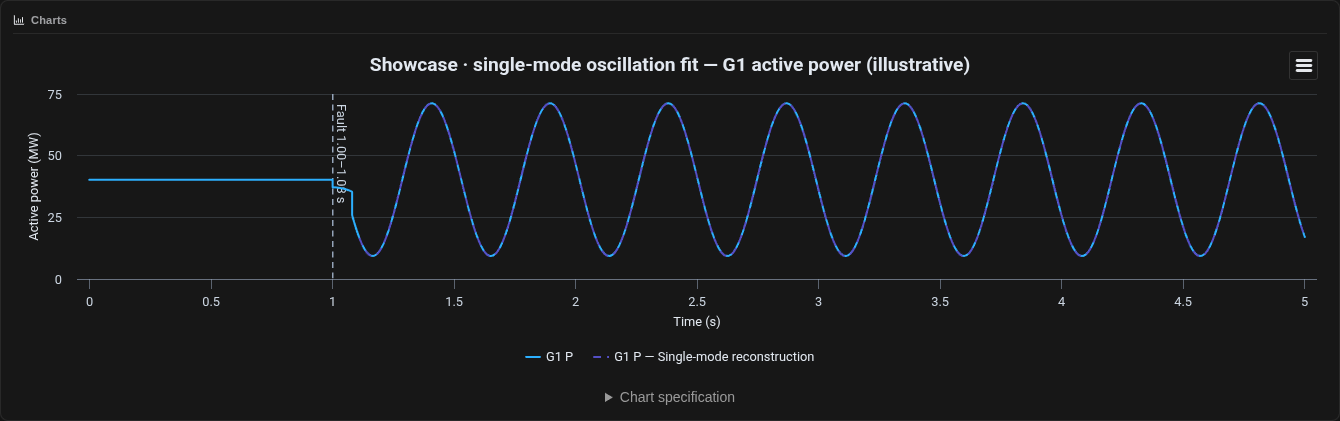
Oscillation fit on G1 active power: the trace with its single-mode reconstruction.
Choose a clip to play. These silent excerpts loop only after you start them; use the controls to pause.
Follow the example package export and view its imported simulation results in a saved screenshot. Run the package in your own licensed PSS/E.
Prepare a traceable package, run it in your licensed PSS/E environment and bring the results back into Network Map for comparison and reporting.

Copyright © 2017-2026 Network Map LLC