Network Map Solutions
From network model to reviewed study, in one place Build and run studies from your network inputs, then review results with the case and assumptions in one place.
Free account. Paid plans from US$75/month.
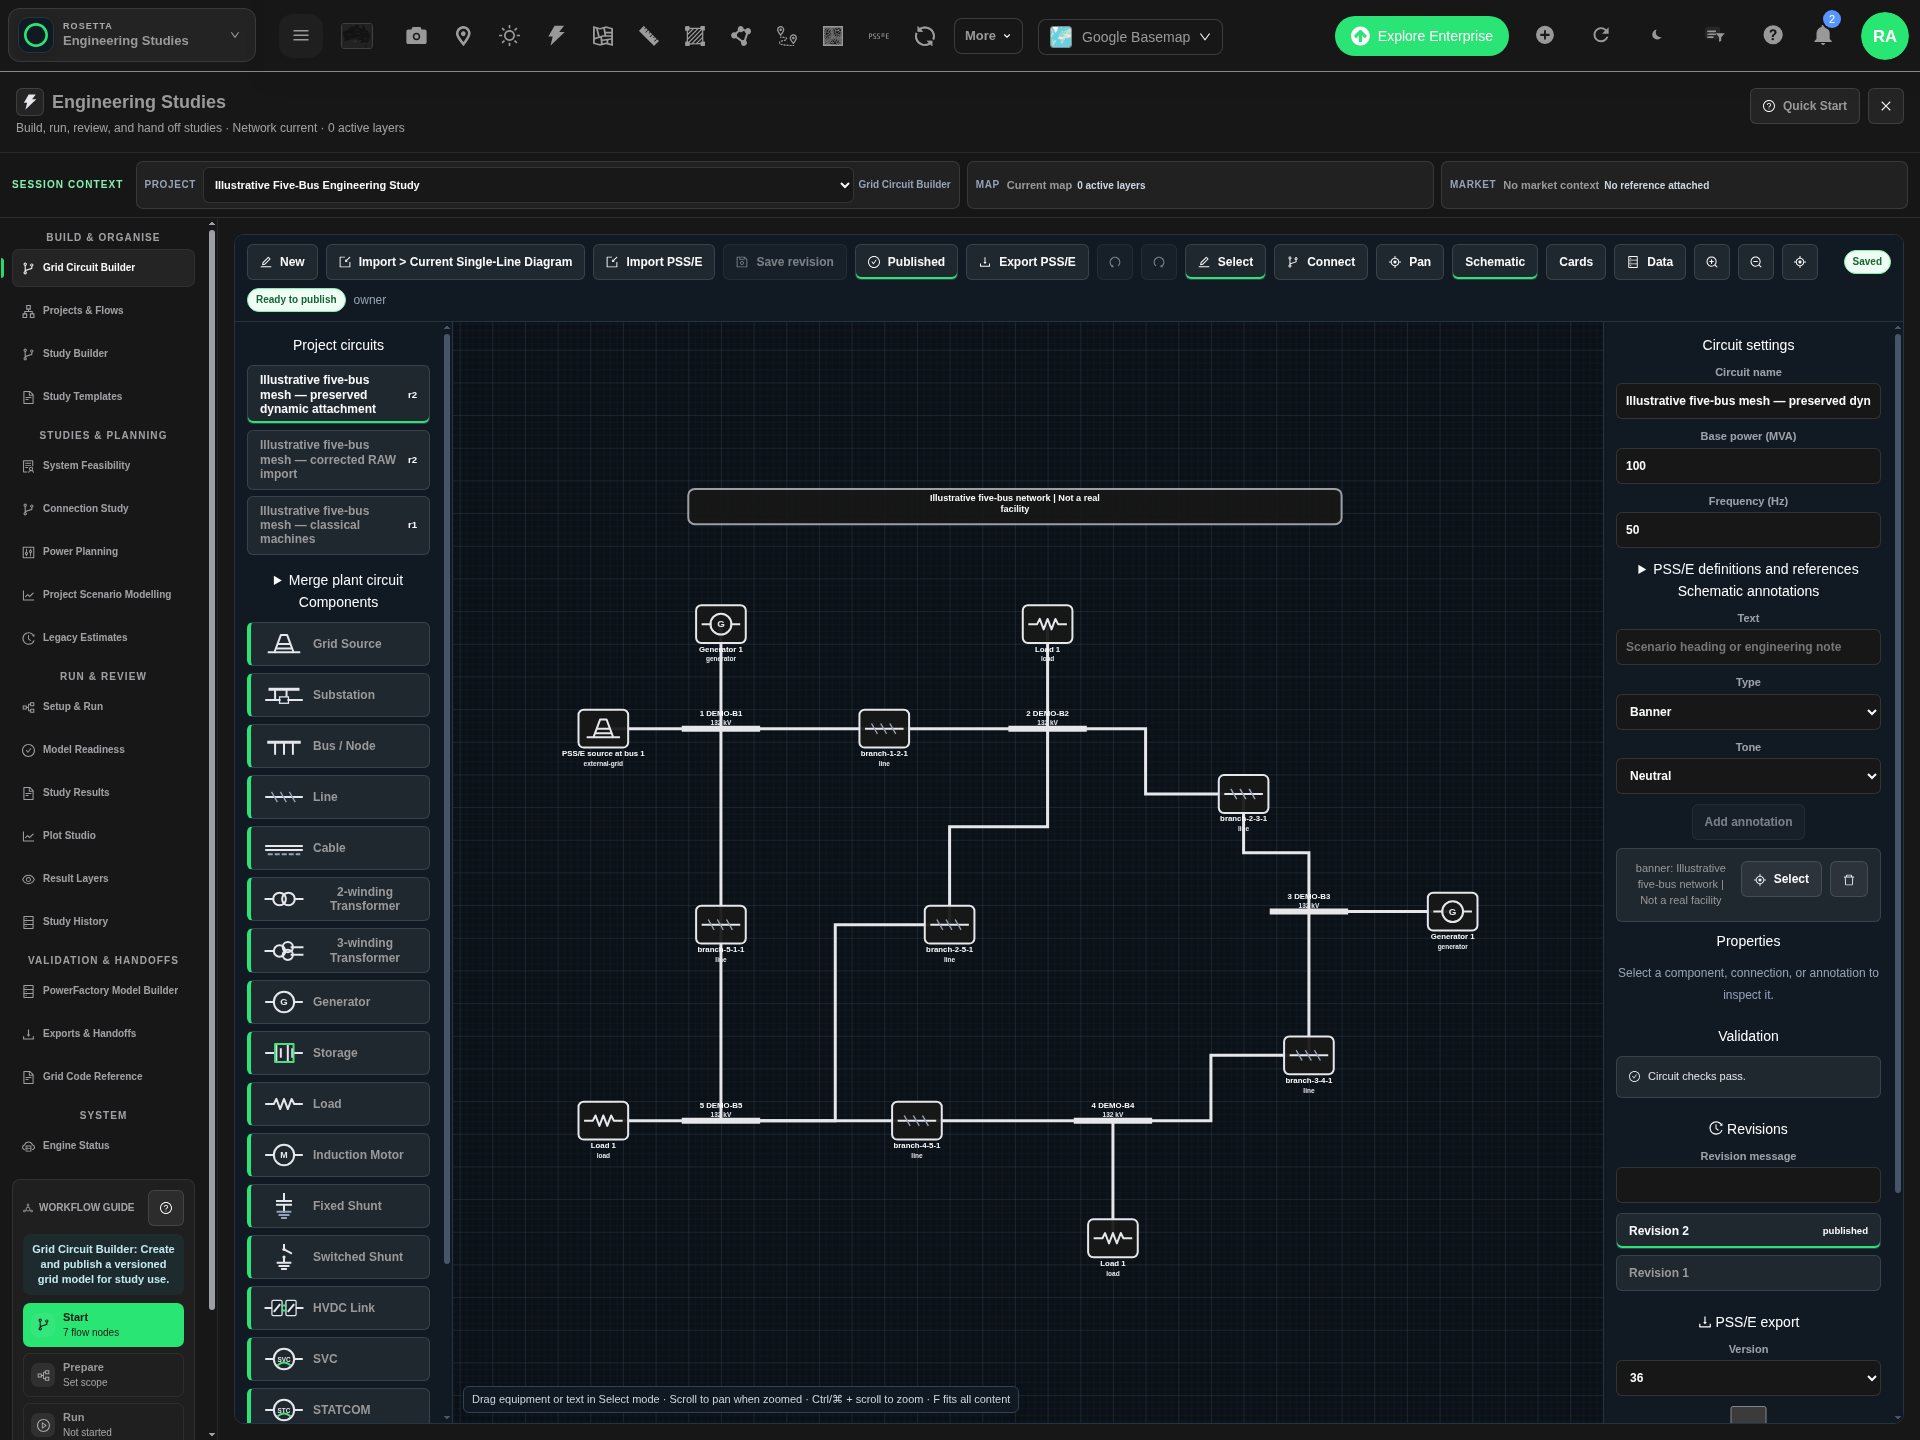
Example five-bus classical-machine network in Grid Circuit Builder, with simulated results.
Watch the engineering workflow From grid context to workflow, charts, licensed PSS/E handoff and report artifacts.
From study workflow to engineering report Open watch the complete film video Follow the example five-bus case from setup to saved simulation results and report artifacts. Line-flow context uses AEMO-published dispatch case files through 31 October 2026. PSS/E scenes show saved output screenshots, including absolute rotor angles. PSS/E runs in your own licensed environment; a PSS/E licence is not included. Music plays only when you start the film.
Open full-size video Open poster image
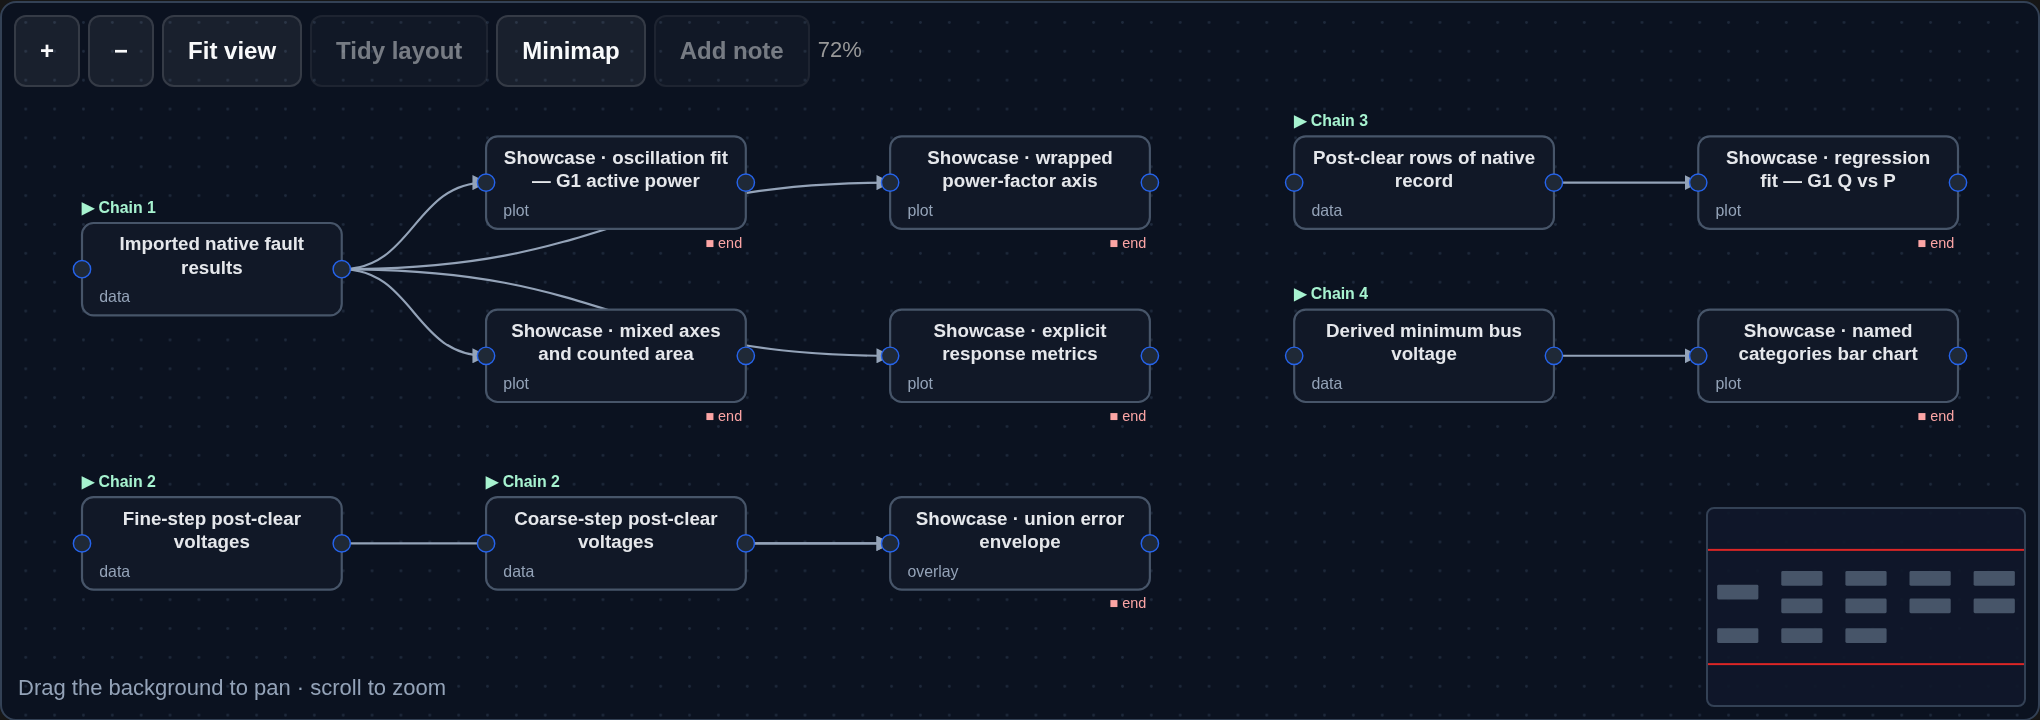
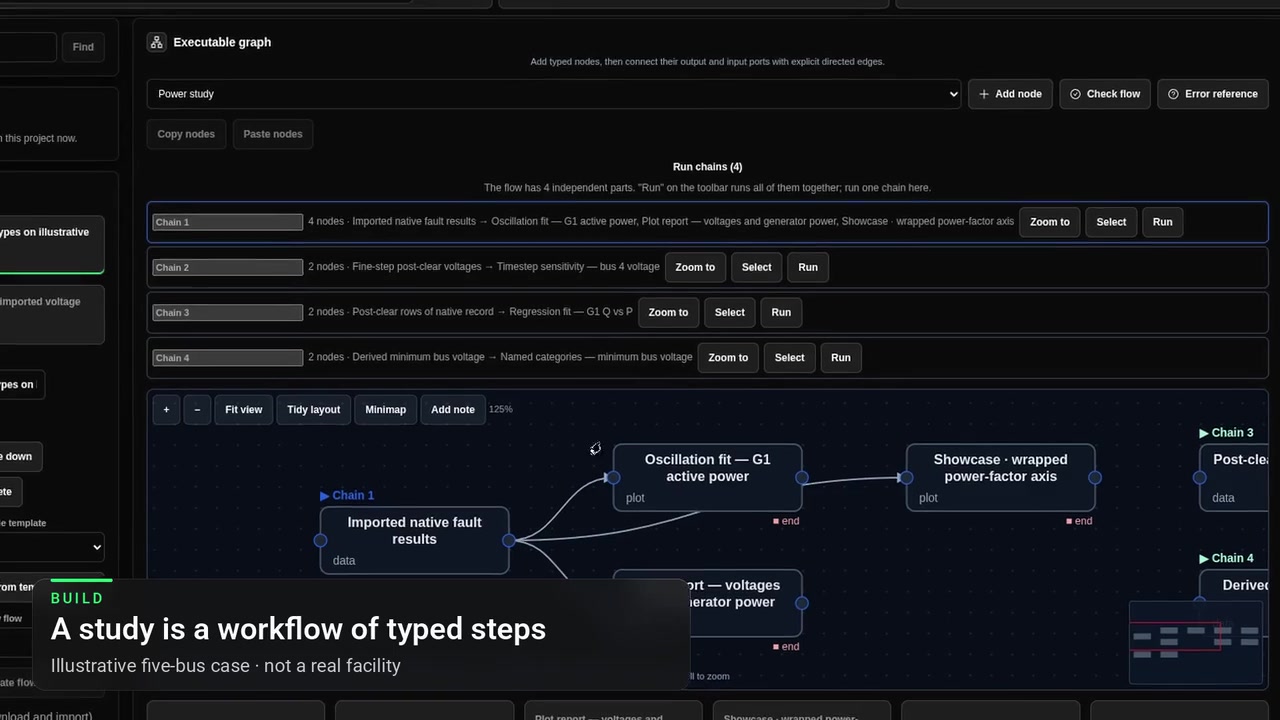
Who it is for Consultants preparing connection and dynamic studies for clientsDevelopers checking a project before formal submissionNetwork service providers reviewing submitted models and resultsStudents learning study workflows through a worked exampleGive the workflow a clear structure Use Projects & Flows to connect model inputs, study steps and result review. Save the revision you intend to run.
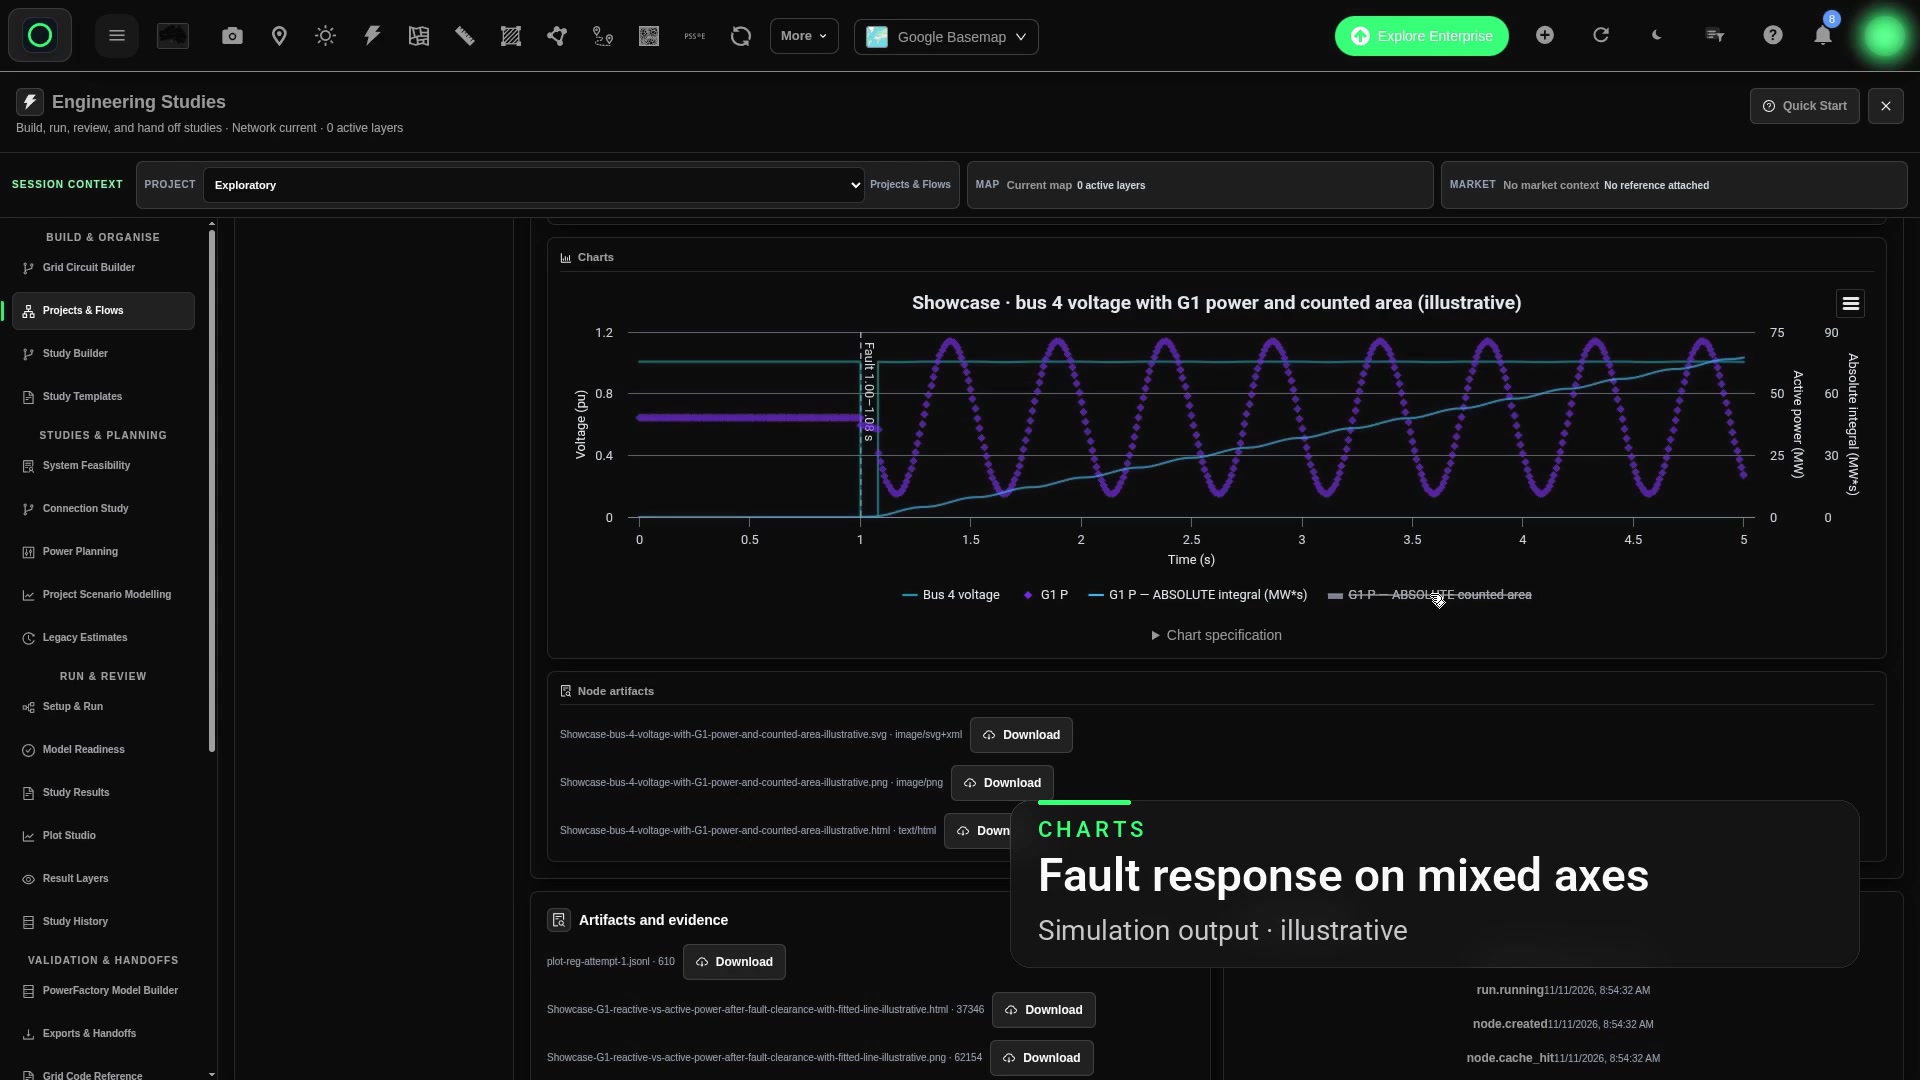
Each chart is a node in a saved flow, tied to its source data and run.
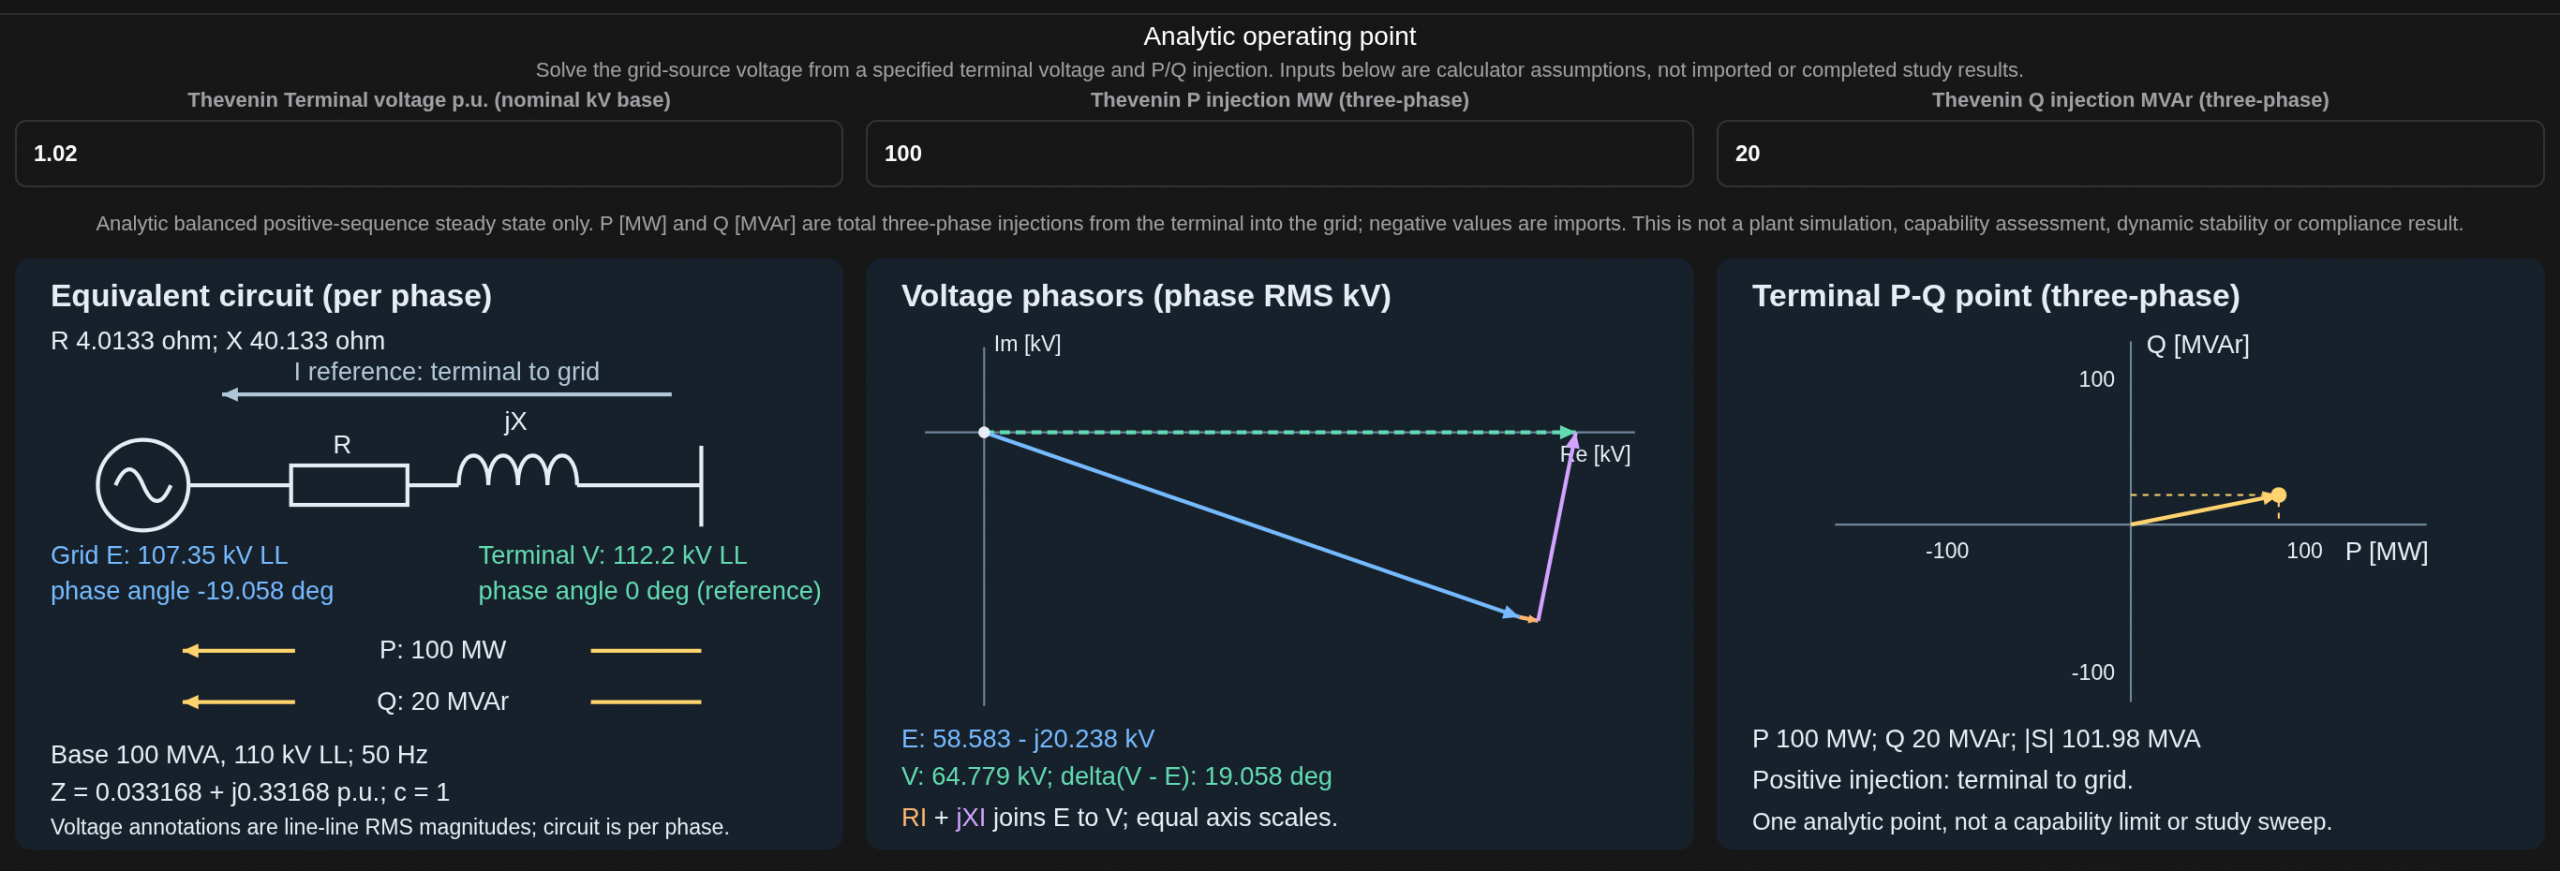
Check the operating point The Thevenin calculator gives a quick analytic view of a connection point, with its assumptions in view.
Thevenin equivalent: one analytic point using calculator inputs of 100 MW and 20 MVAr at 1.02 pu on an SCR 3 source.
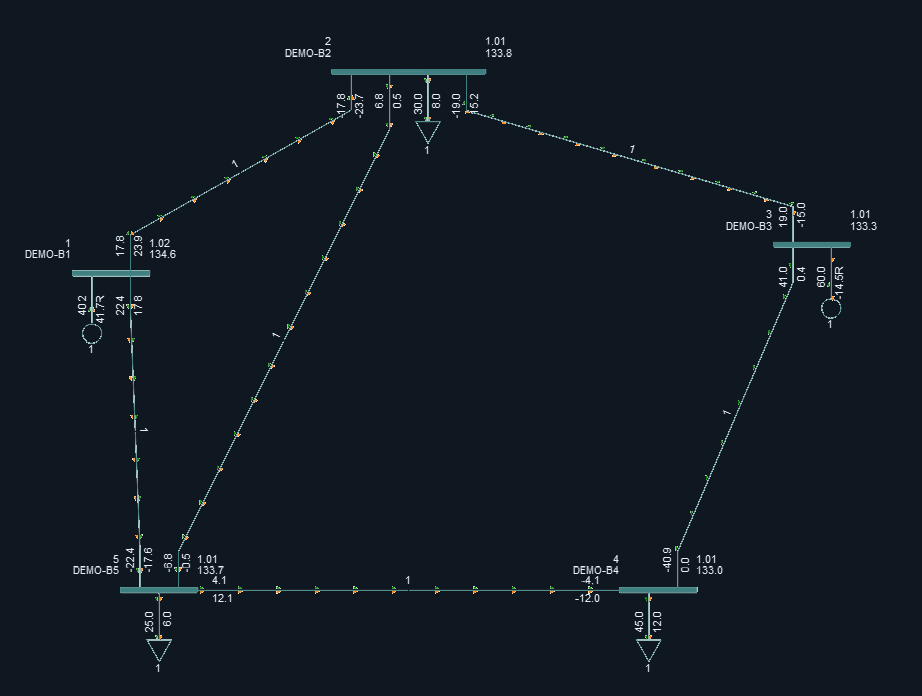
Run vendor studies where they belong Prepare a PSS/E package, run it in your own licensed environment, then bring the results back for review. A PSS/E licence is not included.
Power flows (MW, Mvar) and bus voltages (pu, kV) from the example five-bus power-flow solve, shown in a PSS/E screenshot. Open full-size image
Review the result in context Compare results with units, assessed limits, warnings and case assumptions in view. Use the run record to focus your engineering review.
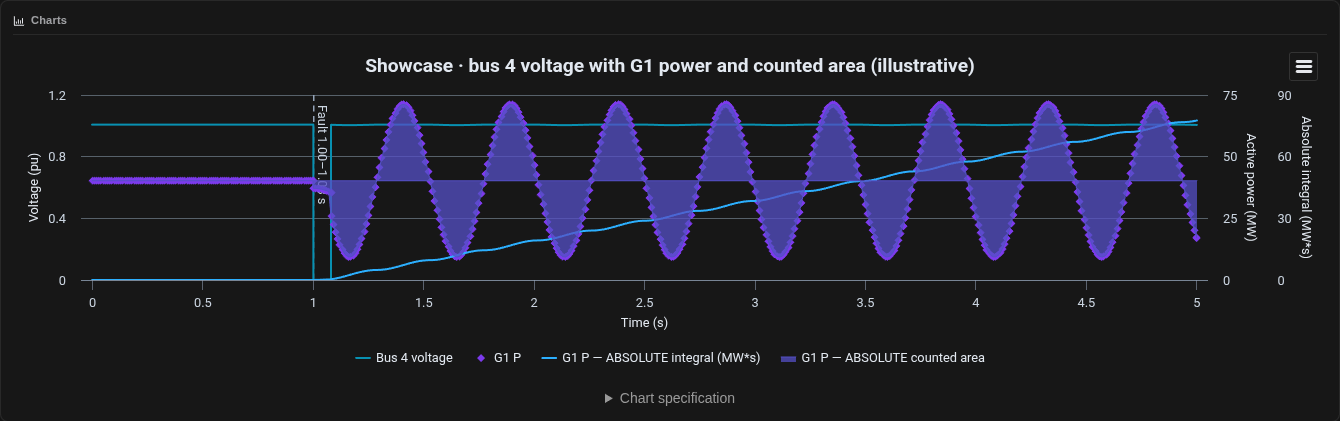
Chart from a workflow plot-report node: bus 4 voltage and G1 power on a shared time axis, with the counted area shaded.
Explore the workflow in short clips Choose a clip to play. These silent excerpts loop only after you start them; use the controls to pause.
Build your next study Bring your network model, inputs and study criteria into one workflow. Compare results and prepare a report with the full run record.
Related Pages