On 10 November 2026, the forecast sources selected for wind and solar dispatch changed sharply in the Australian wholesale electricity market. AEMO public tracking records show a switch away from the central forecasting source, with measured-output persistence selected for many units instead.
The useful finding is in the inputs to dispatch, not a claim about lost generation. Our count follows 207 unit records in each reported interval. It does not measure their electricity production, establish a software fault or determine whether system frequency changed.
A Forecast Source Is Not An Output Reading
Four different items matter when investigating a dispatch event:
- Selected forecast origin: the source recorded for the forecast used in that dispatch run.
- Availability: the forecast of a unit’s available power before dispatch limits are applied.
- Dispatch target: the power level cleared for the unit by the market operator.
- Measured generation: the unit’s recorded power output, which must be checked separately.
A persistence forecast uses the initial measured output as its forecast input. Selecting that source does not mean the unit stopped generating. Nor does a source label tell us how many megawatts were available, targeted or produced. The figures below count unit records, without weighting them by capacity.
The Change Appears In The Source Counts
All times here are interval-ending market time, fixed at UTC+10. They do not move with local daylight saving.
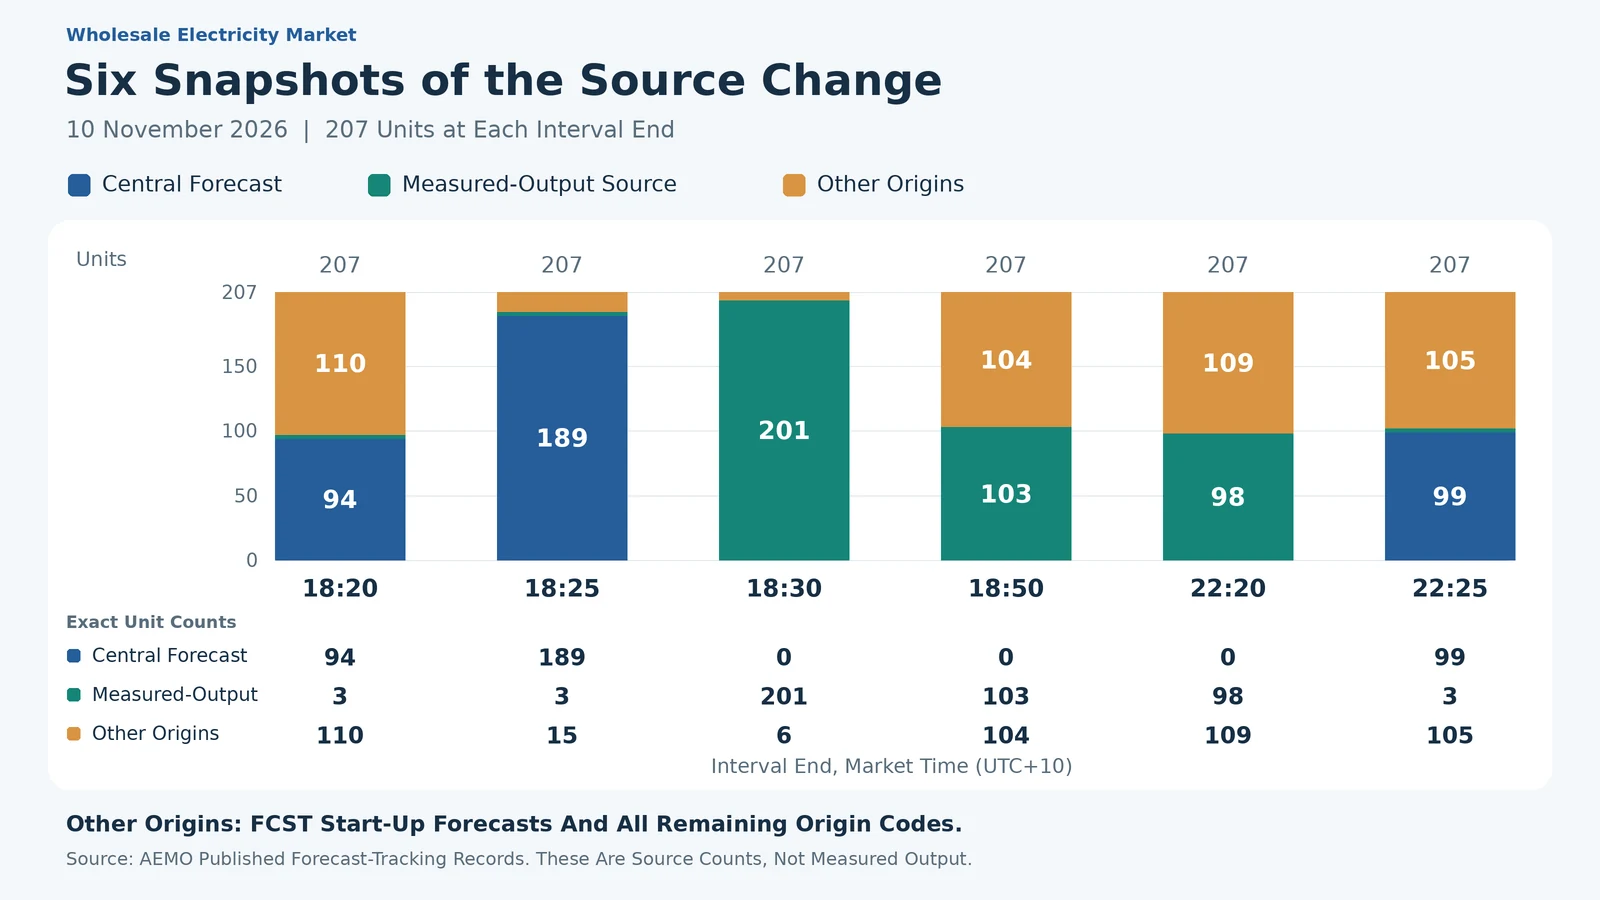
At 18:20, the central forecasting source was selected in 94 of the 207 records. At 18:25, that count rose to 189. At 18:30, it fell to zero: 201 records selected measured-output persistence and six used other origin codes.
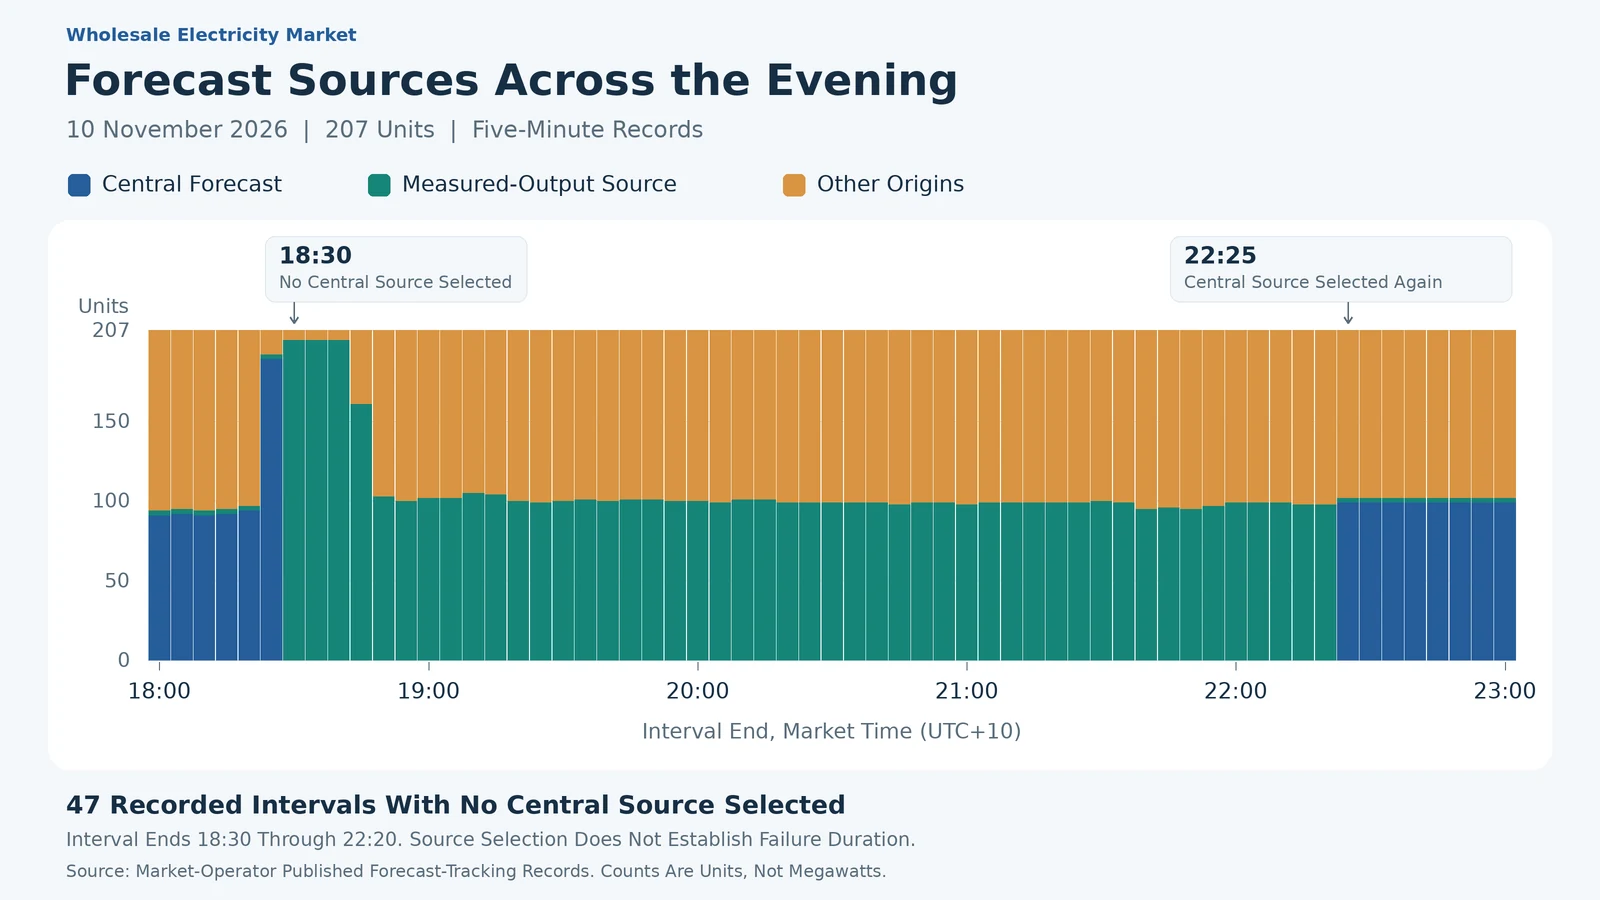
No record selected the central source at 47 consecutive interval-ending timestamps from 18:30 through 22:20. It appeared again in 99 records at 22:25. The composition changed within that window: by 22:20, 98 records selected persistence and 109 used other origins.
This 47-timestamp window concerns selected-origin records only. It is not a measured duration of complete forecasting-service failure. AEMO defines AWEFS_ASEFS as the central source and SCADA as measured-output persistence. The Other origins category combines FCST and every remaining origin code. AEMO identifies FCST as a start-up forecast. The cited definitions do not assign every other code to a participant or vendor, and this grouping does not describe one common method.
What The Records Cannot Explain
Two separate market notices recorded completion notifications for the same electricity market management system datacentre-maintenance change. The first was issued late on 10 November and the second on 11 November.
The notices provide maintenance context without stating a forecasting fault, outage duration or frequency result. The selected-origin records alone do not establish causation, a plant outage, lost energy or an ancillary-service response.
Keep The Evidence Separate In Network Map
Start with the unit identifier and the exact interval. Network Map’s asset-economics guide distinguishes Bid to Dispatch, which compares available capacity and dispatch targets, from unit rankings based on measured output. A ranking over a longer period cannot replace an interval-level generation trace.
The East Coast Live Market guide explains regional prices, generation, coverage and published-interval timing. Use those views to add market context, while keeping measured output separate from forecasts and targets.
Then check the curtailment methodology. Network Map derives curtailment from the positive difference between availability and dispatch target. That estimate is not measured foregone generation or evidence that a forecasting service failed. Missing inputs, unknown causes and incomplete coverage must remain visible.
The forecast-origin dataset used here is separate public evidence. This article does not present it as a live Network Map panel. Place dispatch and network context alongside the records, with the measurement basis kept clear.
Sources And Method
We counted the selected-origin field in the market operator’s published next-day intermittent dataset. The file contains 288 intervals, from 10 November 04:05 to 11 November 04:00, with no duplicate interval-unit keys in the tracking table. This is the file’s reporting window, not a midnight-to-midnight day.
Maintenance context comes from notice 146239 and notice 146240. WattClarity’s coverage identified the topic; the counts and original figures here come from the published primary records.
AEMO’s table definition identifies the selected forecast and interval-ending timestamp. Its forecast guidance defines persistence, and its market-time specification sets the UTC+10 convention. We grouped every origin code other than AWEFS_ASEFS and SCADA into Other origins. This preserves the observed FCST start-up code without assigning an undocumented method to the remaining codes.