Battery Study Inputs
Before comparing battery-study returns, check that the saved model and observed data describe the same site, quantity and period. This article explains that evidence-alignment workflow. A separate physical and financial review must cover the battery model itself.
This is a practical validation workflow in Network Map. It uses the published demonstration cases in our Tracking and Profile Validation guide. The example readings are authored inputs, not measurements from an operating battery and not evidence of investment returns.
Start With The Comparison, Not The Return
Choose the question first. Are you checking site demand, battery power, imported energy or an interval cost? These are different quantities. A power reading in kW cannot be compared directly with energy in kWh. An interval cost cannot stand in for a full annual bill.
Record the site boundary, unit, sign convention, sampling interval and timezone before importing observations. Confirm whether a timestamp identifies the start or end of the period in your source. Keep the original file so another reviewer can trace each value. These checks let reviewers explain a residual rather than just report it.
For the battery model, review the saved case separately from the supplied observations. Use the dispatch and sizing guide to check:
- Rated power, energy capacity, duration and efficiency assumptions.
- Minimum and maximum state of charge (SOC), plus the initial SOC and any physical end-of-window target.
- Net charge and discharge bounds, including the stated sign convention. Positive net charge means charging.
- Site and connection limits, SOC continuity, and the selected scheduling or lookahead method.
- Decision prices, including whether only past observations are known or future prices are idealised as known.
- Tariff, currency, capital and lifetime assumptions when translating interval behaviour into financial results.
Snapshot approval preserves the reviewed source. It does not certify those physical inputs or a projected return.
Freeze The Evidence You Actually Reviewed
With Professional access and an engineering project, open Project Modelling > Profiles > Tracking. Create a CSV source and upload observations that you have permission to use. This connector accepts a file; it does not automatically collect live measurements.
Use explicit units and timestamps with a UTC offset or Z. Inspect the signal for cadence, missing intervals, null values and observation reasons. If you exclude a window, record the reason. Then review the mapping and approve an immutable profile snapshot.
The snapshot keeps the reviewed input stable. Changing the source later does not change that approved copy. Approval also does not replace a model input or rerun a case. Validate the intended snapshot and download its JSON validation report as part of the study record.
Count Paired Intervals Before Reading Errors
In Profiles > Saved Detailed run performance, select a completed Detailed run from the same project. Choose the actual signal, the model dataset and the modelled quantity. Enter an explicit comparison window with an exclusive end timestamp. Check the saved run’s revision, profile source and timeline.
Our documented example has four hourly input readings: 80, 90, 100 and 95 kW. Its input validation reports four usable rows and no issue rows. But comparing those readings with a full 24-hour model window produces only 4 of 24 paired intervals. The other 20 hours have no paired observation. They are not zero demand.
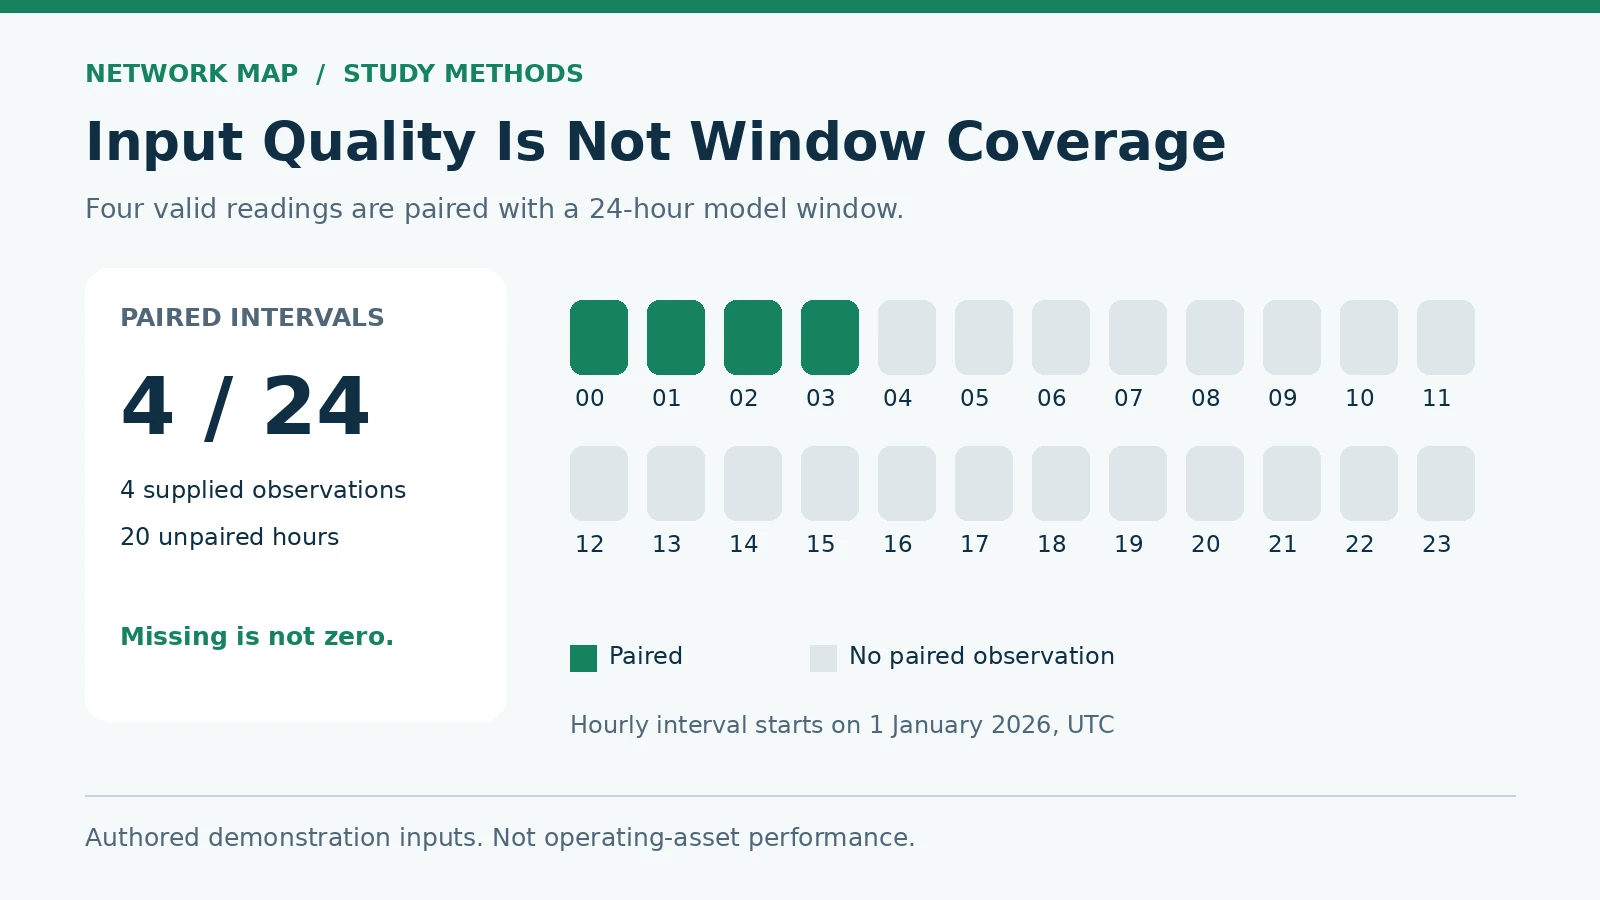
The saved model has 1 kW of load in each hour, far below the example readings. That mismatch exposes a difference in site scale. Confirm that the model and the reference represent the same case before evaluating battery-controller performance.
Keep Interval Money Separate From Annual Results
A second documented example uses four hourly demonstration import costs: 0.30, 0.35, 0.40 and 0.45 AUD. The four-hour window has four paired intervals. The inputs total 1.50 AUD; the saved model’s total import cost over the same four-hour window is approximately 0.7151 AUD. Input minus model is approximately 0.7849 AUD.
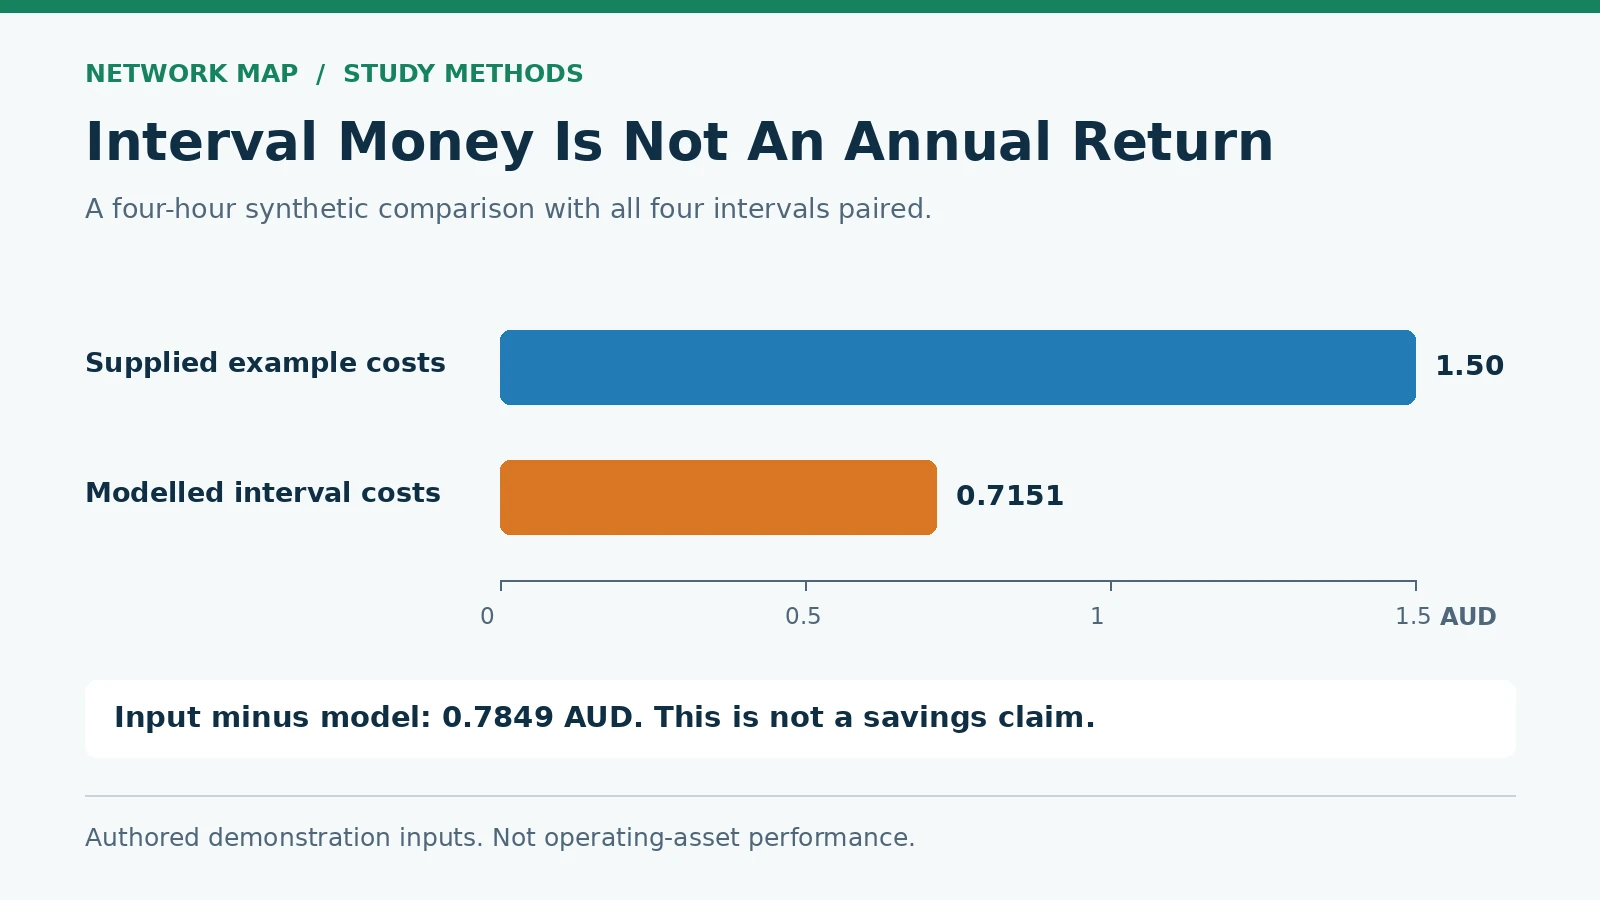
These are interval comparisons, not a complete bill or a return calculation. The interval-money view excludes period charges, capital, terminal adjustments and annual scaling. Keep it separate from the annual Participant money (annual model, not interval actuals) table. Grouping a short comparison by calendar year does not make it a measured full-year result.
Build A Reviewable Battery Study
Keep these review records together:
- The approved profile snapshot and its downloaded validation report.
- The saved run revision, profile source and modelled quantity.
- The explicit comparison window, unit and sign convention.
- The paired-interval count and any unpaired coverage.
- Any difference in site scale, timezone, interval boundaries or financial basis.
Once the operational quantities are comparable, review the tariffs, costs, physical limits and decision-information assumptions. Our dispatch and sizing guide covers battery operating bounds, SOC, power and duration choices, and decision prices. These checks prepare the study for a financial comparison without treating data alignment as a performance or bidding-method verdict.
Method And Sources: Original Network Map workflow analysis using the published Tracking and Profile Validation demonstration cases and the battery-modelling guide above. The numerical examples use authored inputs from the guide. They are not operating-asset measurements or an optimiser ranking.