


Market analysis of 11 October 2026
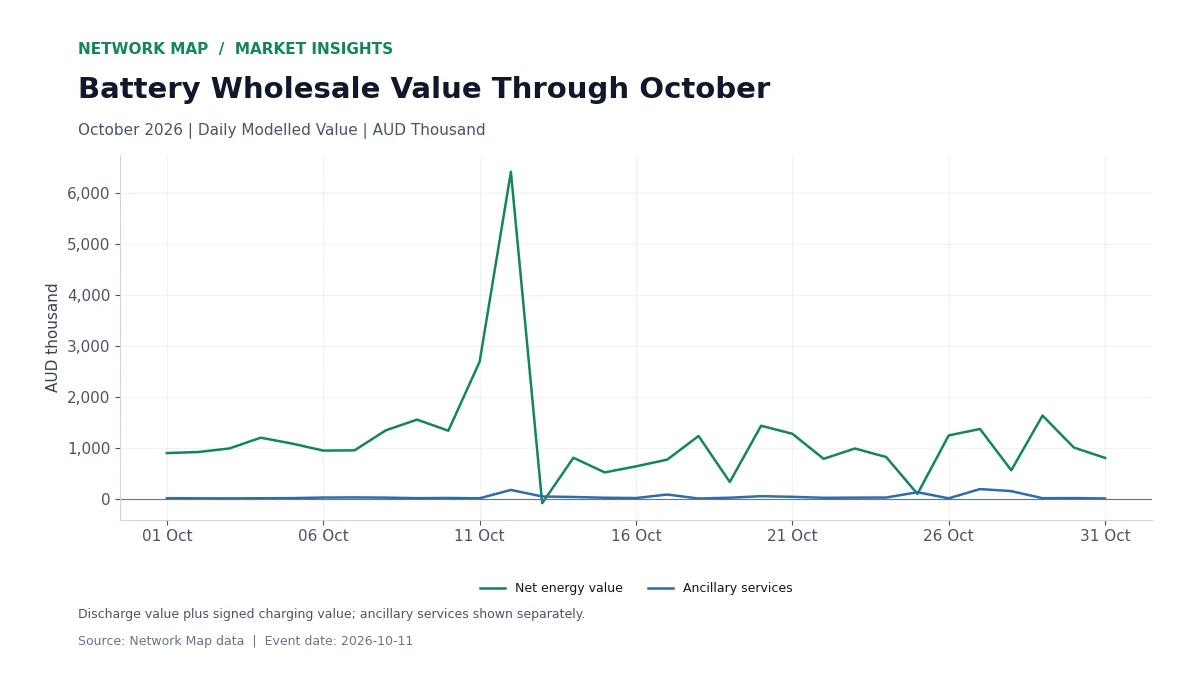
Network Map’s battery cohort recorded modelled wholesale value of AUD 2.72 million on 11 October 2026 across 68 units. That was the 2nd-highest daily total of the 31 dates in October 2026. The cohort discharged 11,995 MWh.
Net energy value was AUD 2.70 million: discharge value of AUD 2.18 million plus signed charging value of AUD 516,189. Ancillary services added AUD 20,106, or 0.74% of the combined total.
The Day In Its Monthly Context
The first chart places 11 October alongside the other dates of October 2026, splitting each day into net energy value and ancillary-service value. It shows whether the day stood out because of energy prices or because of ancillary services.
How The Regions Compared
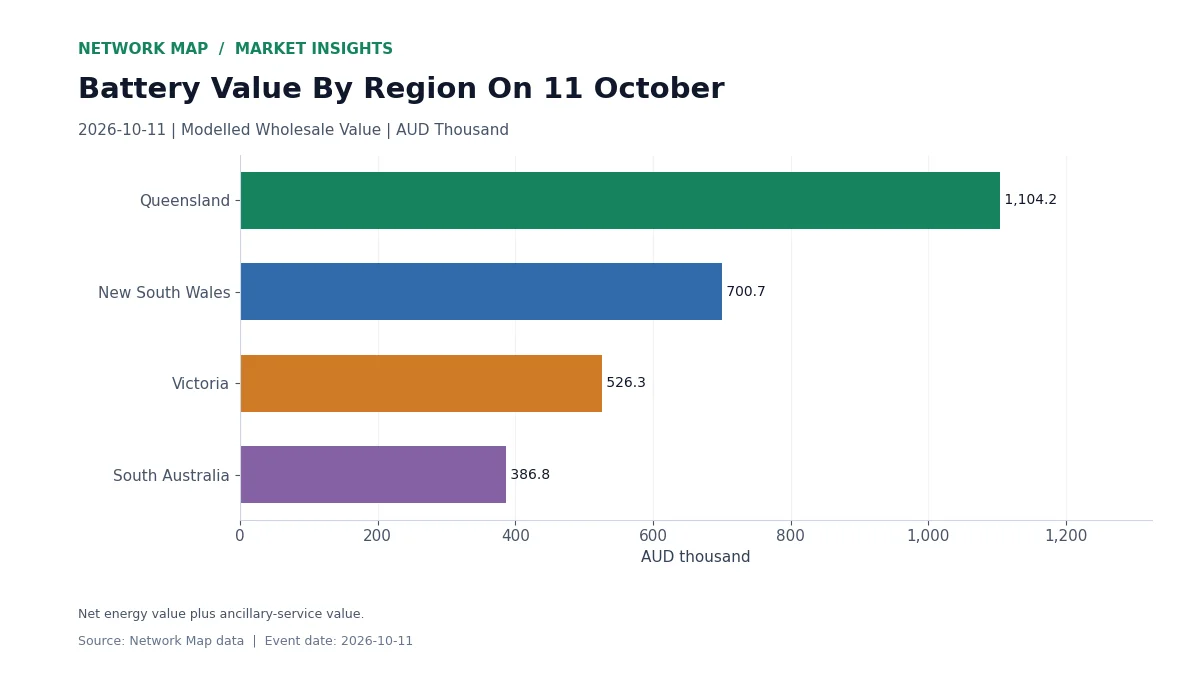
Batteries in Queensland recorded the largest regional total, AUD 1.10 million from 15 units. New South Wales recorded AUD 700,707 from 18 units; Victoria recorded AUD 526,283 from 17 units; South Australia recorded AUD 386,755 from 18 units.
Charging value was positive in Victoria and South Australia, which happens when batteries charge while prices are below zero.
Using The Day For Battery Benchmarking
A high-value day is a useful benchmark: first find when value was concentrated, then separate the energy and ancillary-service products behind it. Comparing a single battery with its regional cohort on the same day shows how its dispatch captured the price spread.
Figures are modelled wholesale value from Network Map’s battery daily totals for 11 October 2026: discharge value plus signed charging value plus ancillary-service value, for intervals ending 00:05 to 24:00 UTC+10.
Explore The Data
Battery Revenue Benchmarks, Revenue Reconciliation, Markets.


