Market analysis of 11 October 2026
Modelled renewable curtailment reached 82.90 GWh across the five regional series for the market day dated 11 October 2026. It was the highest daily total in the October 2026 extract. Available energy totalled 231.07 GWh and dispatched energy totalled 148.17 GWh.
The curtailed amount was 35.88% of available energy in the source model. That ratio gives the event’s scale, while the interval profile shows where the difference between available and dispatched power was concentrated.
The Intraday Profile Matters
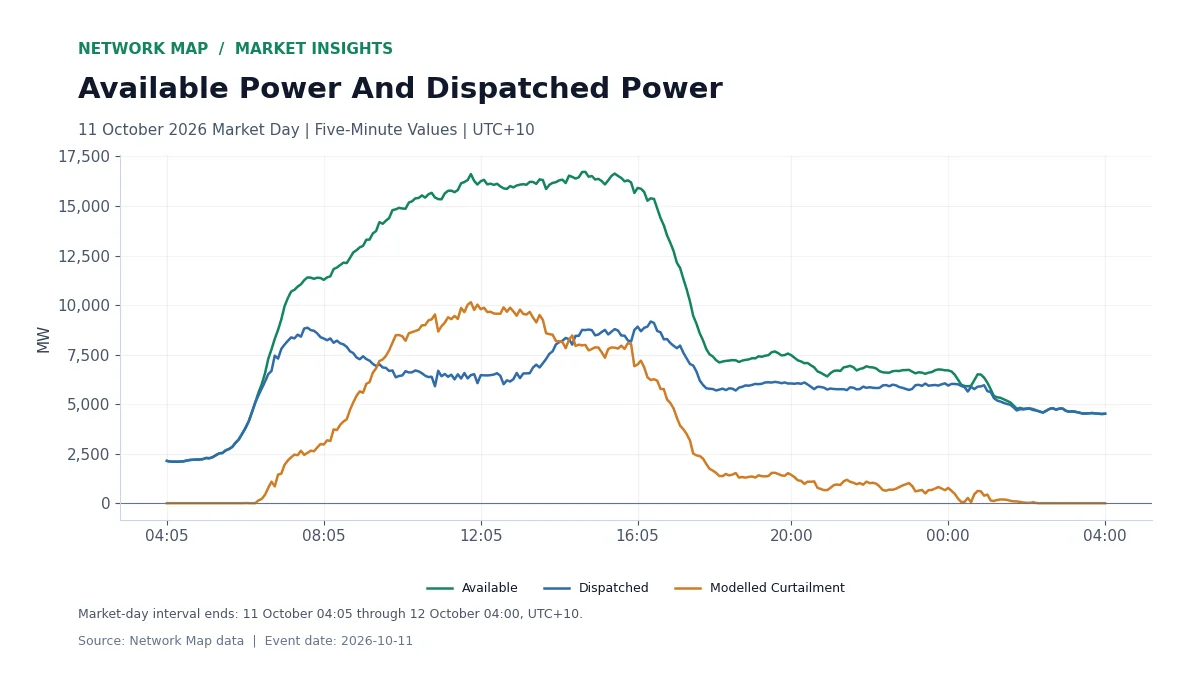
Combined modelled curtailed power peaked at 10,142.25 MW at 11:50 in fixed UTC+10. The first chart aligns available power, dispatched power and the modelled curtailed component through the market day.
The energy totals integrate those five-minute observations. This keeps the daily result tied to the operating profile: a high power value in one interval and a large energy total across the day answer different questions. The chart lets an analyst follow both the size and duration of the event.
Economic Classification Provides The Largest Component
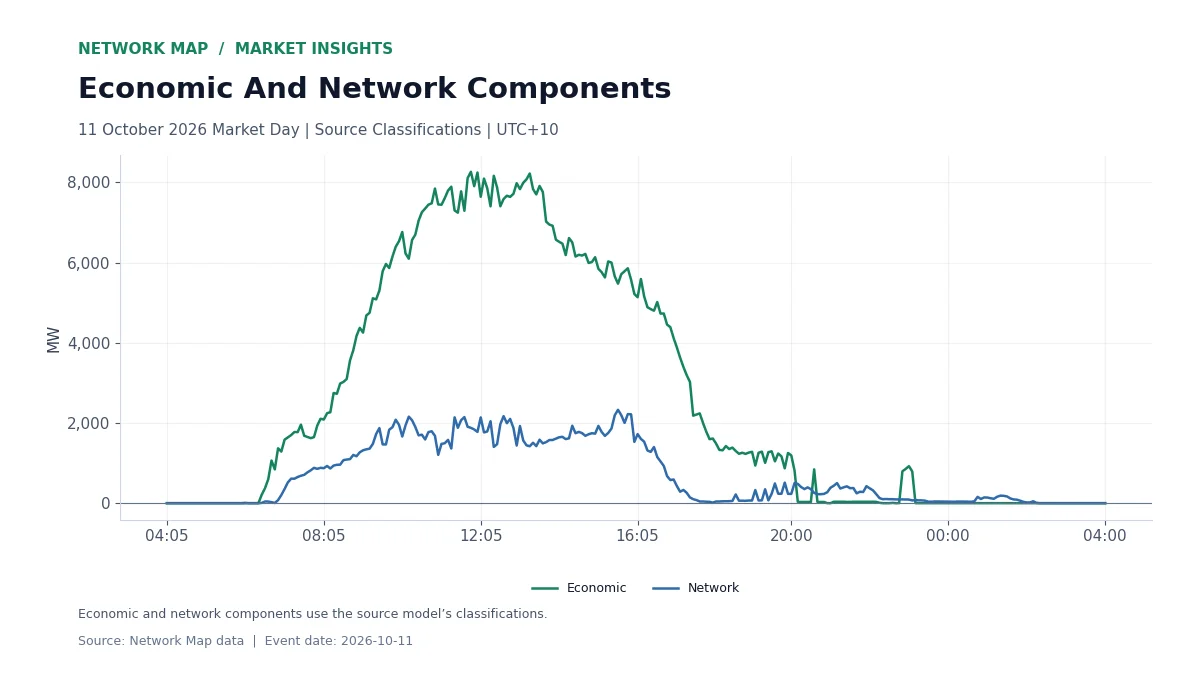
The source model classified 63.20 GWh as economic curtailment and 16.77 GWh as network curtailment. Those components represented 76.23% and 20.23% of total modelled curtailed energy, respectively.
The second chart separates those two classifications over time. For a project review, that distinction directs the next question. Economic intervals lead into prices and dispatch decisions. Network-classified intervals lead into the relevant Grid Constraints and their binding periods.
Connect The Regional Event To A Project
A useful asset-level workflow starts with the date and then follows the unit’s available power, dispatched power and source classification at the same timestamps. Comparing those observations with regional prices and Grid Constraints produces a more specific operating review than a daily curtailment total alone.
The source model aggregates the renewable-generation units it covers across the five regions. Energy is calculated from five-minute power observations, with each MW observation divided by twelve to obtain its MWh contribution.
The source market day runs through interval ends from 04:05 on 11 October to 04:00 on 12 October 2026 in fixed UTC+10. All figures and classifications in this article come from Network Map’s data for that window.
Explore The Data
Curtailment By Cause, Grid Constraints, Revenue Reconciliation.