Market analysis of 9 October 2026
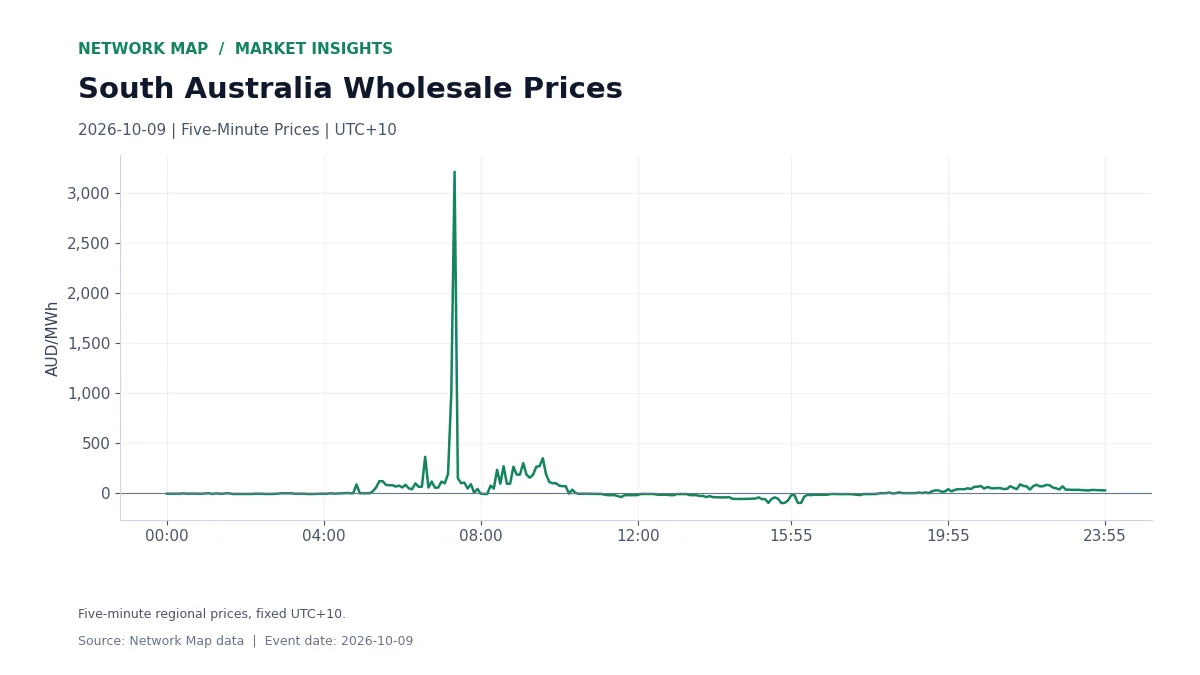
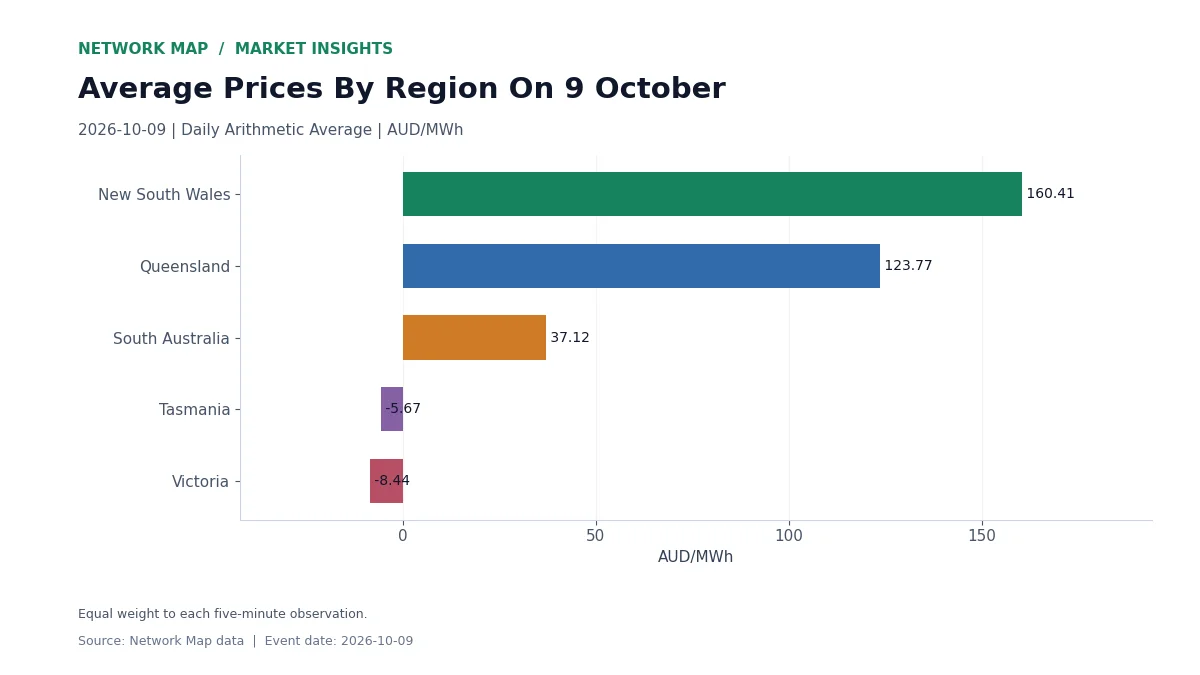
South Australia recorded a wholesale electricity price high of AUD 3,210.98/MWh at 07:20 on 9 October 2026 and a low of −AUD 100.00/MWh at 15:40. The arithmetic average across its 288 five-minute observations was AUD 37.12/MWh.
Across the day, 159 observations were below zero, a total of 13.2 hours and 5 observations were at or above AUD 300/MWh, a total of 0.4 hours. The spread between the highest and lowest prices was AUD 3,310.98/MWh.
The Five-Minute Price Curve
The first chart shows each five-minute price for South Australia through the day, with times in fixed UTC+10. Timing matters for any operator: a battery or flexible load gains from the gap between the cheapest and dearest intervals, while a generator’s result depends on when its energy was delivered.
How The Five Regions Compared
Daily average prices in the other regions were: New South Wales AUD 160.41/MWh, Queensland AUD 123.77/MWh, Tasmania −AUD 5.67/MWh, Victoria −AUD 8.44/MWh. The second chart compares the five regional averages for 9 October 2026.
What The Day Means For Operations
For a battery operator, the question is where charging and discharging belonged within this curve. For a generator or retailer, the same timestamps show which intervals carried the most value or cost. Reviewing the day interval by interval keeps these signals visible where a daily average would hide them.
This analysis uses Network Map’s regional observations dated 9 October 2026. Prices are in Australian dollars per megawatt-hour, times use fixed UTC+10, and daily averages give equal weight to each five-minute observation.
Explore The Data
Markets, Revenue Reconciliation, Battery Revenue Benchmarks.