Market analysis of 9 October 2026
Modelled renewable curtailment reached 53.94 GWh across the five regional series for the market day dated 9 October 2026. That was the 4th-highest daily total of the 31 market days in October 2026. Available energy totalled 241.86 GWh and dispatched energy totalled 187.92 GWh, so 22.30% of available energy was curtailed.
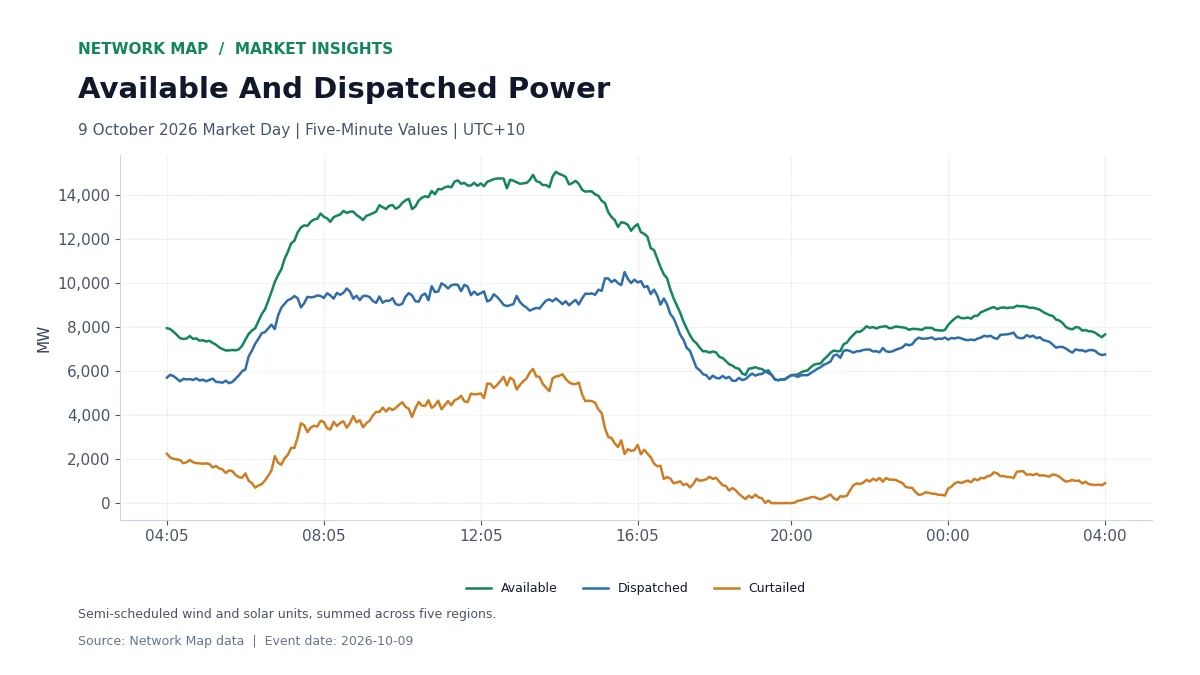
Combined modelled curtailed power peaked at 6,106.61 MW at 13:25 in fixed UTC+10. At that interval, available power was 14,935.68 MW and dispatched power was 8,829.07 MW.
The Intraday Profile
The first chart aligns available power, dispatched power and the modelled curtailed component through the market day. The gap between the first two lines is the energy that semi-scheduled wind and solar units could have produced but did not dispatch.
Where And Why Output Was Curtailed
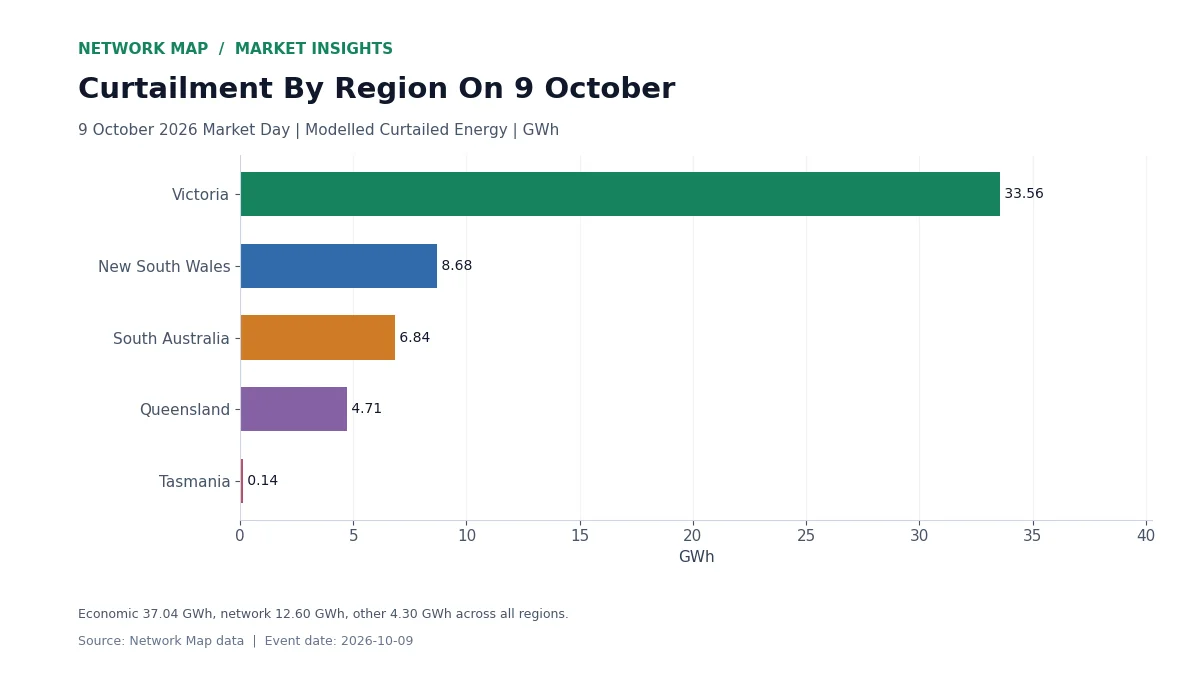
Victoria carried the largest share, 33.56 GWh or 62.2% of the day’s total. New South Wales recorded 8.68 GWh; South Australia recorded 6.84 GWh; Queensland recorded 4.71 GWh; Tasmania recorded 0.14 GWh.
By modelled cause, economic curtailment accounted for 37.04 GWh (68.7%), network curtailment for 12.60 GWh (23.4%) and other classifications for 4.30 GWh (8.0%). The second chart shows each region’s total split by cause.
Using The Day In Asset Reviews
Economic curtailment points to price and bidding: units chose not to run at the prices on offer. Network curtailment points to grid limits that held output back. Separating the two shows an owner whether lost output is a commercial decision or a connection question.
Figures are Network Map’s modelled curtailment for semi-scheduled units on the market day dated 9 October 2026, intervals ending 04:05 that day to 04:00 the next day in fixed UTC+10. Energy is the sum of five-minute power divided by 12.
Explore The Data
Curtailment By Cause, Constraint Headroom, Revenue Reconciliation.