Market analysis of 16 October 2026
64 Grid Constraints recorded at least one binding five-minute interval during the market day dated 16 October 2026. Together they produced 2,886 binding constraint-intervals, the highest daily total of the 31 market days in October 2026.
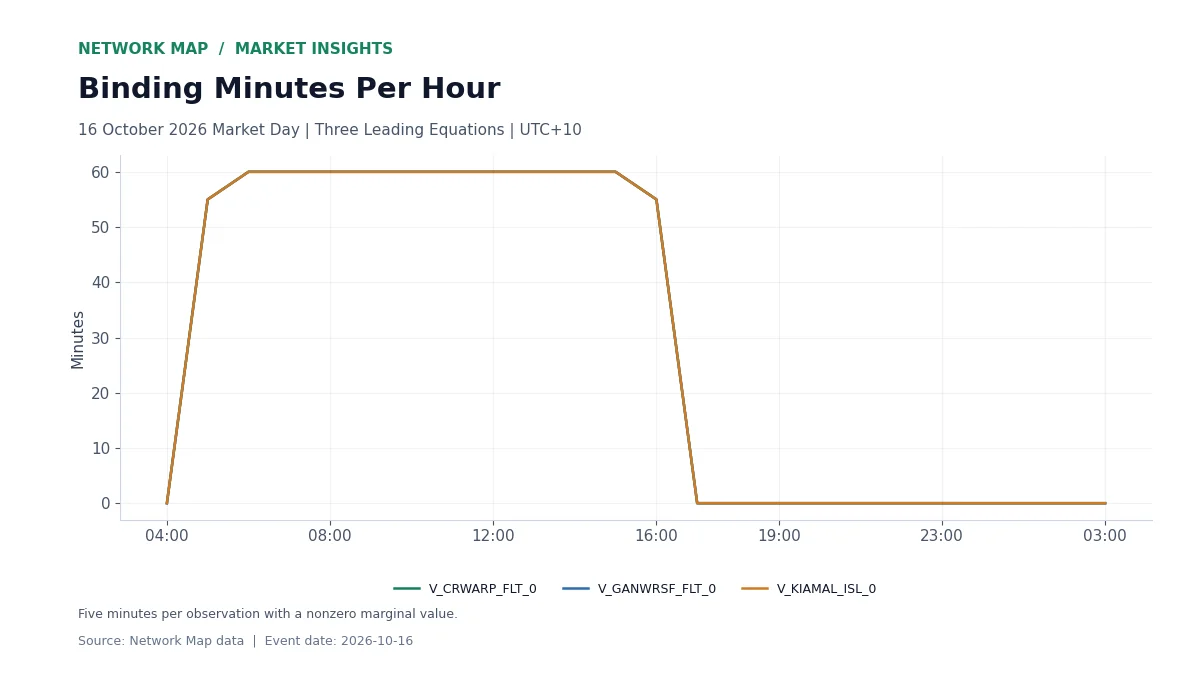
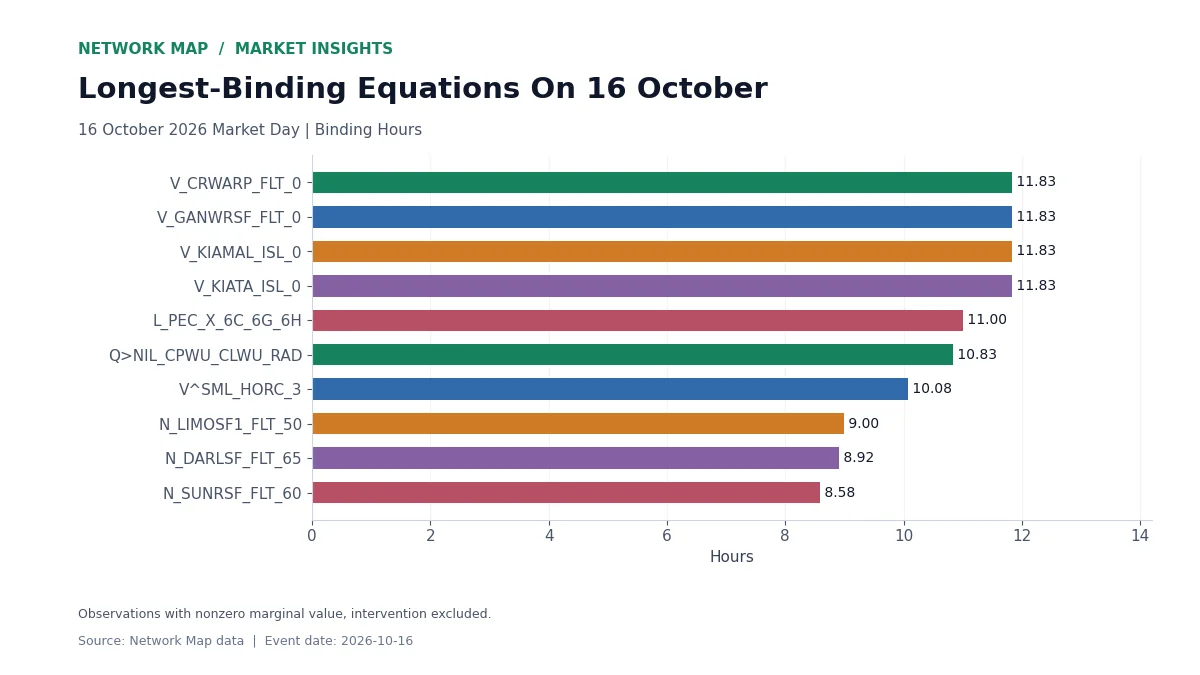
The longest-binding equation was V_CRWARP_FLT_0, with 142 binding observations, equivalent to 11 hours 50 minutes. V_GANWRSF_FLT_0 followed with 142 observations (11 hours 50 minutes). V_KIAMAL_ISL_0 followed with 142 observations (11 hours 50 minutes).
When The Leading Equations Bound
The first chart groups binding observations for the three leading equations into hourly totals through the market day, in fixed UTC+10. Each observation with a nonzero marginal value adds five minutes. The profile shows whether binding was concentrated in the solar hours, the evening peak or overnight.
The Ten Longest-Binding Equations
The second chart ranks the ten equations with the most binding observations on the day. The highest absolute marginal value among them was 812,000.00, on V_CRWARP_FLT_0, in the dispatch model’s units.
Why Binding Duration Matters
A binding constraint limits how much a group of units or a transfer path can be dispatched. Long binding periods point to the parts of the grid that shaped dispatch on the day, which is the starting point for matching constraints to a unit’s curtailment, its loss of revenue or a shift in interregional flows.
Figures use Network Map’s binding-constraint records for the market day dated 16 October 2026 (intervals ending 04:05 that day to 04:00 the next day, fixed UTC+10), counting observations with nonzero marginal values and no intervention.
Explore The Data
Constraint Headroom, Curtailment By Cause, Network Outages Risk, Markets.