Market analysis of 5 October 2026
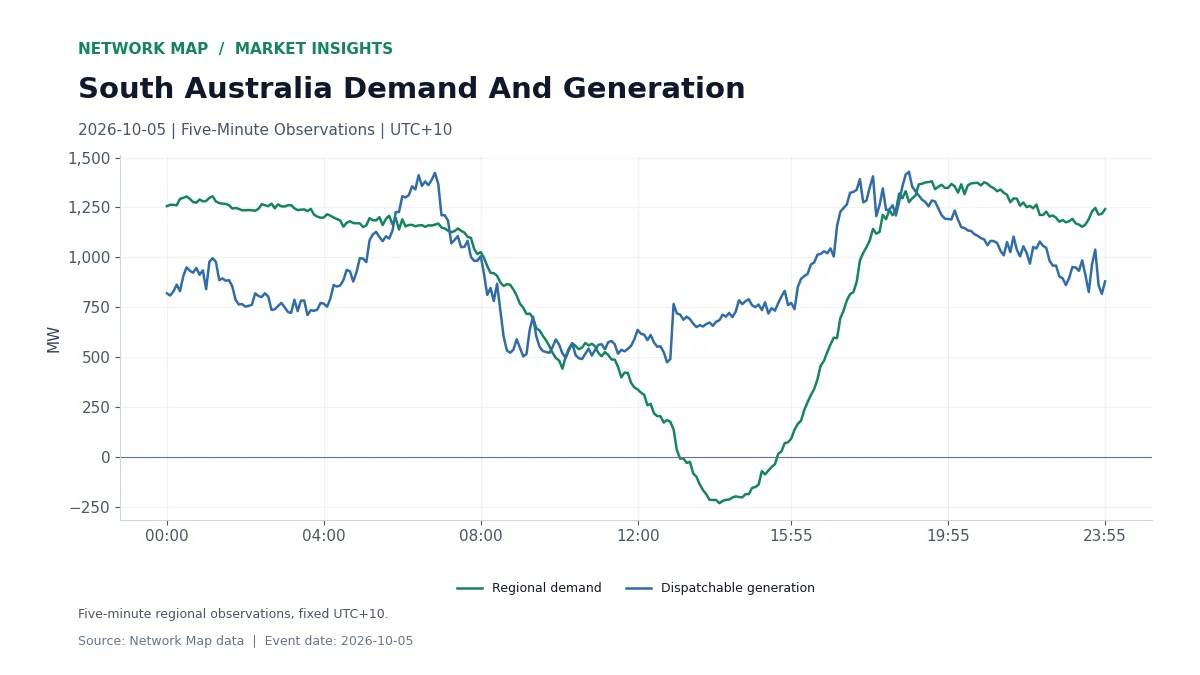
Regional demand in South Australia fell to −230.74 MW at 14:05 on 5 October 2026. Demand was below zero in 30 of the day’s 288 five-minute observations, a total of 2.5 hours.
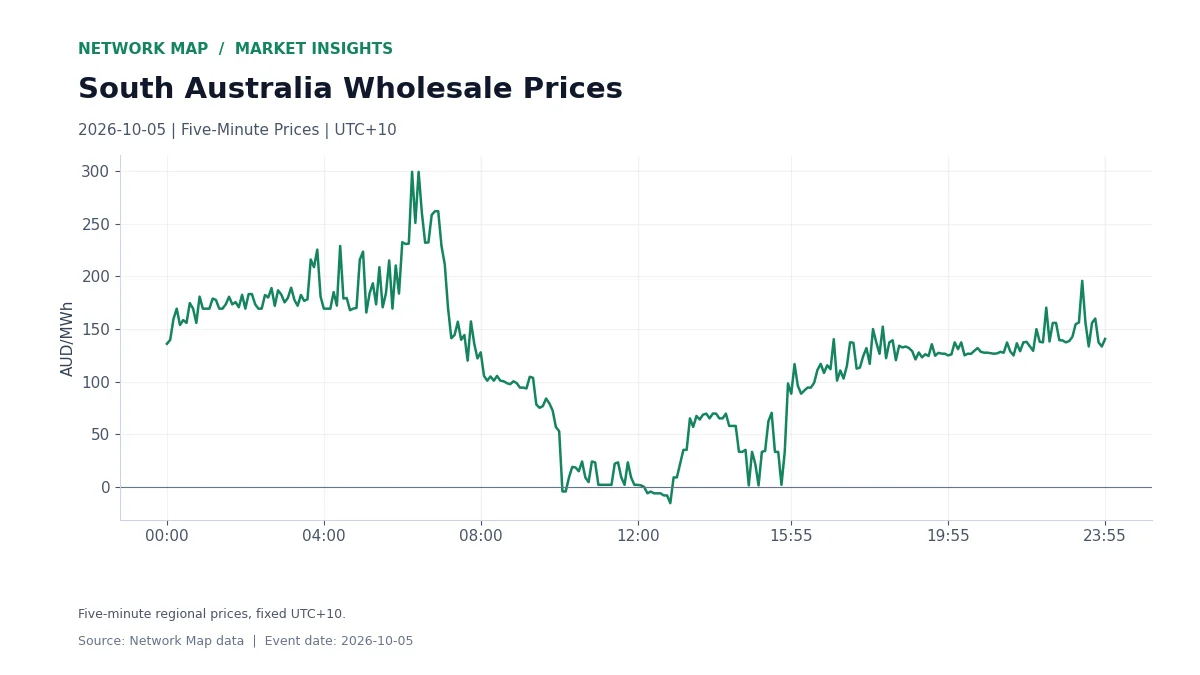
At the demand low the wholesale price was AUD 65.20/MWh. Across the day, 10 prices were negative and the daily average was AUD 119.84/MWh. Demand later peaked at 1,381.08 MW at 19:30.
The Demand Profile Through The Day
The first chart traces five-minute regional demand and dispatchable generation in South Australia, in fixed UTC+10. Demand below zero means small-scale generation inside the region exceeded local consumption served from the grid.
Prices Through The Low-Demand Hours
The second chart shows the five-minute price curve. The lowest price of the day was −AUD 15.36/MWh at 12:50, and the highest was AUD 299.44/MWh at 06:15.
What A Negative-Demand Day Means
For storage, a long run of negative prices is a charging window. For utility-scale wind and solar, it is a day where bidding and output timing decide whether energy earns or costs money. The interval detail shows exactly when those conditions applied.
This analysis uses Network Map’s five-minute regional observations dated 5 October 2026, fixed UTC+10. Daily averages give equal weight to each observation.
Explore The Data
Markets, Battery Revenue Benchmarks, Revenue Reconciliation.