Market analysis of 2 July 2026
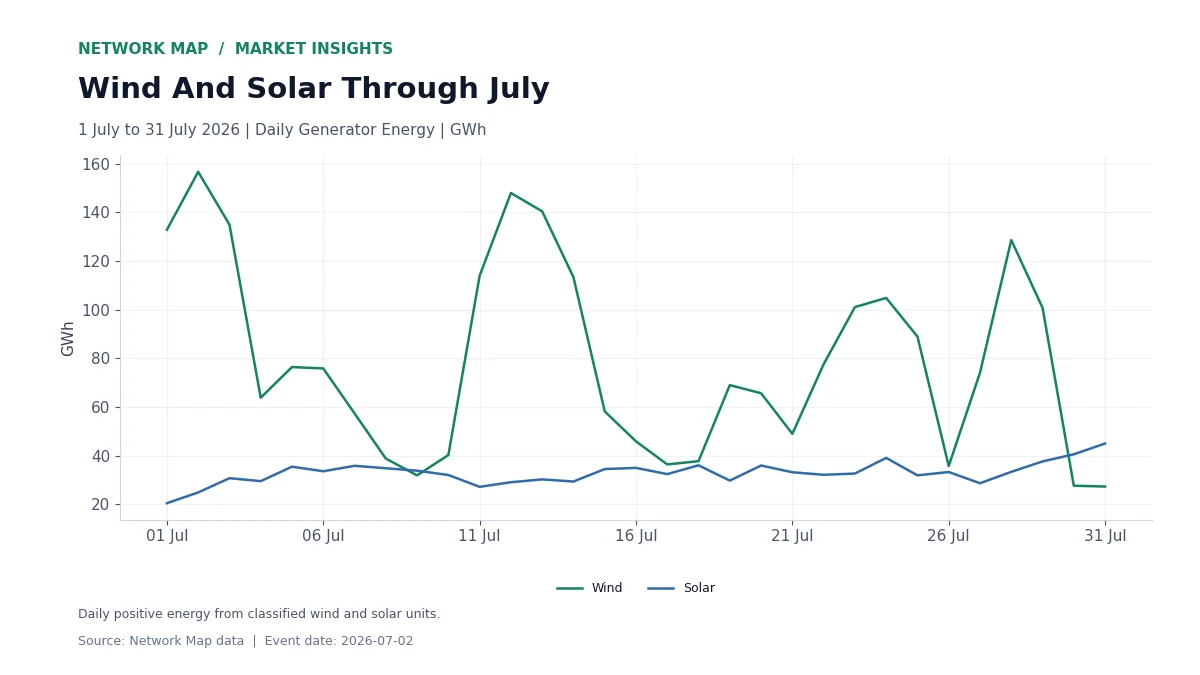
Wind generators delivered 156.72 GWh on 2 July 2026 and solar generators delivered 24.81 GWh, a combined 181.53 GWh across Australia’s five eastern and southern market regions. In Network Map’s daily unit records for 1 July to 31 July 2026, that was the highest daily wind total of 31 dates and the highest combined wind and solar day.
Wind output averaged 79.11 GWh a day over the same dates, so 2 July ran 98.1% above the period mean. Hydro added 29.83 GWh, while black and brown coal units supplied 114.02 GWh.
The Daily Pattern Through The Month
The first chart places the event day in its monthly context. It shows daily wind and solar energy for each date from 1 July to 31 July. Wind was the larger of the two on 2 July, at 6.32 times the solar total.
Where The Energy Came From
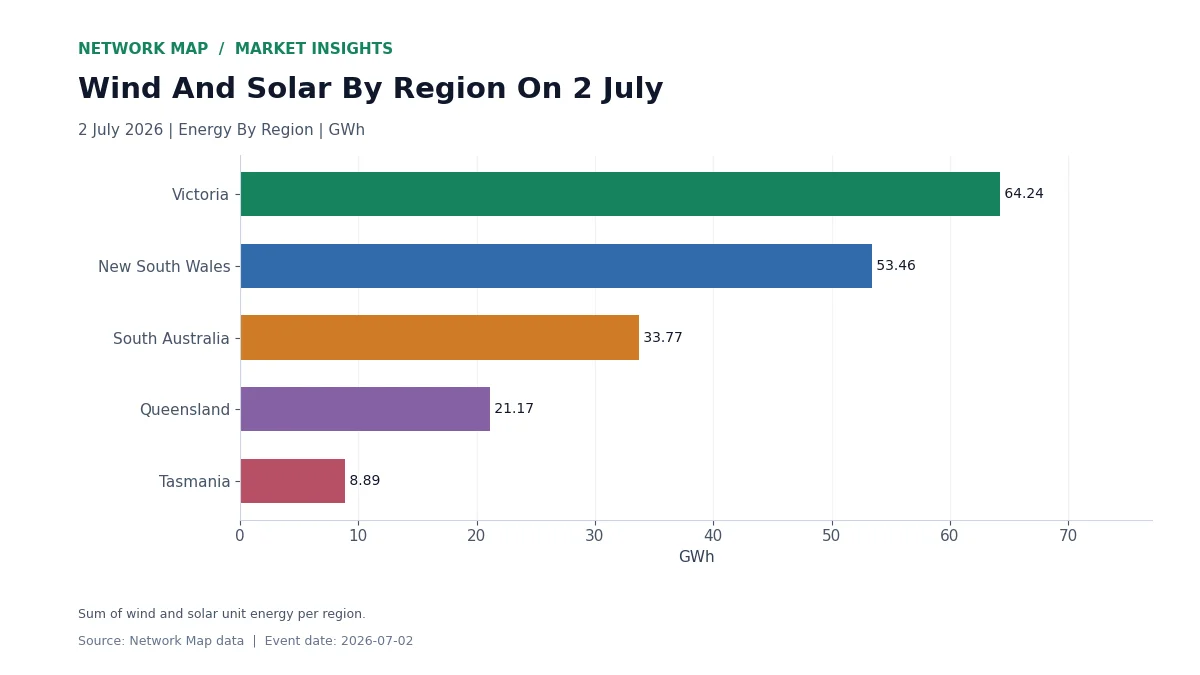
Victoria supplied the largest regional share of wind and solar energy, 64.24 GWh or 35.4% of the day’s total. New South Wales followed with 53.46 GWh, and South Australia contributed 33.77 GWh.
Reading The Day For Asset Performance
A high-output day is a useful benchmark for comparing a single wind or solar unit with its fuel group and its region. The next step is to match each unit’s interval output with the prices that applied when the energy was delivered, which turns the volume result into a revenue view.
Figures use positive energy from Network Map’s daily unit records for 2 July 2026, grouped by source fuel classification and region. Daily totals are summed across all classified units.