Market analysis of 14 May 2026
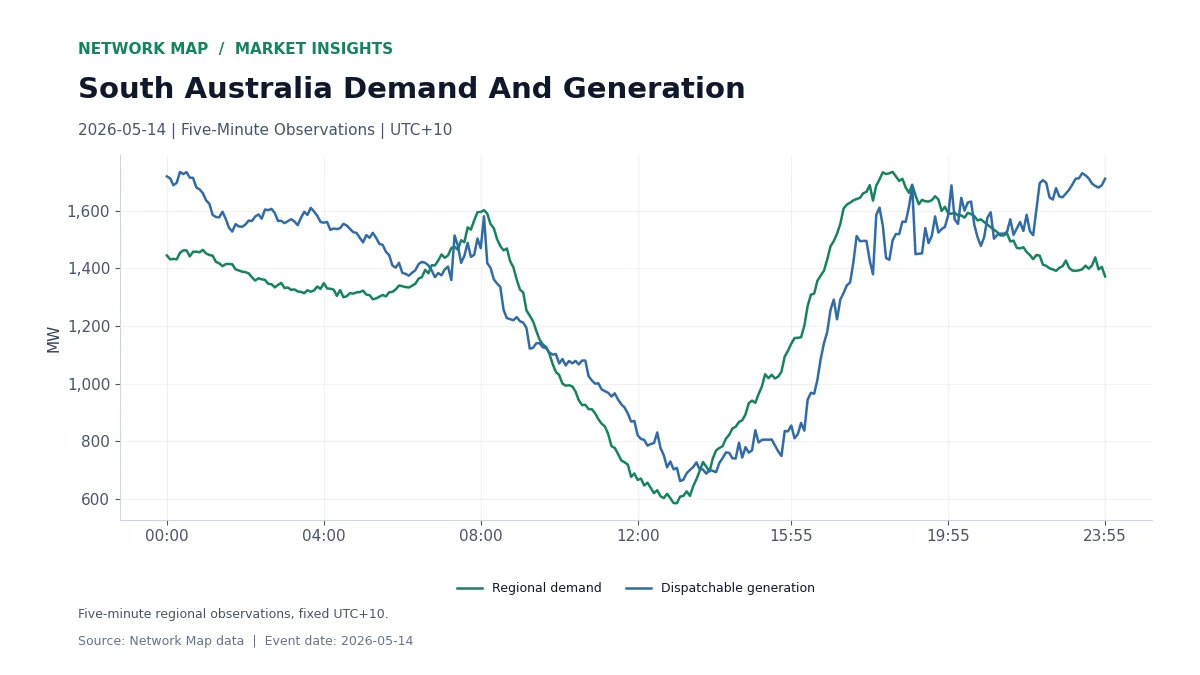
Regional demand in South Australia peaked at 1,734.25 MW at 18:30 on 14 May 2026. The day’s lowest observation was 586.28 MW at 13:00, so demand moved by 1,147.97 MW from trough to peak.
At the demand peak the wholesale price was AUD 130.00/MWh. The day’s highest price, AUD 272.81/MWh, came at 07:30, and the daily price average was AUD 75.37/MWh.
The Demand Profile Through The Day
The first chart traces five-minute demand and dispatchable generation in South Australia, in fixed UTC+10. The gap between the two lines reflects the region’s net interchange with its neighbours across the day.
How The Five Regions Compared
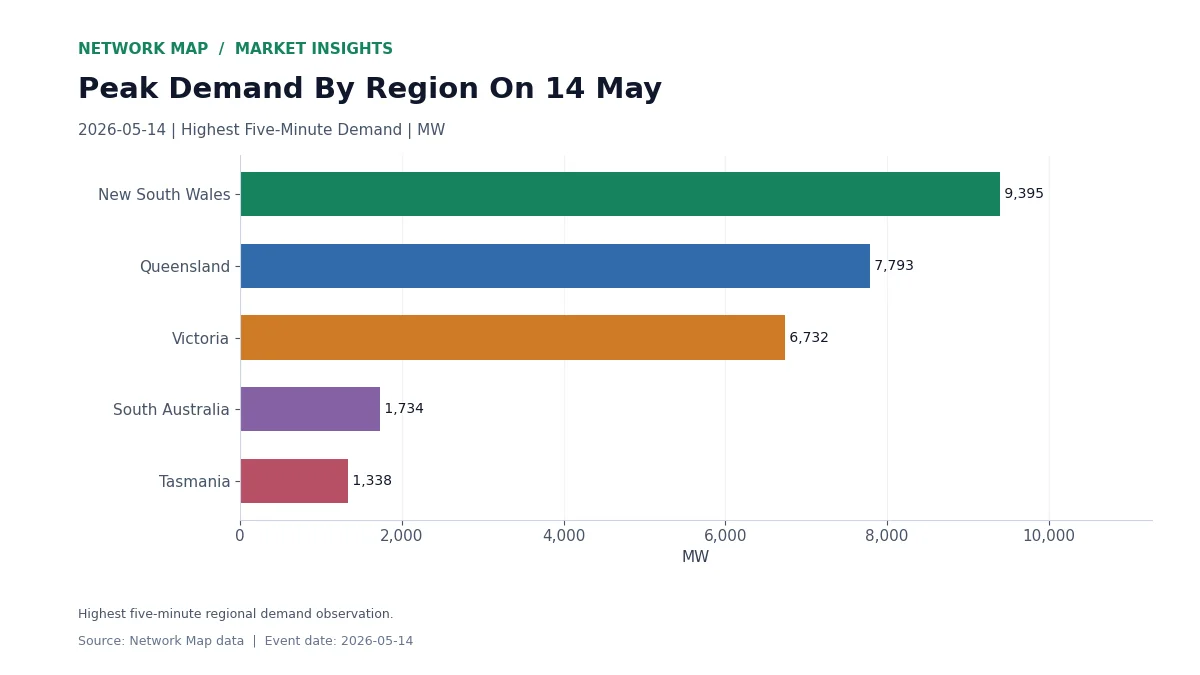
The second chart compares each region’s peak demand for 14 May 2026. South Australia’s peak of 1,734 MW compares with New South Wales 9,395 MW, Queensland 7,793 MW, Victoria 6,732 MW, Tasmania 1,338 MW.
What The Day Means For Operations
For a battery operator, the question is where charging and discharging belonged within this curve. For a generator or retailer, the same timestamps show which intervals carried the most value or cost. Reviewing the day interval by interval keeps these signals visible where a daily average would hide them.
This analysis uses Network Map’s regional observations dated 14 May 2026. Prices are in Australian dollars per megawatt-hour, times use fixed UTC+10, and daily averages give equal weight to each five-minute observation.
Explore The Data
Markets, Revenue Reconciliation, Battery Revenue Benchmarks.