Market analysis of 22 January 2025
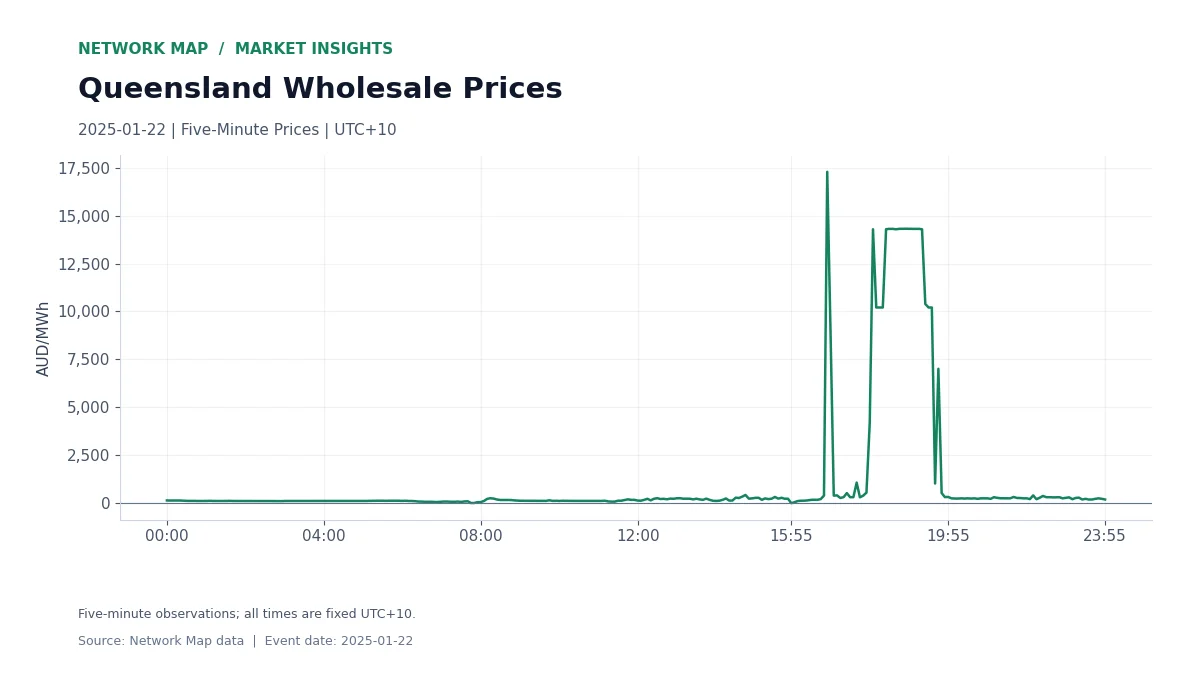
Queensland’s wholesale electricity price was −AUD 27.68/MWh at 15:55 on 22 January 2025. At 16:50 it reached AUD 17,304.00/MWh. The move from the day’s minimum to its maximum took 55 minutes and spanned AUD 17,331.68/MWh.
That rapid change is the defining feature of the date. A charging or consumption decision made in the negative-price period faced a very different regional price less than an hour later.
A Short Transition With A Large Price Range
The full day contained three negative-price observations among 288 five-minute prices. Its arithmetic average was AUD 1,133.30/MWh. The highest recorded price appeared once, at 16:50.
The first chart shows how that maximum sits within the wider sequence. The daily average describes the date as a whole, while the interval curve identifies when the commercial conditions changed. For a battery or flexible load, those are different views of the same operating day.
Demand Peaks After The Price Maximum
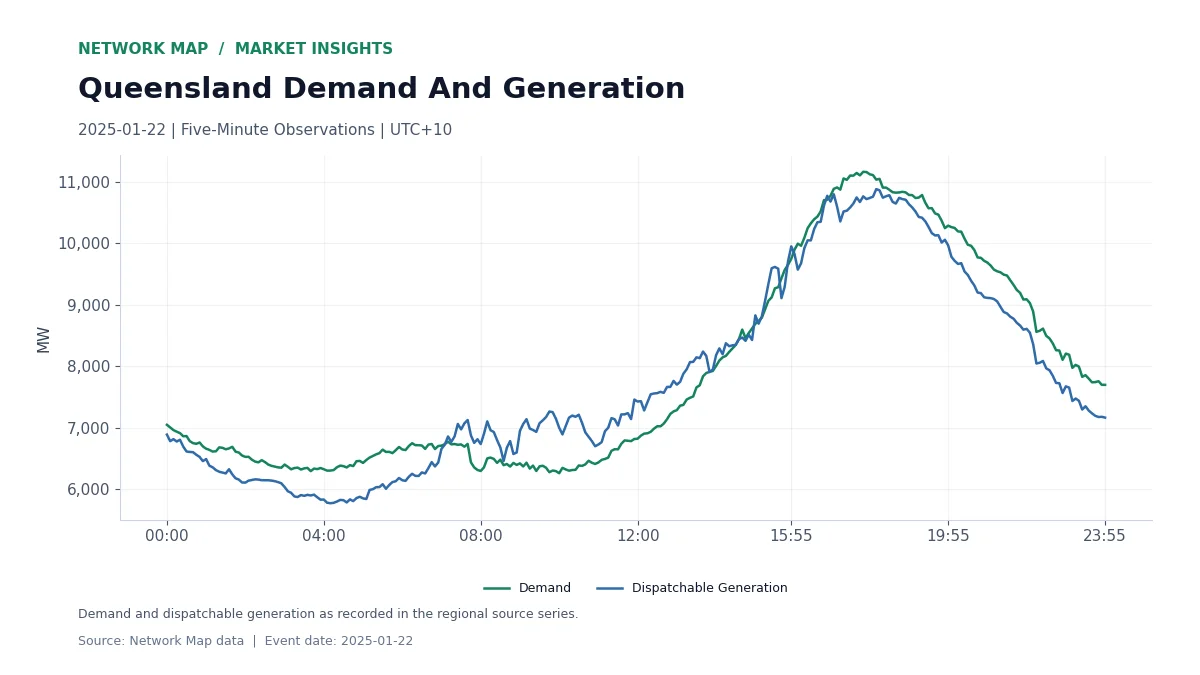
Regional demand reached 11,159.32 MW at 17:45, which was 55 minutes after the price maximum. The price at the demand peak was AUD 365.95/MWh. Dispatchable generation reached its daily maximum of 10,877.92 MW at 18:05.
Demand’s daily minimum was 6,257.16 MW at 10:00. Its range across the date was therefore 4,902.16 MW. The second chart places that rise alongside dispatchable generation and shows why a demand-only view would select a different timestamp from a price-only view.
Focus On The Transition Window
An event-level review should give particular attention to the transition from 15:55 to 16:50. Match the regional price curve to the asset’s recorded operating mode, energy and availability during those timestamps. Then carry that comparison forward to the later demand peak.
For storage, this provides a way to review how charging and discharging lined up with the price reversal. For generation, it connects output timing to the highest-value intervals. For consumers, it highlights the importance of tracking a changing price signal through the afternoon.
Network Map’s regional data supplies all figures for 22 January 2025. Prices are in Australian dollars per megawatt-hour. All times use fixed UTC+10, and the daily average gives equal weight to each five-minute observation.
Explore The Data
Markets, Revenue Reconciliation, Battery Revenue Benchmarks.