Market analysis of 12 October 2026
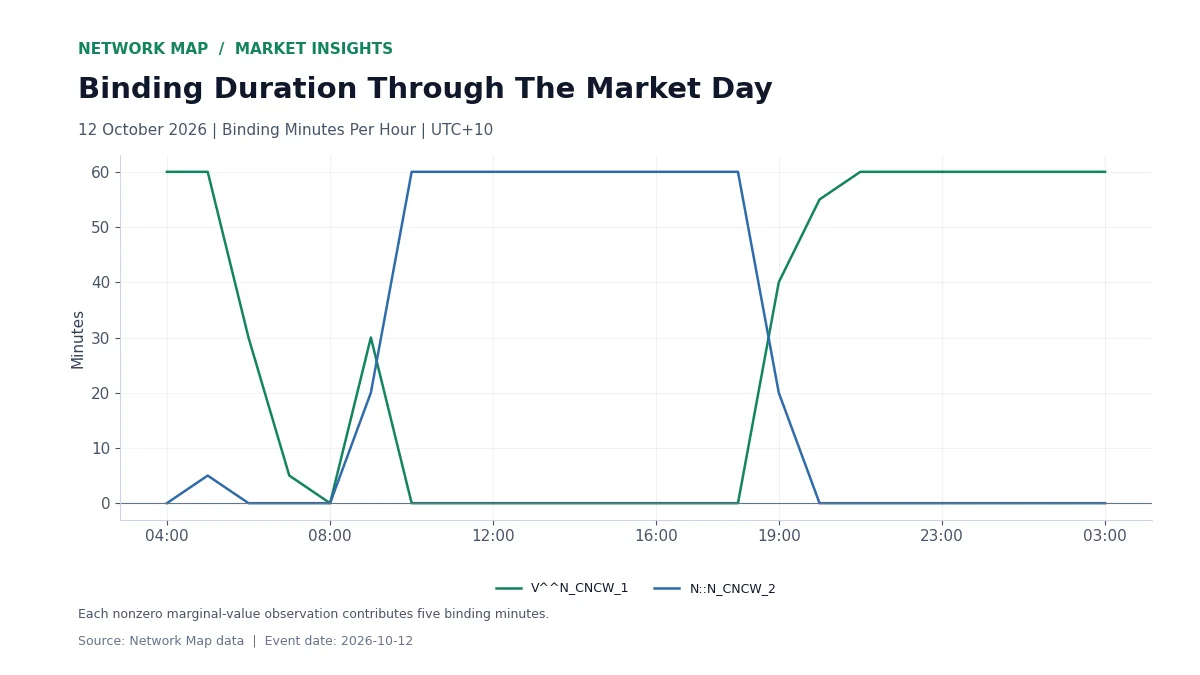
Two selected Grid Constraints spent more than nine hours binding during the market day dated 12 October 2026. Equation V^^N_CNCW_1 had 140 five-minute binding observations, equivalent to 11 hours 40 minutes. Equation N::N_CNCW_2 had 117, equivalent to 9 hours 45 minutes.
The pair offers two views of the same day: how long an equation bound, and how its marginal value changed during those periods. Both are useful when deciding which intervals deserve a closer operating review.
Start With Binding Duration
The first chart groups binding observations into hourly totals. Each qualifying observation has a nonzero marginal value and contributes five minutes. The hourly profile shows when the two equations were active across the source market day.
A daily duration helps rank the amount of time involved. The hourly series adds the operating sequence. That distinction matters when matching Grid Constraints to a unit’s dispatch, a renewable project’s curtailment profile or an interregional transfer window.
Then Inspect The Marginal Values
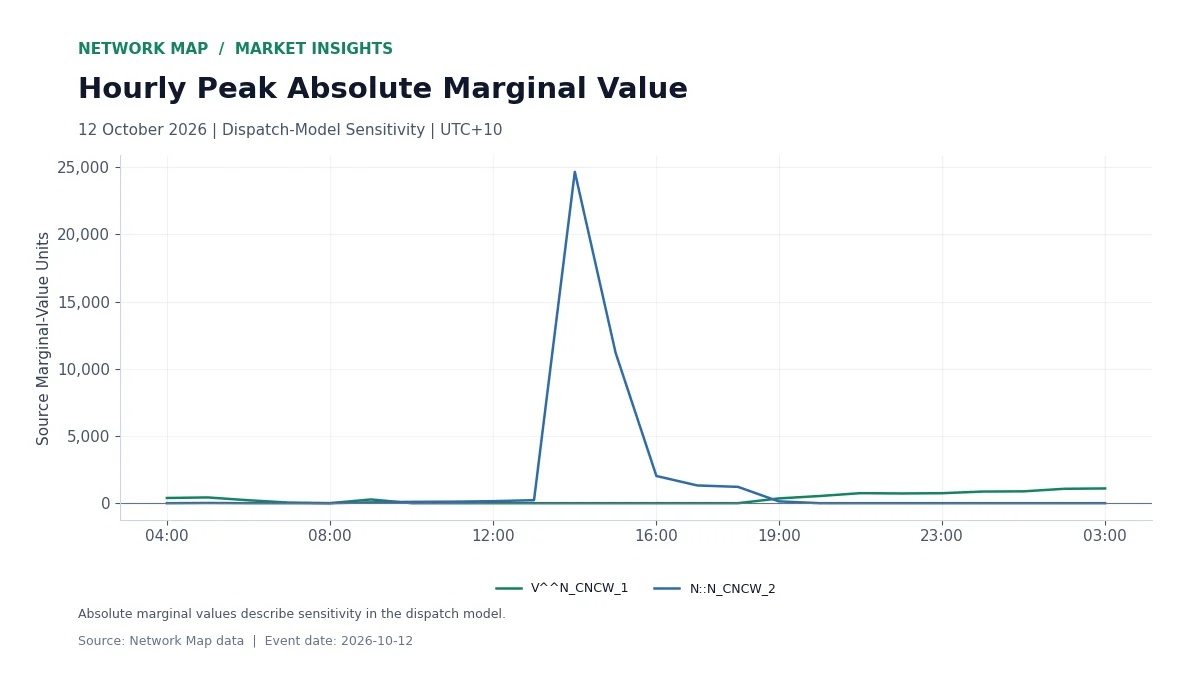
V^^N_CNCW_1 reached a maximum absolute marginal value of 1,095.97 in the source model’s units. N::N_CNCW_2 reached 24,649.29. The second chart shows the hourly peak for each equation and highlights where sensitivity was concentrated.
Marginal value is a sensitivity measure within the dispatch model. It describes the value associated with relaxing the equation’s limit in that model. Binding duration and marginal value therefore answer different questions: one measures time, while the other describes the model’s response to a constraint limit.
Build An Interval-Level Operating Review
A practical review starts with the binding timeline, then examines the equation and the relevant operating quantities during those same intervals. For a renewable project, compare the unit’s available and dispatched power. For a network review, add the relevant outage schedule and transfer data.
The event’s value as a case study lies in the contrast between duration and sensitivity. A long binding window identifies sustained involvement. A concentrated marginal-value peak identifies a more specific interval for investigation.
All figures come from Network Map’s non-intervention source observations for the 12 October 2026 market day. The interval window runs from 04:05 on 12 October through 04:00 on 13 October in fixed UTC+10. Hours are calculated from the observed five-minute binding intervals.
Explore The Data
Grid Constraints, Curtailment By Cause, Network Outages Risk, Markets.