Market analysis of 12 October 2026
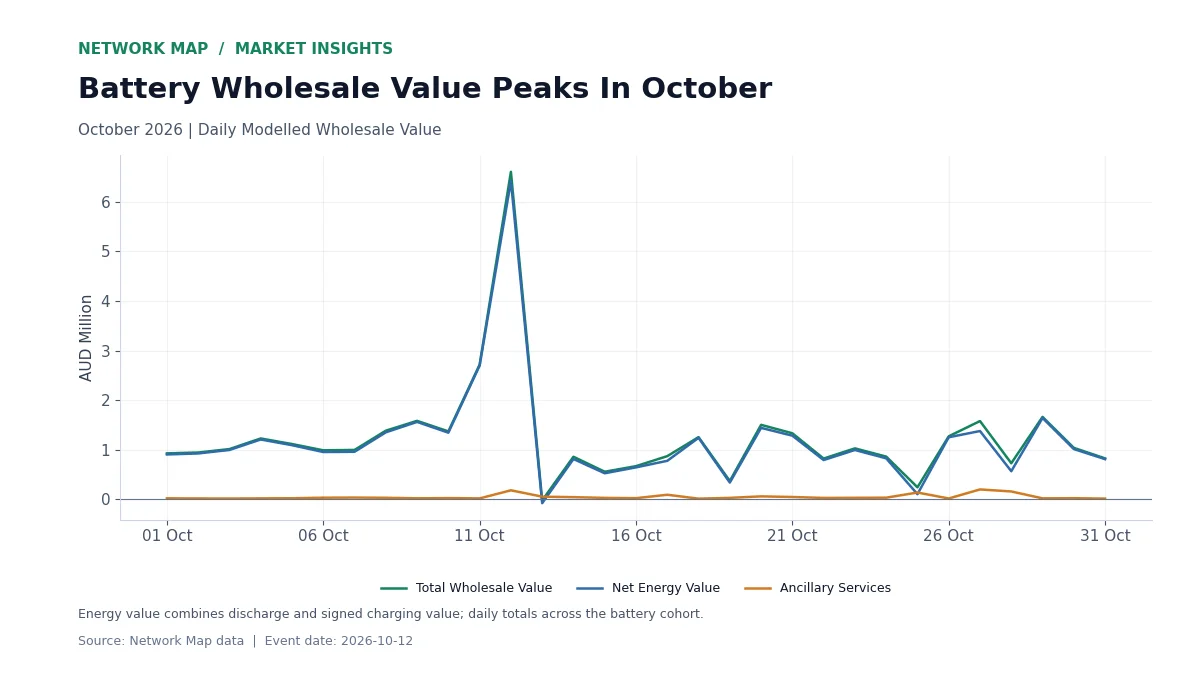
Network Map’s battery cohort recorded modelled wholesale value of AUD 6.61 million on 12 October 2026. It was the highest daily total in the October 2026 series. The calculation covers 68 units and combines discharge energy, signed charging value and ancillary-service value.
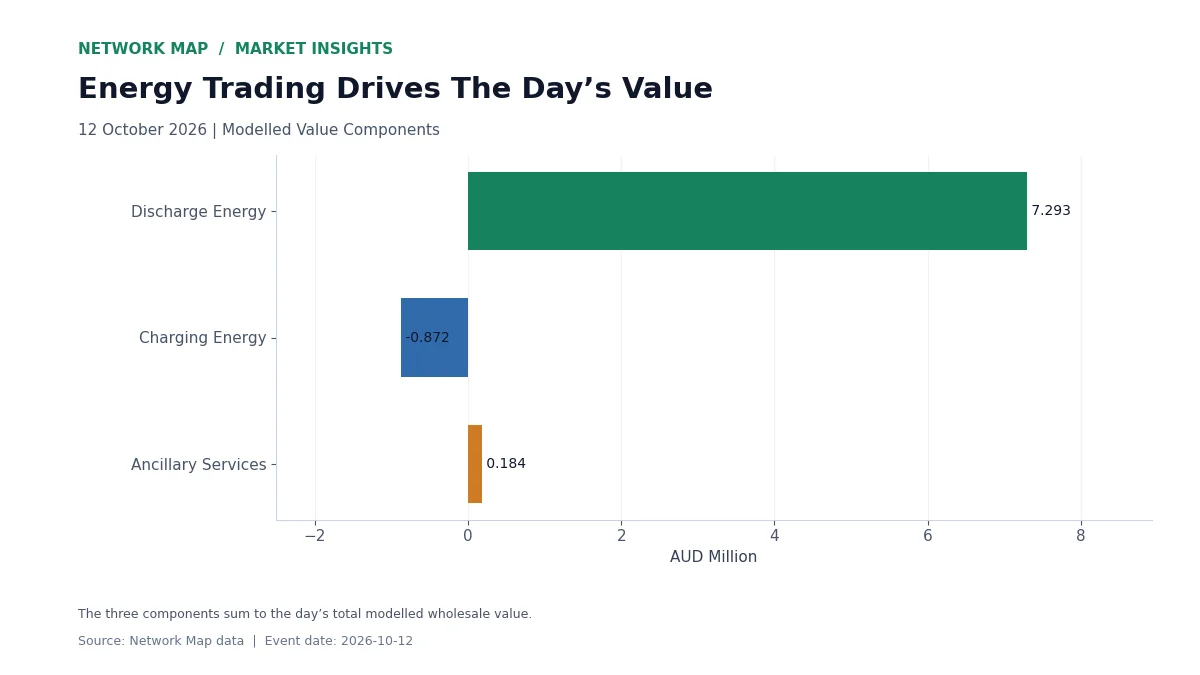
The composition is as important as the headline. Net energy value supplied AUD 6.42 million, while ancillary services contributed AUD 183,622.87. Ancillary services represented 2.78% of the combined total.
The Daily Peak In Its Monthly Context
The monthly chart places 12 October alongside the other October dates. Its total modelled wholesale value was AUD 6,605,183.08. Net energy value was AUD 6,421,560.20, so the total and energy traces track closely at the peak.
This is a useful starting point for battery benchmarking: first identify the high-value day, then separate the products contributing to it. A daily total answers when value was concentrated. Its components answer which operating activity produced that value in the model.
Discharge And Charging Form The Energy Result
The cohort’s discharge energy value was AUD 7,293,157.68. Its signed charging value was −AUD 871,597.47. Combining the two produces the net energy result, then adding ancillary-service value produces the wholesale total.
On the same date, the cohort recorded 15,854.21 MWh of discharged energy and 18,216.85 MWh of charging energy. These quantities connect the value calculation to the battery fleet’s operation. The component chart keeps the charging contribution visible instead of presenting discharge value alone.
Benchmark The Same Components
For an individual battery review, compare its discharge energy, charging energy and ancillary-service contribution with the same components in the cohort. Follow that comparison into the interval data to see when the unit charged and discharged during the event.
The benchmark is most useful when the definitions stay consistent. Network Map’s modelled wholesale value adds discharge energy value, signed charging value and ancillary-service value. The ancillary-service calculation uses enabled quantities and the source model’s volume-weighted prices.
All event figures relate to 12 October 2026. Daily battery totals use the intervals ending from 00:05 through 24:00 in fixed UTC+10. Monetary values are Australian dollars.
Explore The Data
Battery Revenue Benchmarks, Revenue Reconciliation, Markets.