Market analysis of 13 February 2024
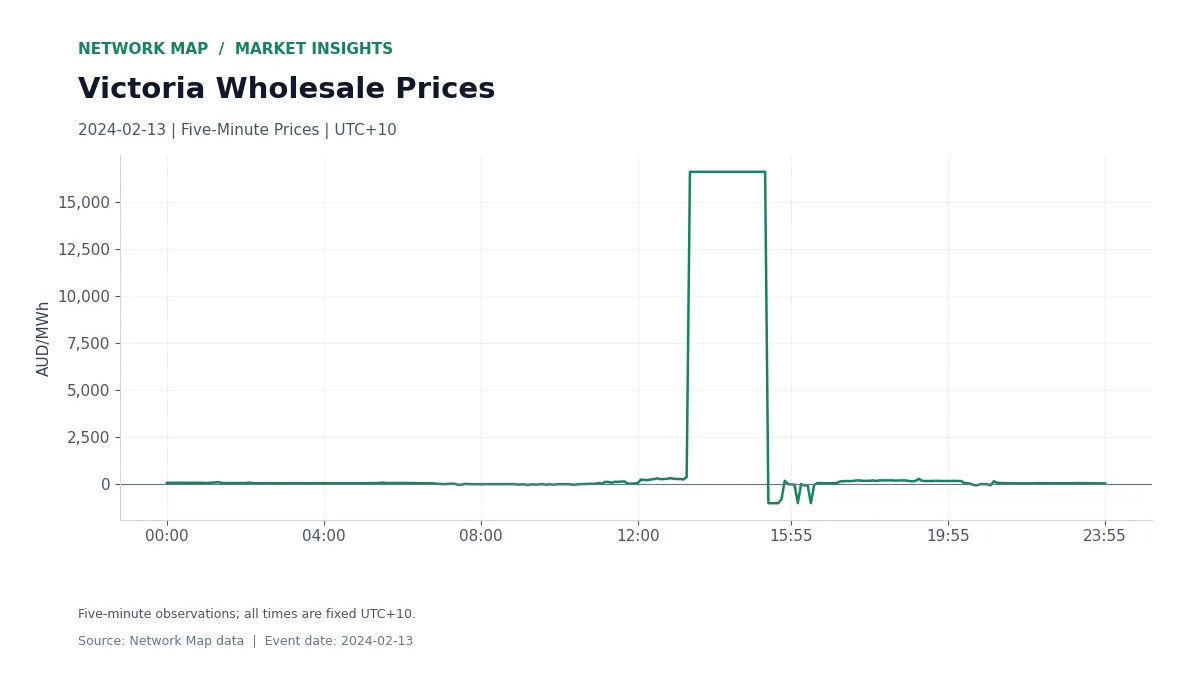
Victoria’s wholesale electricity price reached AUD 16,600/MWh at 13:20 on 13 February 2024. That price persisted across 24 consecutive five-minute observations, through 15:15. By 15:30, the recorded price had fallen to −AUD 999.99/MWh.
The difference between the day’s maximum and minimum was AUD 17,599.99/MWh. That range is the central feature of this event: a sustained high-price block followed by a sharp reversal, rather than one isolated expensive observation.
Two Hours At The Same High Price
The 24 observations at AUD 16,600/MWh represent two hours of five-minute intervals. The full-day arithmetic average was AUD 1,434.11/MWh, while 25 of the day’s 288 recorded prices were negative. A positive daily average therefore coexisted with a substantial negative-price window.
The price chart preserves the sequence. An asset that produced through the high-price block faced a very different revenue pattern from one that produced through the later negative interval. The daily average alone combines those separate operating conditions into a single number.
Demand Peaks Inside The High-Price Block
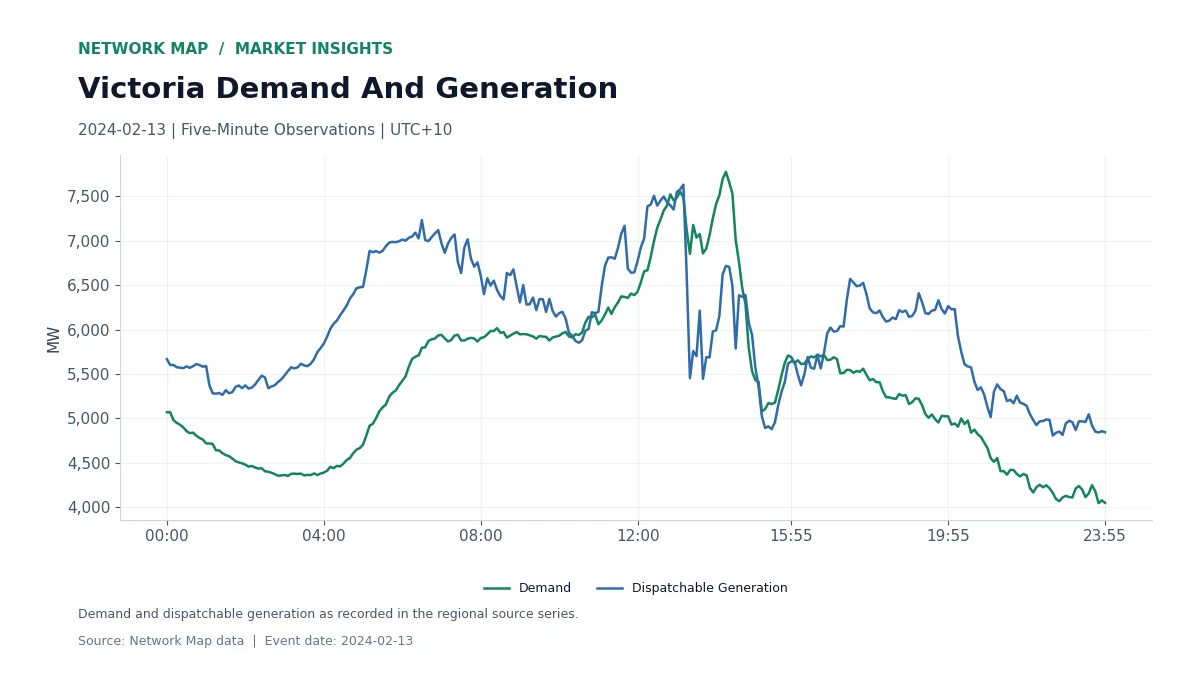
Regional demand peaked at 7,777.57 MW at 14:15, inside the block of AUD 16,600/MWh prices. Dispatchable generation reached its daily maximum earlier, at 13:10, with 7,633.20 MW. Their turning points were separated in time.
The second chart places those quantities on the same timeline. It provides a practical way to align a unit’s own output, a battery schedule or a contracted load position with the regional conditions that accompanied the price event.
Revenue Depends On The Operating Window
For storage, the swing makes the sequence of charging and discharging important. For generation, the revenue calculation should follow metered output through the high-price block and the negative-price reversal. Equal daily energy totals can produce very different spot-price revenues when their delivery times differ.
The working approach is to start with the regional price trace, add the asset’s interval output, and reconcile the result for the same timestamps. Network Map’s Markets and Revenue Reconciliation tools support that event-level comparison.
This analysis uses the 288 regional five-minute observations dated 13 February 2024. Prices are in Australian dollars per megawatt-hour. Times use fixed UTC+10. The daily average is the arithmetic mean of those observations.
Explore The Data
Markets, Revenue Reconciliation, Battery Revenue Benchmarks.