Market analysis of 22 January 2024
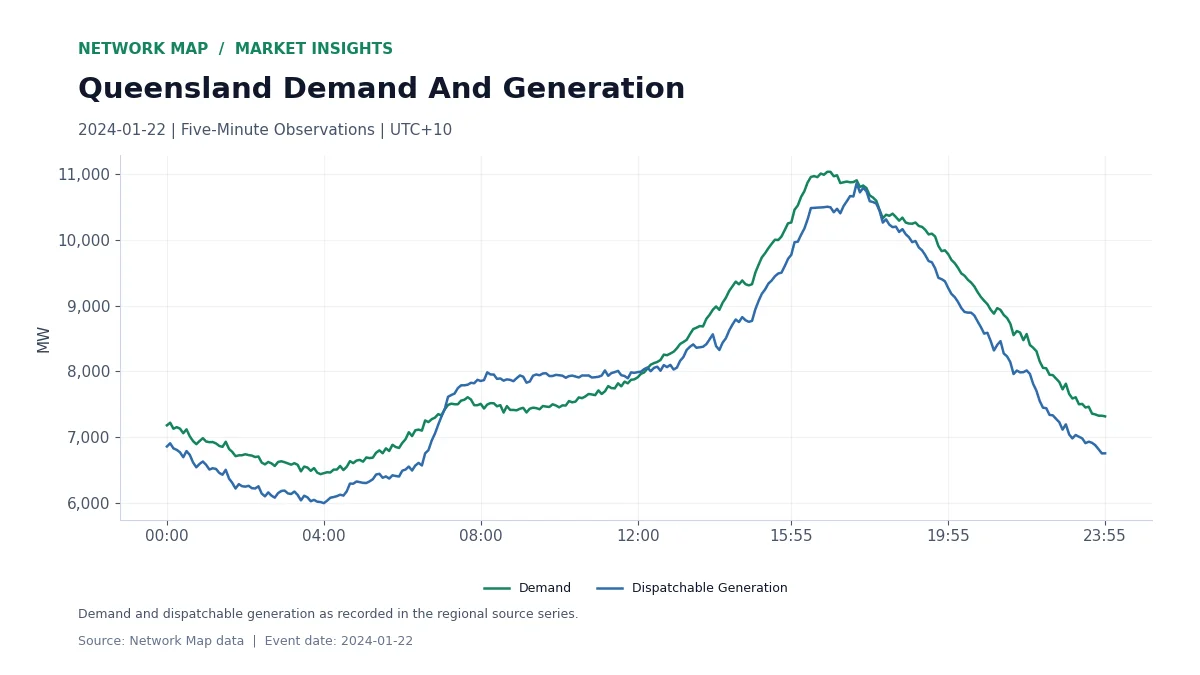
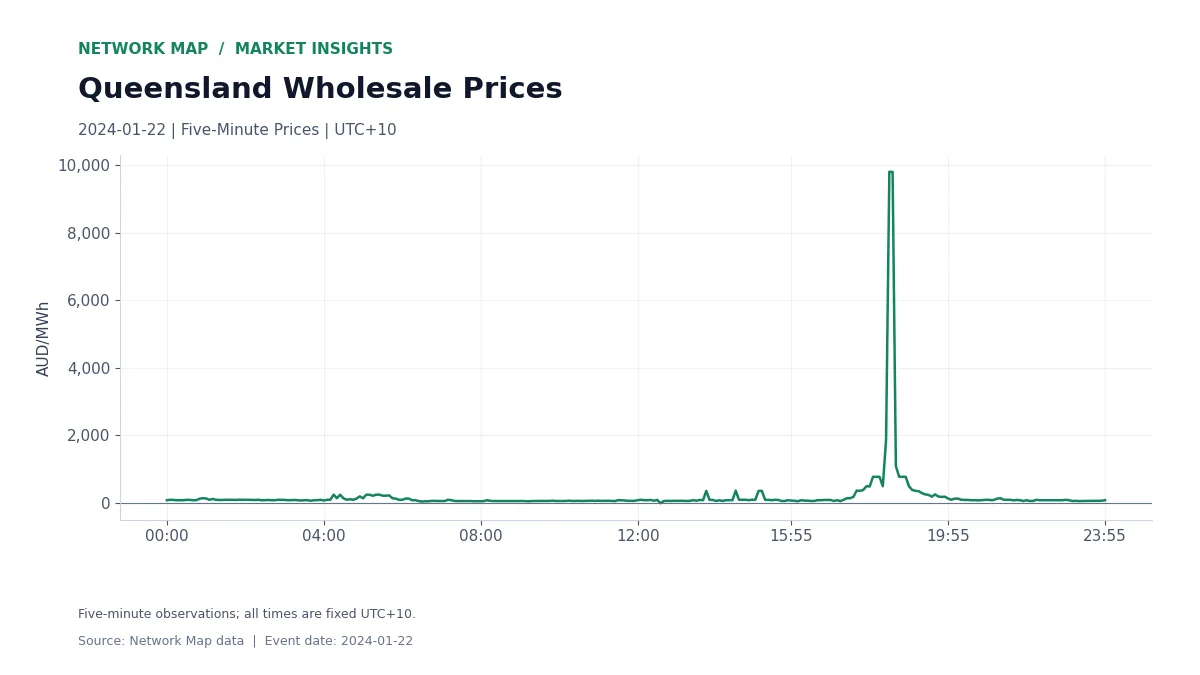
Queensland’s regional demand reached 11,036.20 MW at 16:50 on 22 January 2024. The wholesale electricity price at that observation was AUD 93.50/MWh. The day’s highest price, AUD 9,799.63/MWh, first appeared at 18:25—95 minutes after the demand peak.
The separation between those timestamps is the important feature of this event. The largest demand observation and the most expensive electricity did not arrive together. An operating review needs to track both windows.
A Large Rise In Regional Demand
Demand increased from its daily minimum of 6,438.14 MW at 03:55 to the afternoon maximum of 11,036.20 MW. That is a range of 4,598.06 MW within the recorded date. Dispatchable generation reached its own maximum of 10,865.58 MW at 17:35, between the demand and price peaks.
The demand and generation chart shows the sequence more clearly than a single daily headline. For a flexible load or storage asset, it provides a time-based reference for reviewing operation through the afternoon and evening.
The Price Peak Arrives Later
The maximum price of AUD 9,799.63/MWh occurred in two five-minute observations. Across the full date, the arithmetic price average was AUD 200.67/MWh. There was also one negative observation, at −AUD 2.02/MWh at 12:35.
The price chart therefore contains several different operating conditions: one brief negative observation, an afternoon demand peak at a much lower positive price, and a later high-price episode. Treating the whole afternoon as one price environment would lose those distinctions.
Review The Schedule Against Both Curves
For storage, an event review can compare the planned discharge window with both the demand maximum and the later price maximum. For a generator, the same process compares delivered energy with each price interval. For a consumer, it identifies the loads that were active when prices were highest.
The practical lesson is to align the asset and regional timelines before calculating event revenue. A schedule selected around peak demand and a schedule selected around peak price would target different parts of this day.
This analysis uses Network Map’s 288 five-minute regional observations dated 22 January 2024. Prices are in Australian dollars per megawatt-hour; timestamps use fixed UTC+10. The daily price average is the arithmetic mean.
Explore The Data
Markets, Revenue Reconciliation, Battery Revenue Benchmarks.