Market analysis of 16 October 2023
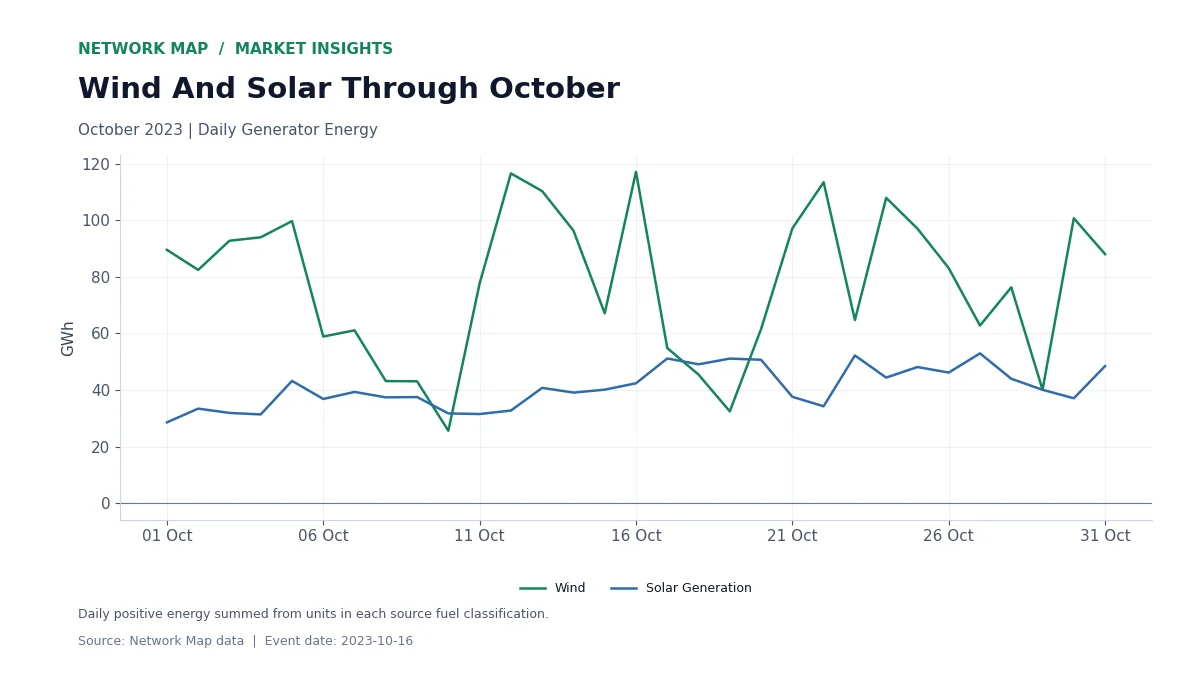
Wind generation reached 117.09 GWh on 16 October 2023 across the units in Network Map’s daily generation series. It was the highest wind-energy total among the 31 dates in October 2023. The event-day total covers 84 wind units.
The month’s average daily wind generation was 77.43 GWh. The 16 October result was 51.23% above that average, making it a useful date for examining how a strong wind-output day differs from the month’s usual daily volume.
The Wind Peak In Monthly Context
The daily wind total was 117,092.06 MWh. Spread across the day, that energy corresponds to an average output of 4,878.84 MW. The first chart compares daily wind energy with solar-generator energy through October.
A monthly view helps separate a single strong day from the broader operating pattern. It shows when wind and solar volumes rose together and when their daily totals moved differently. For an asset owner, the same dates provide a framework for comparing a unit’s own output with its fuel group.
Solar And Hydro Add To The Day’s Generation
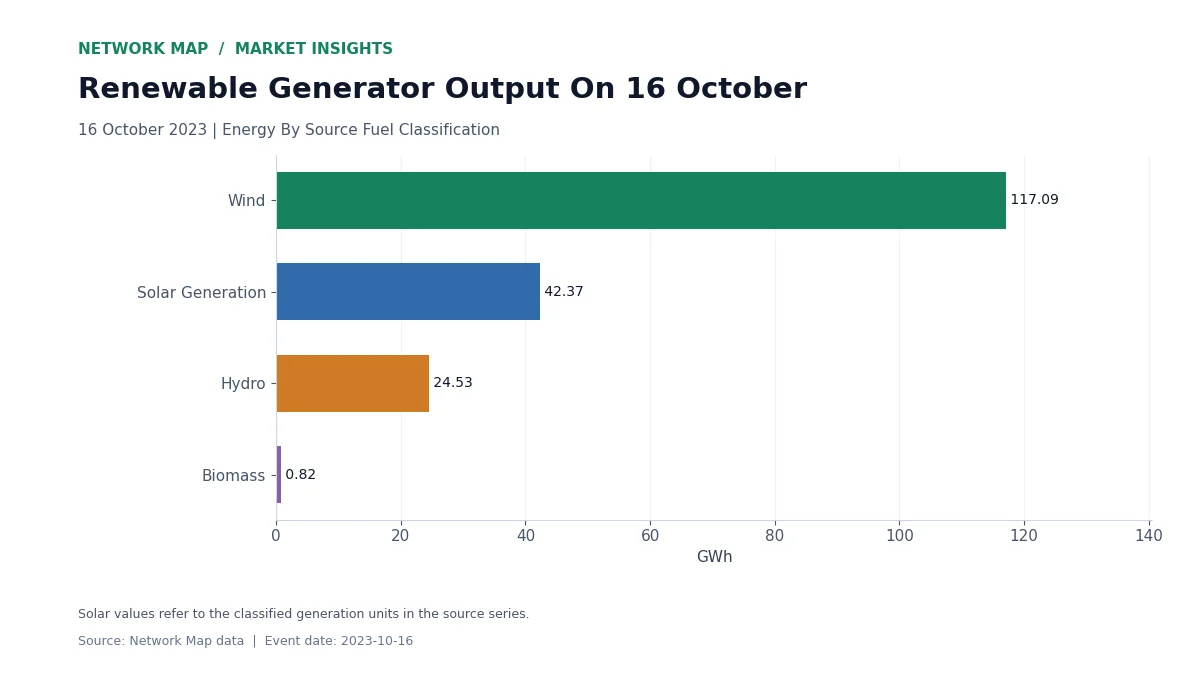
Solar generation totalled 42.37 GWh on 16 October. Together, wind and solar supplied 159.46 GWh in the classified generator series. Hydro contributed 24.53 GWh and biomass contributed 0.82 GWh.
The second chart keeps those fuel groups separate. Wind’s contribution was the largest of the four on this date. Solar output was close to its October daily average of 40.80 GWh, while the wind result stood well above its own monthly mean.
Take The Volume Event Into A Revenue Review
The generation result identifies a strong output day. The next operating question is how the energy was distributed through the day and which prices applied when it was delivered. Matching unit output to interval prices connects the volume event to an asset’s revenue pattern.
This makes 16 October a useful starting point for a unit-by-unit comparison: check the recorded energy, inspect the intraday profile, and reconcile the output with prices for matching timestamps.
Figures use positive energy from Network Map’s daily unit records, grouped by the source fuel classification. Solar figures refer to the classified generation units. The date is the fixed UTC+10 calendar date of the interval end, from 00:00 through 23:55 on 16 October 2023.