Market analysis of 30 May 2023
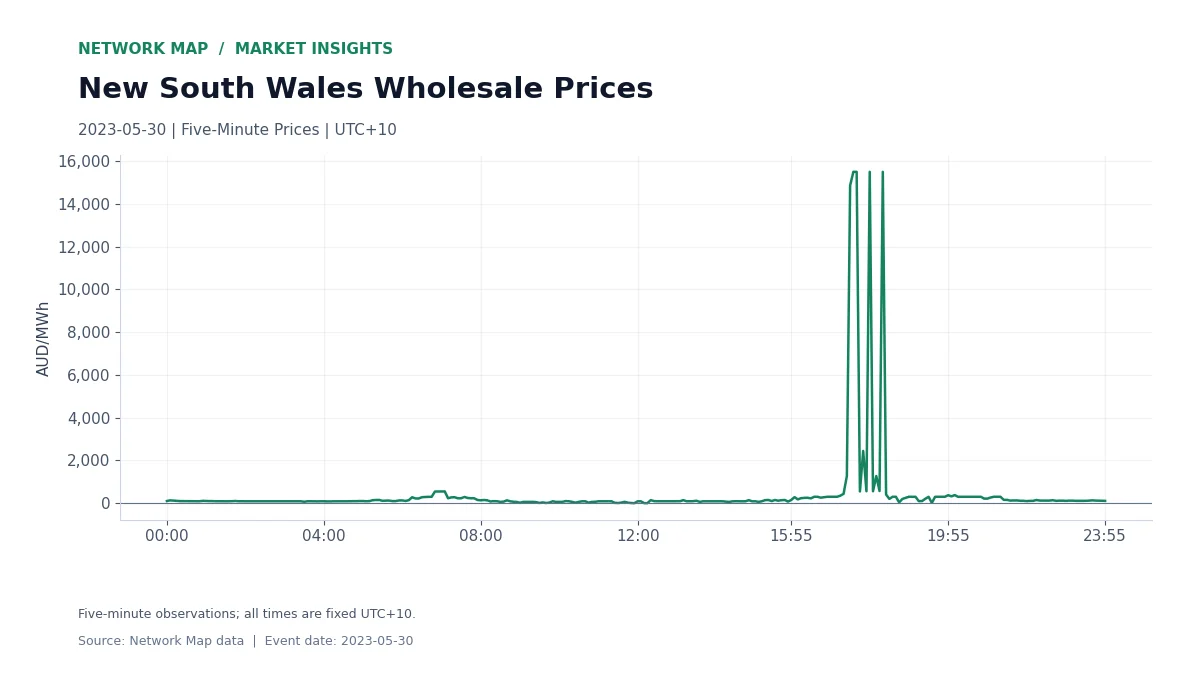
New South Wales reached AUD 15,500/MWh at 17:30 on 30 May 2023. The regional wholesale electricity price had been just AUD 0.22/MWh at 11:55. Within the same recorded date, the market moved from a near-zero price to a pronounced evening spike.
The arithmetic average across all 288 five-minute observations was AUD 428.70/MWh. No observation was negative. This was a day when the commercial contrast was between inexpensive and very expensive electricity, rather than between positive and negative prices.
The Evening Spike Sets The Shape
The exact daily maximum of AUD 15,500/MWh appeared in two five-minute observations. At 17:55, the price was still AUD 15,499.99/MWh. The price chart shows the concentrated evening rise against the rest of the day.
For an asset-level review, that shape directs attention to the output delivered during the expensive block. Comparing only a daily energy total with the daily average would hide the difference between production around midday and production during the evening spike.
Demand Rises From Its Midday Trough
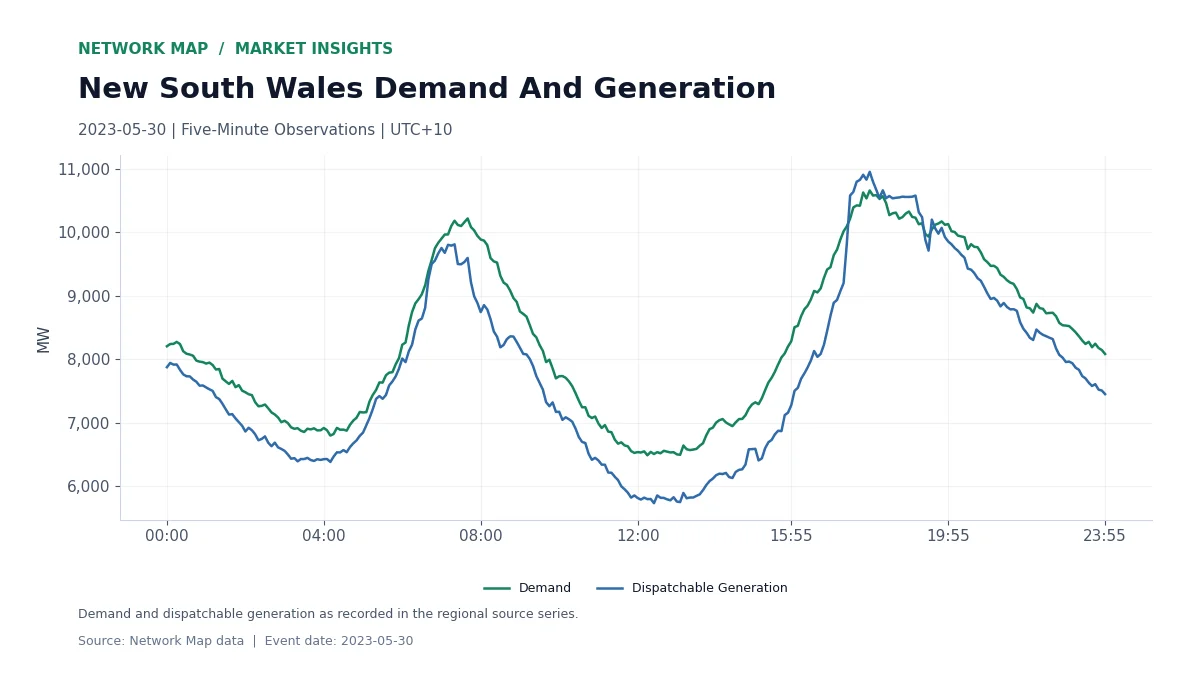
Recorded demand reached its minimum of 6,488.52 MW at 12:15 and its maximum of 10,660.18 MW at 17:55. The increase between those daily extrema was 4,171.66 MW. Dispatchable generation also peaked at 17:55, at 10,954.04 MW.
These timelines give an operating sequence for the event: a low-price midday period, a rising demand profile, and an evening block with very high prices. The paired demand and generation chart lets an analyst align those regional conditions with the performance of a particular unit or load.
Use The Event As A Revenue Check
A useful review starts by isolating the evening observations and matching them to the asset’s recorded output. Storage operators can compare their charging and discharge windows. Generators can check how much energy they delivered during the high-price block. Flexible consumers can review which loads coincided with the expensive period.
The next step is interval-level revenue reconciliation, using the same dates and timestamps throughout. That keeps the price event connected to actual operation rather than treating the daily average as a stand-in for every hour.
Figures come from Network Map’s regional observations dated 30 May 2023. Prices are in Australian dollars per megawatt-hour. Times use fixed UTC+10, and the daily average is an equal-weight mean of the five-minute prices.
Explore The Data
Markets, Revenue Reconciliation, Battery Revenue Benchmarks.