Market analysis of 20 November 2022
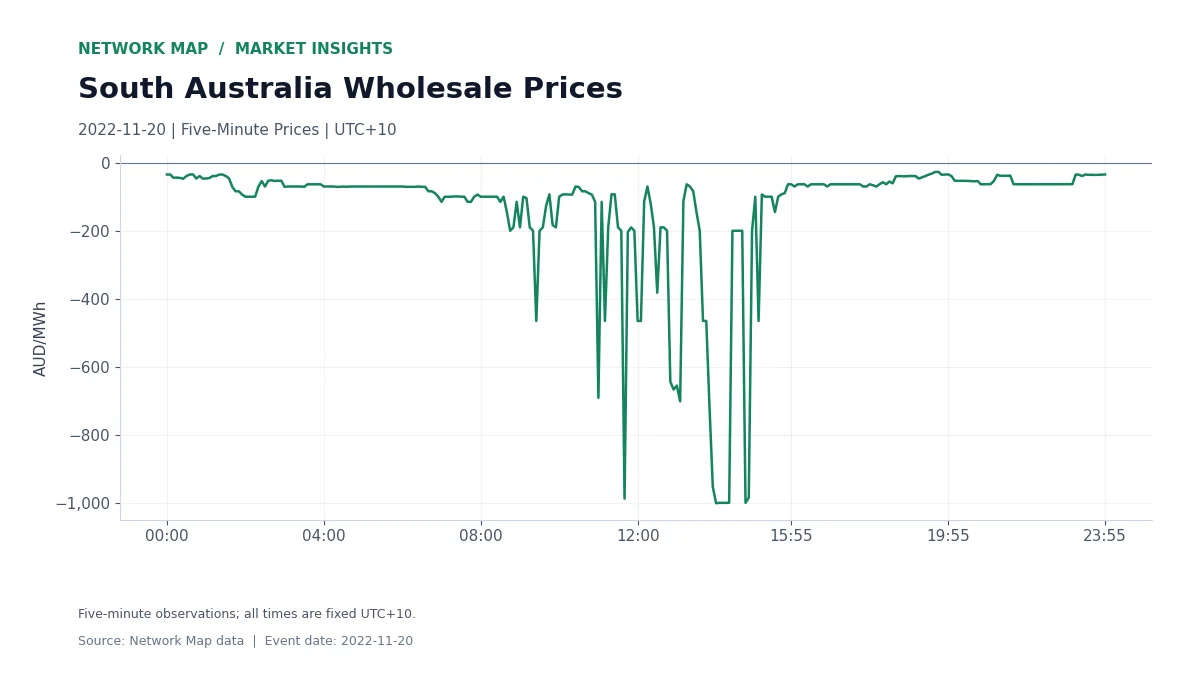
South Australia recorded a negative wholesale electricity price in every one of its 288 five-minute observations on 20 November 2022. The day’s arithmetic average was −AUD 132.05/MWh. Even the highest price remained below zero, at −AUD 26.87/MWh at 19:40.
That makes this a different commercial pattern from a short midday dip. For a generator selling at the regional spot price, negative-price exposure extended through the entire recorded date. For a flexible consumer, the price curve created a day-long signal to examine when electricity could be used.
The Deepest Fall Arrives In The Afternoon
The lowest recorded price was −AUD 1,000.00/MWh, rounded to two decimal places, at 14:00. The spread between the day’s highest and lowest prices was AUD 973.13/MWh. A wholly negative day still contained a wide range of charging and consumption incentives.
The first chart shows why a daily average is only the starting point. The pronounced afternoon fall sits inside a much longer period of negative prices. An operating schedule built around the average would treat those intervals as equivalent; the five-minute curve shows that they were not.
Demand And Generation Have Different Turning Points
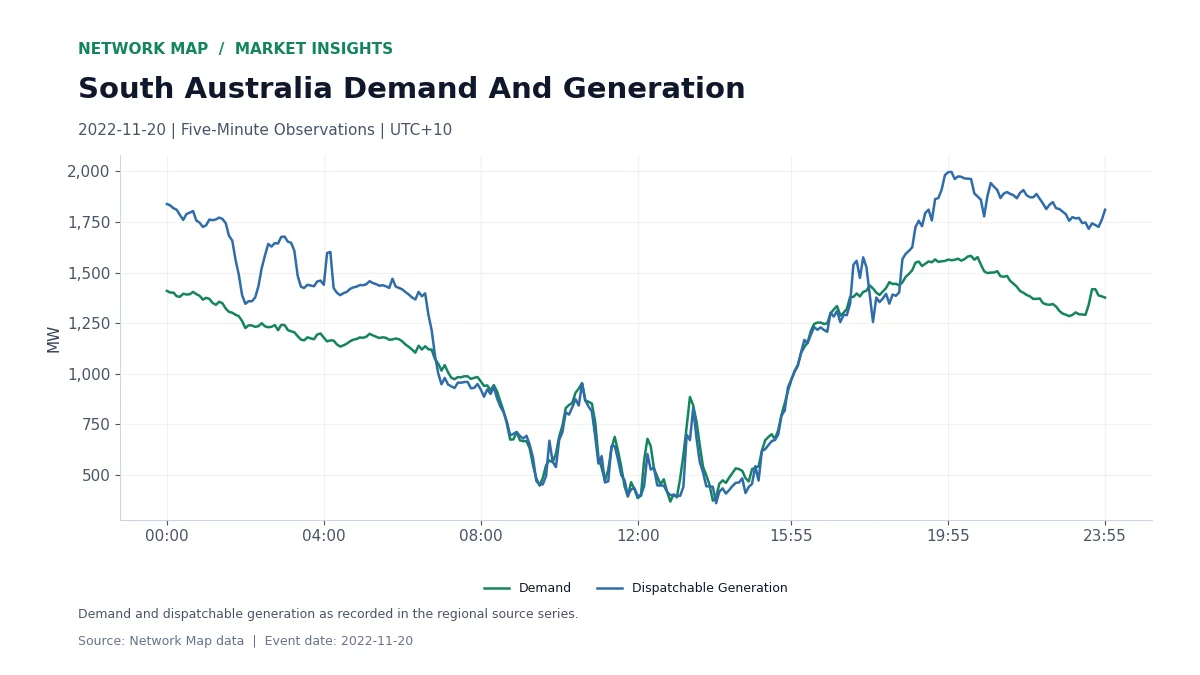
Recorded regional demand reached its minimum of 368.41 MW at 12:50. At that observation, the wholesale price was −AUD 642.96/MWh and dispatchable generation was 400.25 MW. The price minimum came later, at 14:00, when dispatchable generation stood at 360.47 MW.
Demand subsequently climbed to 1,582.83 MW at 20:30. The contrast between the midday trough and evening peak is visible in the second chart. Reading both traces together keeps the physical operating pattern alongside the price signal.
What The Day Means For Operations
The useful question for a battery operator is where charging belongs within the negative-price window and how that schedule connects to subsequent discharge opportunities. For a generator, the same curve is a starting point for comparing interval output with interval revenue. The deepest negative price and the lowest demand occurred at different times, so the analysis needs the timestamps, not just daily totals.
This analysis uses Network Map’s regional observations dated 20 November 2022. Prices are in Australian dollars per megawatt-hour. Times use fixed UTC+10, and the daily price average gives equal weight to each five-minute observation.
Explore The Data
Markets, Revenue Reconciliation, Battery Revenue Benchmarks.