Market analysis of 12 October 2026
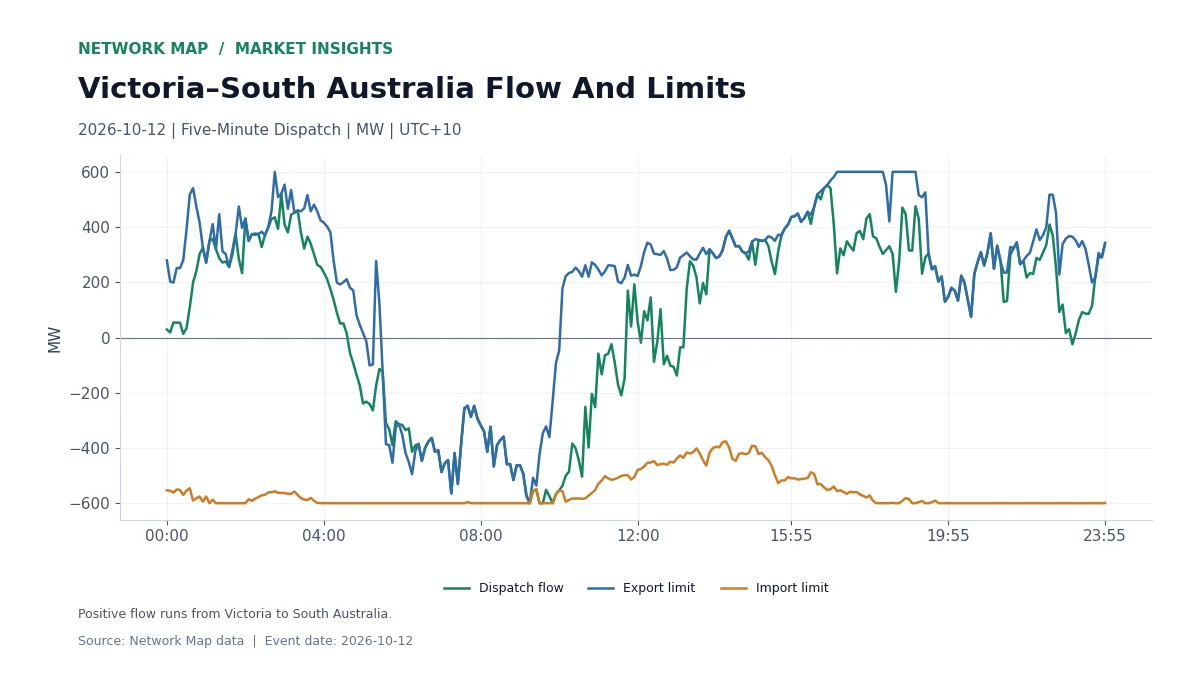
The Victoria–South Australia (Heywood) interconnector carried a peak dispatch flow of 600.00 MW on 12 October 2026, flowing from South Australia to Victoria. Positive flow, from Victoria towards South Australia, applied in 192 of 288 five-minute intervals (16.0 hours); flow ran the other way in 96 intervals (8.0 hours).
The highest flow towards South Australia was 552.05 MW at 16:50, and the strongest flow towards Victoria was 600.00 MW at 09:15. Published losses on the link peaked at 55.03 MW.
Flow Against The Transfer Limits
The first chart plots five-minute dispatch flow with the export and import limits that applied in each interval, in fixed UTC+10. Where the flow line meets a limit, the link was running at the transfer capability set for that interval, and regional prices can separate.
The Wider Interconnector Picture
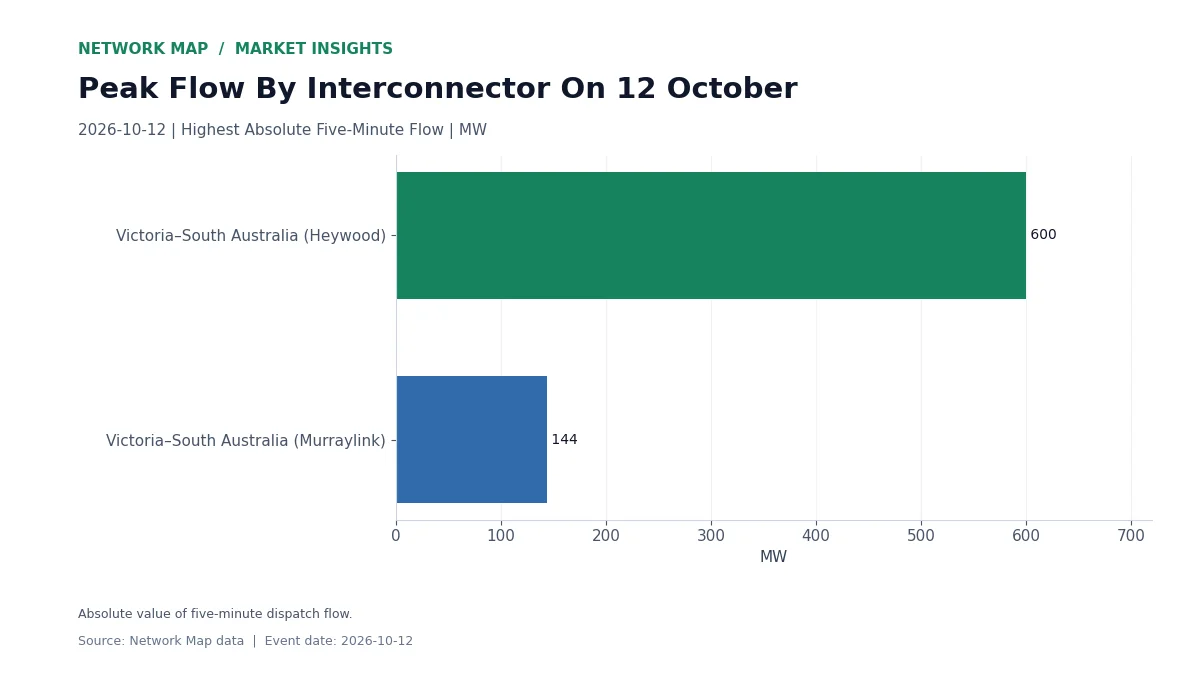
Other links on the same day: Victoria–South Australia (Murraylink) peaked at 144 MW. The second chart compares the peak absolute flow on each link.
Why Transfers Matter For Prices
Interconnector flows link regional prices. When a link is unconstrained, prices in neighbouring regions tend to move together; when it reaches a limit, they can split. For a trader or generator, reading flow against the limits explains why a regional price moved apart from its neighbour.
Figures use Network Map’s five-minute interconnector records dated 12 October 2026, fixed UTC+10. Sign convention: positive flow runs from Victoria to South Australia.