Market analysis of 25 December 2025
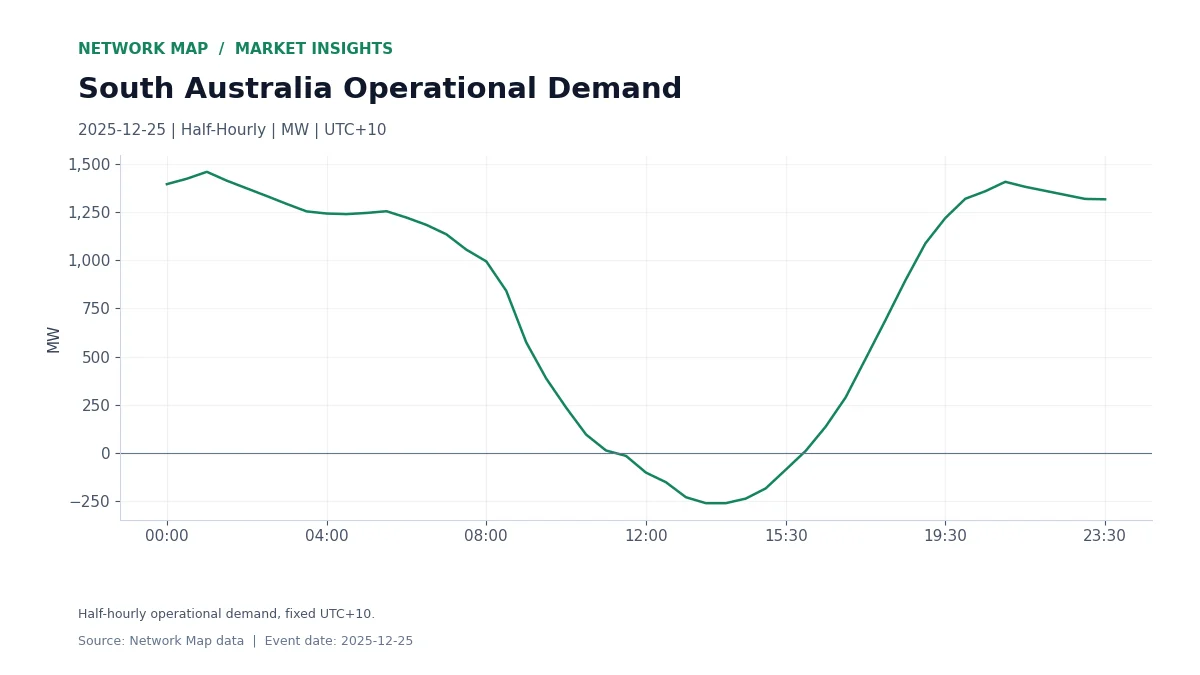
South Australia’s operational demand fell to −263 MW on 25 December 2025, recorded at 13:30 and 14:00. It was the lowest regional value in Network Map’s stored half-hourly operational-demand series, which runs from May 2024. Operational demand was below zero in 9 of the day’s 48 half-hour observations.
Negative operational demand means rooftop and other small-scale generation inside the region exceeded the electricity drawn from the transmission-connected system. The day’s highest reading was 1,461 MW at 01:00.
The Christmas Day Demand Curve
The first chart shows half-hourly operational demand through the day in fixed UTC+10. Demand fell through the morning, was below zero from 11:30 to 15:30 and recovered into the evening.
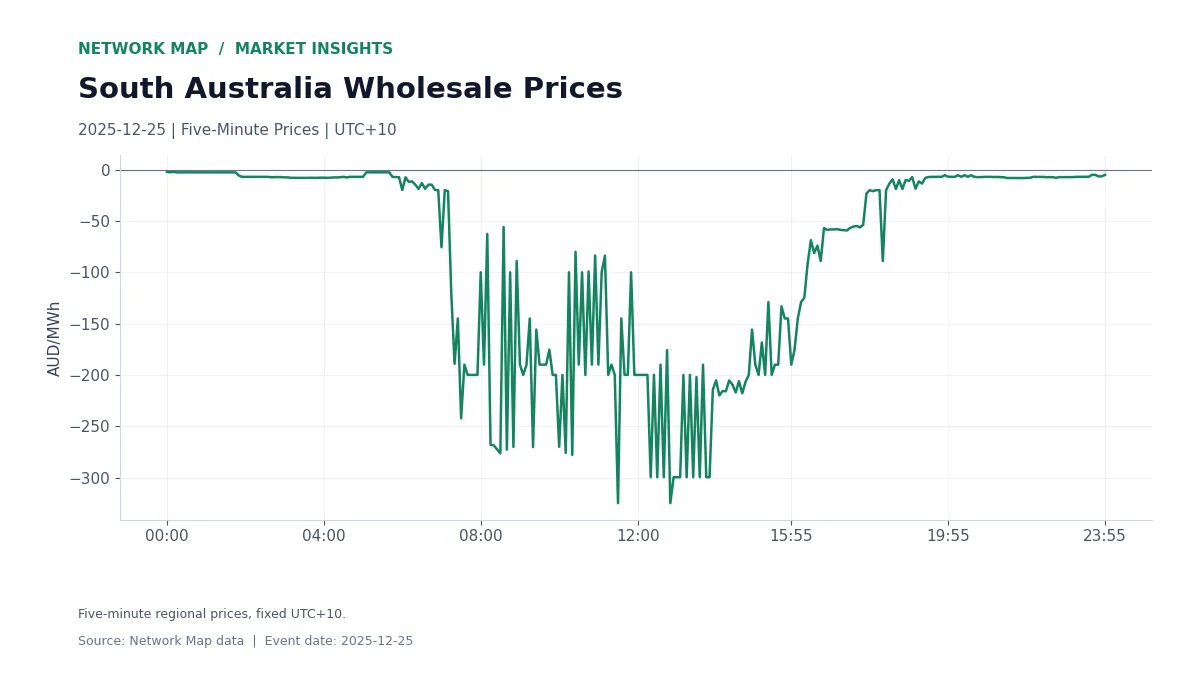
Prices Stayed Below Zero
Wholesale prices in South Australia ranged from −AUD 325.00/MWh to −AUD 2.10/MWh on 25 December. 288 of 288 five-minute prices were negative, so every recorded price was below zero. The second chart traces the five-minute price curve.
What A Negative-Demand Day Means
For storage operators, a long run of negative prices is a charging window. For utility-scale solar and wind, it is a day where output timing and bidding decide whether energy earns or costs money. The interval detail shows exactly when those conditions applied.
Figures use Network Map’s half-hourly operational-demand records and five-minute regional prices for 25 December 2025, fixed UTC+10.
Explore The Data
Markets, Battery Revenue Benchmarks, Revenue Reconciliation.