Market analysis of 18 June 2023
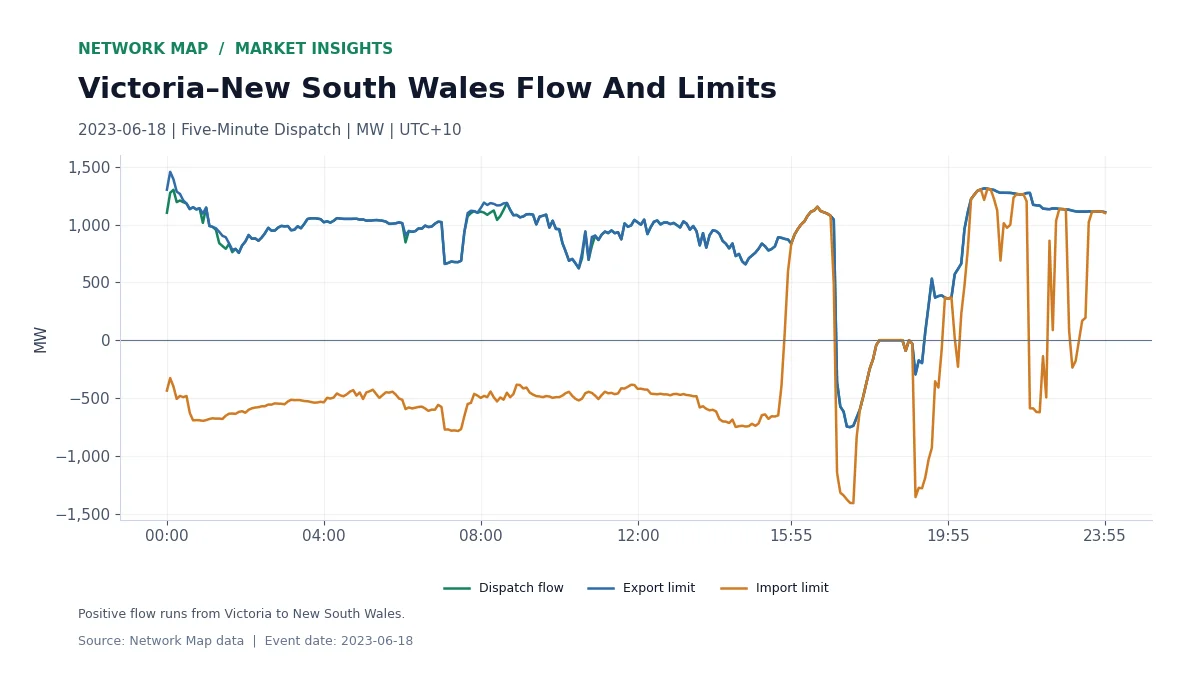
The Victoria–New South Wales interconnector carried a peak dispatch flow of 1,312.96 MW on 18 June 2023, flowing from Victoria to New South Wales. Positive flow, from Victoria towards New South Wales, applied in 261 of 288 five-minute intervals (21.8 hours); flow ran the other way in 18 intervals (1.5 hours).
The highest flow towards New South Wales was 1,312.96 MW at 20:50, and the strongest flow towards Victoria was 752.01 MW at 17:25. Published losses on the link peaked at 282.34 MW.
Flow Against The Transfer Limits
The first chart plots five-minute dispatch flow with the export and import limits that applied in each interval, in fixed UTC+10. Where the flow line meets a limit, the link was running at the transfer capability set for that interval, and regional prices can separate.
The Wider Interconnector Picture
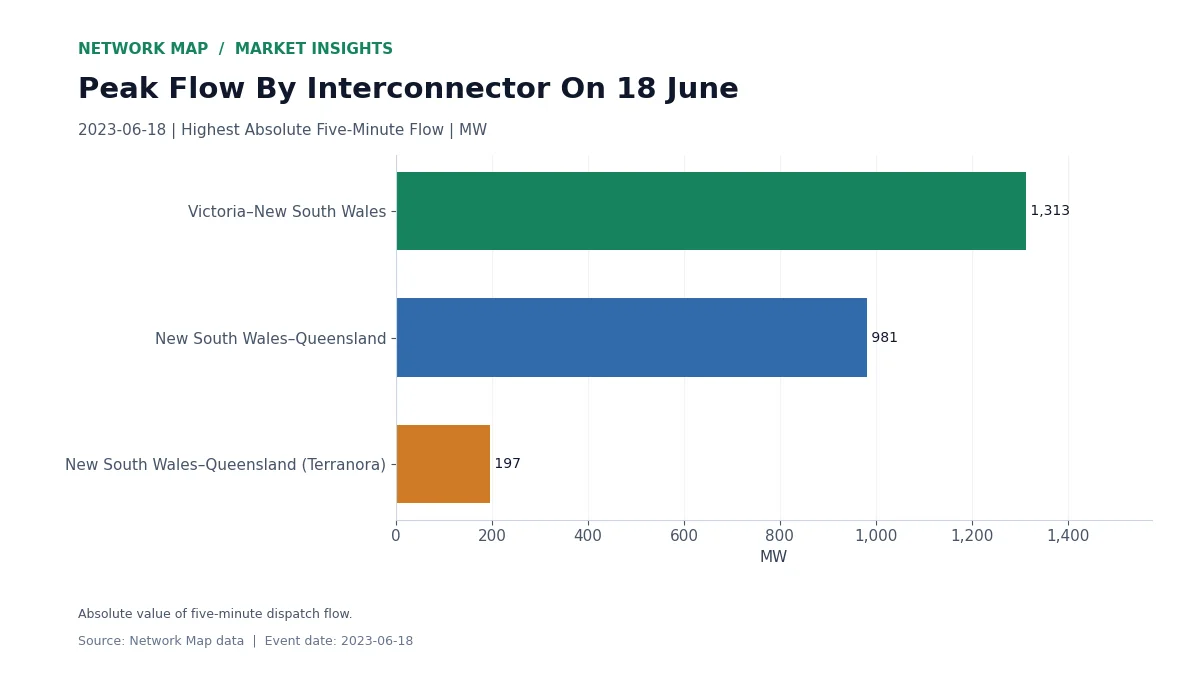
Other links on the same day: New South Wales–Queensland peaked at 981 MW; New South Wales–Queensland (Terranora) peaked at 197 MW. The second chart compares the peak absolute flow on each link.
Why Transfers Matter For Prices
Interconnector flows link regional prices. When a link is unconstrained, prices in neighbouring regions tend to move together; when it reaches a limit, they can split. For a trader or generator, reading flow against the limits explains why a regional price moved apart from its neighbour.
Figures use Network Map’s five-minute interconnector records dated 18 June 2023, fixed UTC+10. Sign convention: positive flow runs from Victoria to New South Wales.